This package is designed to determine relative importance of predictors for both regression and classification models. The determination of relative importance depends on how one defines importance; Budescu (1993) and Azen and Budescu (2003) proposed using dominance analysis (DA) because it invokes a general and intuitive definition of "relative importance" that is based on the additional contribution of a predictor in all subset models. The purpose of determining predictor importance in the context of DA is not model selection but rather uncovering the individual contributions of the predictors.
In case the target is a continuous variable, the package determines the dominance of one predictor over another by comparing their incremental R-squared contribution across all subset models. In case the target variable is binary, the package determines the dominance over another by comparing their incremental Pseudo R-Squared contribution across all subset models.
Use the following command to install the package:
pip install dominance-analysis
- data : Complete Dataset, should be a Pandas DataFrame.
- target : Name of the target variable, it should be present in passed dataset.
- top_k : No. of features to choose from all available features. By default, the package will run for top 15 features.
- objective : It can take value either 0 or 1. 0 for Classification and 1 for Regression. By default, the package will run for Regression.
- pseudo_r2 : It can take one of the Pseudo R-Squared measures - "mcfadden","nagelkerke", "cox_and_snell" or "estrella", where default="mcfadden". It's not needed in case of regression (objective=1).
- data_format: It can take value 0, 1 or 2. 0 is for raw data, 1 is when correlation matrix (correlation of predictors with the target variable) is being passed, 2 is when covraiance matrix (covariance of predictors with the the traget variable) is being passed. By default, the package will run for raw data (data_format=0). This parameter is not needed in case of classification.
Dominance Analysis, according to Azen and Budescu meets three important criteria for measuring relative importance. First, the technique should be defined in terms of its ability to reduce error in predicting the outcome variable. Next, it should permit direct comparison of measures within a model (that is, X1 is twice as important as X2). Finally, the technique should permit inferences concerning an attribute's direct effect (that is, when considered by itself), total effect (that is, when considered with other attributes) and partial effect (that is, when considered with various combinations of other predictors). Hence, Dominance analysis is both robust and intuitive and its interpretation is also very straightforward.
Dominance Analysis is unique as it measures relative importance in a pairwise fashion, and the two predictors are compared in the context of all 2(p−2) models that contain some subset of the other predictors. So, if we have a total of 'p' predictors, we will build 2p-1 models (all possible subset models) and compute the incremental R2 contribution of each predictor to the subset model of all other predictors. The additional contribution of a given predictor is measured by the increase in R2 that results from adding that predictor to the regression model.
Let's consider a scenario when we have 4 predictors; X1, X2, X3 and X4. We will have to build a total of 24-1 models i.e. 15 models- 4C1 = 4 models with only one predictor, 4C2 = 6 models with two predictors each, 4C3 = 4 models with three predictors each and 1 (4C4) complete model with all 4 predictors. Thus, the additional contributions of X1 are computed as the increases in the proportion of variance accounted for when X1 is added to each subset of the remaining predictors (i.e., the null subset {.}, {X2}, {X3}, {X4}, {X2X3}, {X2X4}, {X3X4} and {X2X3X4}). Similarly, the additional contributions of X2 are the increases in the proportion of variance accounted for when X2 is added to each subset of the remaining predictors (i.e., the null subset {.}, {X1}, {X3}, {X4}, {X1X3}, {X1X4}, {X3X4} and {X1X3X4})
Below is the illustration of formulas used to compute the averaged additional contributions of X1 and X2 within model size in the poupulation with four predictors (We use the notation  to represent the proportion of variance in Y that is accounted for by the predictors in the model X. For example,
 represents the proportion of variance in Y that is accounted for by the model consisting of X1 and X3. The additional contribution of a given predictor is measured by the increase in proportion of variance that results from adding that predictor to the regression model):

Table 1
The measure for proportion of variance that we have used for regression is R2 but since we don't have R2 in logsitic regression/classification models, we have used Pseudo R2.
The beauty of the math of Dominance Analysis is that the sum of the overall average incremental R2 of all predictors is equal to the R2 of the complete model (model with all predictors). Hence, the total R2 can be attributed to each predictor in the model. Below is an illustration of Dominance Analysis in the Population for Hypothetical example with four predictors:

Table 2
It can bee seen that the Percentage Relative Importance of predictors has been computed by dividing the Overall Average Incremental R2 contribution of predictors by the R2 of the complete model. This explains the intuitive nature of Dominance Analysis wherein the overall R2 of the model can be attributed to individual predictors within the model.
Measures of fit in logistic regression can be classified by those based on sums of squares and those based on maximum likelihood statistics. Reviews of a variety of measures of fit proposed for logistic regression can be found in Amemiya (1981), Menard (2000), Mittlbock and Schemper (1996) and Zheng and Agresti (2000). Given the large number of proposed measures, criteria for defining appropriate R2 analogues need to he determined. The following criteria, which are also found in the linear regression literature (e.g., Kvilseth. 1985: Van den Burg & Lewis, 1988), were used to select R2 analogues for logistic regression:
- Boundedness: The measure should vary between a minimum of zero, indicating complete lack of fit, and a maximum of one, indicating perfect fit.
- Linear invariance: The measure should be invariant to nonsingular linear transformations of the variables (Ys and Xs).
- Monotonicity: The measure should not decrease with the addition of a predictor.
- Intuitive Interpretability: The measure of fit is intuitively interpretable, in that it agrees with the scale of the linear case for intermediate values.
Based on these criteria, the following four R2 analogues were chosen that satisfied at least three of these four properties:
1. McFadden's Pseudo-R Squared
McFadden's Pseudo-R squared measure is defined as :
This measure satisfies all the four properties.
2. Nagelkerke Pseudo-R Squared
Nagelkerke Pseudo-R squared measure is defined as :
This measure satisfies three of the four properties and doesn't satisfy the property of Interpretability.
3. Cox and Snell R-Squared
Cox and Snell Pseudo-R squared measure is defined as :
This measure satisfies three of the four properties.
4. Estrella R-Squared
Estrella Pseudo-R squared measure is defined as :
This measure satisfies all the four properties.
Using each of these four R2 analogues, the additional contribution of a given predictor to a specific logistic model can be measured as the change (i.e., increase) in the R2 analogues when the predictor is added to the model. Even though, all the four measures will give similar results, we recommend using either Estrella's (1998) model fit measure or McFadden's (1974) measure for conducting dominance analysis in logistic regression. We have a slight preference for McFadden's measure (and that is what the package will compute by default) because it is computationally simpler, but both McFadden's and Estrella’s measures satisfy the minimum requirements for an R2 analogues.
Note: Since, Dominance Analysis is computationally intensive as it builds all subset model (2p-1 models), we have provided the user the flexibility to choose number of top predictors that they want to compute relative importance for. For regression, Top K features are selected based on F-regression and for classification it is based on Chi-Squared statistic. Dominance Analysis can be used in combination with Principal Component Analysis (PCA) or Factor Analysis or any other feature reduction algorithm for getting accurate and intutive importance of predictors.
As described earlier, a relative importance measure should be able to describe a predictor's direct, total and partial effect, therefore in the Dominance Statistics, we have come up with four different types of Dominance measures. These measures have been conceptualized, defined and formulated by us and are unique to this library. Below are the definitions and interpretations of the measures:
-
Interactional Dominance - This is the incremental R2 contribution of the predictor to the complete model. Hence, the Interactional Dominance of a particular predictor 'X' will be the diffrence between the R2 of the complete model and the R2 of the model with all other predictors except the particular predictor 'X'.
Consider a scenario when we have Y as the dependent variable and four predictors X1, X2, X3 and X4, let R2Y.X1,X2 be the R2 of the model between Y and X1, X2 ; R2Y.X1,X3 be the R2 of the model between Y and X1, X3 so on and so forth. In this case, the interactional dominance of predictor X1 will be R2Y.X1,X2,X3,X4 - R2Y.X2,X3,X4.
Hence, interactional dominance can be interpreted as the incremental impact or incremental variability explained by the predictor in presence of all other predictors. -
Individual Dominance - The individual dominance of a predictor is the R2 of the model between the dependent variable and the predictor. So, the individual dominanace of predictor X1 will be R2Y.X1.
Hence, individual dominance can be interpreted as the variability explained by the predictor alone or the quantum of impact that a predictor will have in absence of all other predictors. -
Average Partial Dominance - This is average of average incremental R2 contributions of the predictor to all subset models except complete model and bi-variate (when only one predcitor is present) model.
Hence, this can be interpreted as the average impact that a predictor has when it is available in all possible combinations with other predictors except the combination when all predcitors are available. -
Total Dominance - The last measure of dominance summarizes the additional contributions of each predictor to all subset models by averaging all the conditional values. In the example on table 3, this consists of averaging the four averaged entries in each column.
In below table, we have illustrated the calculation used to arrive at the four measures of dominance.

Table 3
If we calculate the four measures of dominance from the above example, we will get the following values:

Table 4
The following three levels of dominance can be achieved between each pair of predictors in Dominance Analysis:
- Complete Dominance - One predictor is said to completely dominate another predictor if its dominance holds across all possible subset models (that do not include the two predictors under comparison). Back to the four-predictor model, for example, complete dominance of X1 over X2 is achieved if the additional R2 contribution of X1 is more than that of X2 to the null model, the model consisting of X3, the model consisting of X4, and the model consisting of both X3 and X4. In Table 3, we can see that incremental R2 of X1 is greater than that of X2 for all subset models and hence X1 completely dominates X2.
If the additional contributions are inconsistent in favoring the same predictor across all subset models, then complete dominance is undetermined while weaker levels of dominance may still be achieved. - Conditional Dominance - If a predictor’s averaged additional contribution within each model size is greater than that of another predictor, then the first predictor is said to conditionally dominate the latter. Here, the model size is indicated by the number of predictors included in a given model. If a predictor’s averaged additional contribution is greater for some model sizes but not for all, then conditional dominance between the two predictors cannot be established.
- General Dominance - If overall averaged additional R2 contribution of one predictor is greater than the other then that predictor is said to generally dominate the other.
The three levels of dominance (complete, conditional,and general) are related to each other in a hierarchical fashion: Complete dominance implies conditional dominance, which, in turn, implies general dominance. However, for p > 3 the converse may not hold; that is, general dominance does not imply conditional dominance and conditional dominance does not necessarily imply complete dominance.
Complete code for below examples is available in example folder or the following public kernels on Kaggle: Regression - Dominane Analysis on Boston House Price Data & Classification- Dominance Analysis on Breast Cancer Dataset
Using Boston Housing Dataset downloaded from: https://www.cs.toronto.edu/~delve/data/boston/bostonDetail.html
Selecting top K features and getting R2 of the Complete Model
from dominance_analysis import Dominance_Datasets
from dominance_analysis import Dominance
boston_dataset=Dominance_Datasets.get_boston()
dominance_regression=Dominance(data=boston_dataset,target='House_Price',objective=1)

Incremental R-Squared
incr_variable_rsquare=dominance_regression.incremental_rsquare()

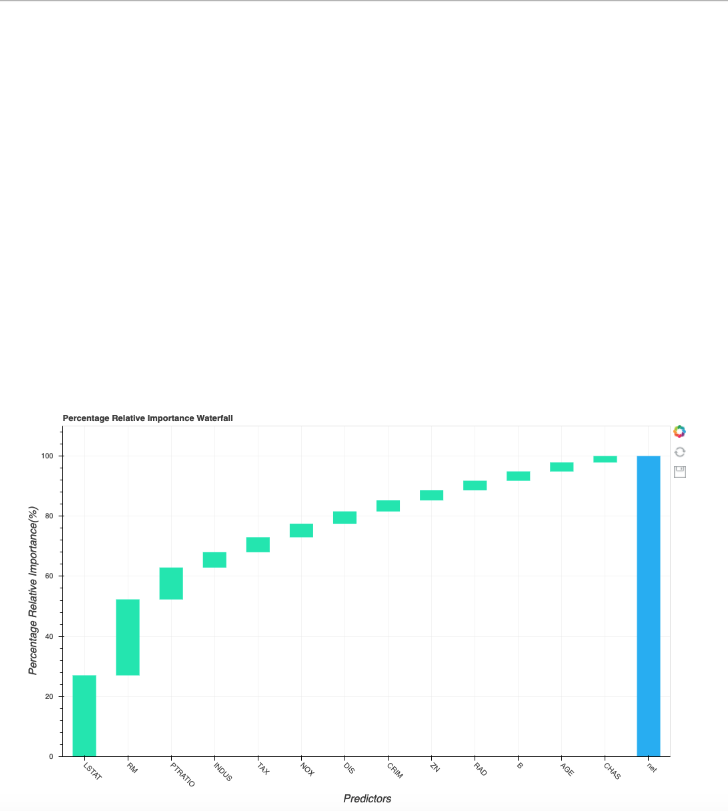
Plot Incremental R-Squared and the Dominance Curve
dominance_regression.plot_incremental_rsquare()


Dominance Statistics (R-Squared)
dominance_regression.dominance_stats()

Dominance Level
dominance_regression.dominance_level()

Breast Cancer Wisconsin (Diagnostic) dataset downloaded from: https://goo.gl/U2Uwz2
Selecting top K features and getting Pseudo R2 of the Complete Model
from dominance_analysis import Dominance_Datasets
from dominance_analysis import Dominance
breast_cancer_data=Dominance_Datasets.get_breast_cancer()
dominance_classification=Dominance(data=breast_cancer_data,target='target',objective=0,pseudo_r2="mcfadden")

Incremental Pseudo R-Squared
incr_variable_rsquare=dominance_classification.incremental_rsquare()

Plot Incremental Pseudo R-Squared
dominance_classification.plot_incremental_rsquare()


Dominance Statistics (R-Squared)
dominance_classification.dominance_stats()

Dominance Level
dominance_classification.dominance_level()

Using Boston Housing Dataset downloaded from: https://www.cs.toronto.edu/~delve/data/boston/bostonDetail.html
Getting R2 of the Complete Model
from dominance_analysis import Dominance_Datasets
from dominance_analysis import Dominance
boston_dataset=Dominance_Datasets.get_boston()
corr_data = boston_dataset.corr()
dominance_regression=Dominance(data=corr_data,target='House_Price',data_format=1)

Incremental R-Squared
incr_variable_rsquare=dominance_regression.incremental_rsquare()

Plot Incremental R-Squared and the Dominance Curve
dominance_regression.plot_incremental_rsquare()


Dominance Statistics (R-Squared)
dominance_regression.dominance_stats()

Dominance Level
dominance_classification.dominance_level()

Using Boston Housing Dataset downloaded from: https://www.cs.toronto.edu/~delve/data/boston/bostonDetail.html
Getting R2 of the Complete Model
from dominance_analysis import Dominance_Datasets
from dominance_analysis import Dominance
boston_dataset=Dominance_Datasets.get_boston()
cov_data = boston_dataset.cov()
dominance_regression=Dominance(data=cov_data,target='House_Price',data_format=2)

Incremental R-Squared
incr_variable_rsquare=dominance_regression.incremental_rsquare()

Plot Incremental R-Squared and the Dominance Curve
dominance_regression.plot_incremental_rsquare()


Dominance Statistics (R-Squared)
dominance_regression.dominance_stats()

Dominance Level
dominance_classification.dominance_level()

The Dominance Analysis package is based on the concept developed by Azen and Budescu (see references). This package is released under a MIT License. Dominance Analysis Python package has been developed by Shashank Shekhar, Sajan Bhagat, Kunjithapatham Sivakumar and Bala Koteshwar Kolluri . Pull requests submitted to the GitHub Repo are highly encouraged!
- Azen, R. (2000). Inference for predictor comparisons:Dominance analysis and the distribution of R2 differences. Dissertation Abstracts International B, 61/10, 5616.
- Azen, R., Budescu, D. V., & Reiser, B. (2001). Criticality of predictors in multiple regression. British Journal of Mathematical and Statistical Psychology, 54, 201–225.
- Azen, R., Budescu, D. V. (2003). The Dominance Analysis Approach for Comparing Predictors in Multiple Regression. Psychological Methods, 2003, Vol. 8, No. 2, 129–148. https://doi.org/10.1037/1082-989X.8.2.129
- Azen, R., Budescu, D. V. (2006). Comparing Predictors in Multivariate Regression Models: An Extension of Dominance Analysis. Journal of Educational and Behavioral Statistics Summer 2006, Vol. 31, No. 2, pp. 157-180. https://doi.org/10.3102/10769986031002157
- Azen, R., Traxel, N. (2009). Using Dominance Analysis to Determine Predictor Importance in Logistic Regression. Journal of Educational and Behavioral Statistics September 2009, Vol. 34, No. 3, pp. 319-347. https://doi.org/10.3102/1076998609332754
- Budescu, D. V. (1993). Dominance analysis: A new approach to the problem of relative importance of predictors in multiple regression. Psychological Bulletin, 114(3), 542-551. https://doi.org/10.1037/0033-2909.114.3.542
- Luo, W., & Azen, R. (2013). Determining Predictor Importance in Hierarchical Linear Models Using Dominance Analysis. Journal of Educational and Behavioral Statistics, 38(1), 3-31. https://doi.org/10.3102/1076998612458319

![azure-pipelines[bot] avatar](https://avatars.githubusercontent.com/in/9426?v=4 "azure-pipelines[bot]")