
Boom Table Panel for Grafana. Table/MultiStat plugin with multiple columns for Graphite, InfluDB, Prometheus, Azure Monitor.

- Multi column support for graphite, InfluxDB, Prometheus & Azure Monitor
- Individual thresholds for cells based on pattern
- Multi level thresholds (N number of thresholds)
- Individual aggregation method for cell based on pattern
- Time based thresholds
- Individual cell values can be transformed to helpful texts, based on pattern.
- Transformed texts can also contain actual metrics
- Units can be set at cell level based on pattern
- Row/Column name based on multiple graphite/InfluxDB/Prometheus columns
- Filter metrics
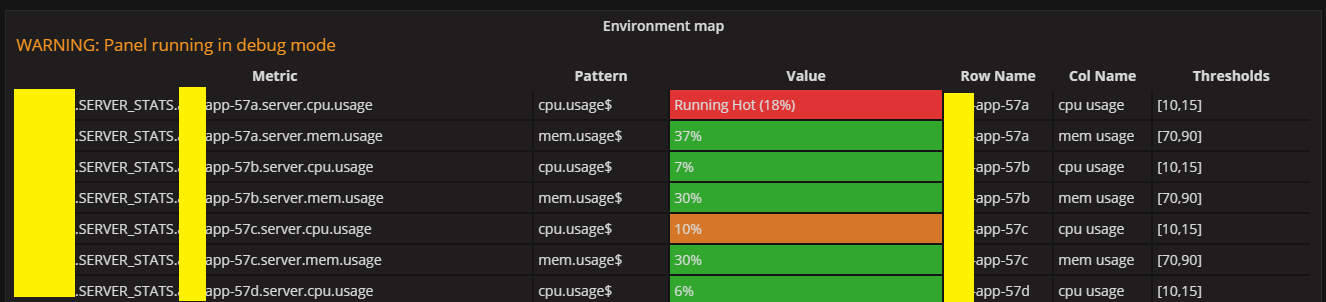
- Debug UI to test patterns
- Graphite
- InfluxDB
- Prometheus
- Azure Monitor
- AWS Cloud Watch
- Grafana version 4.5.2
- Grafana version 5.0.2
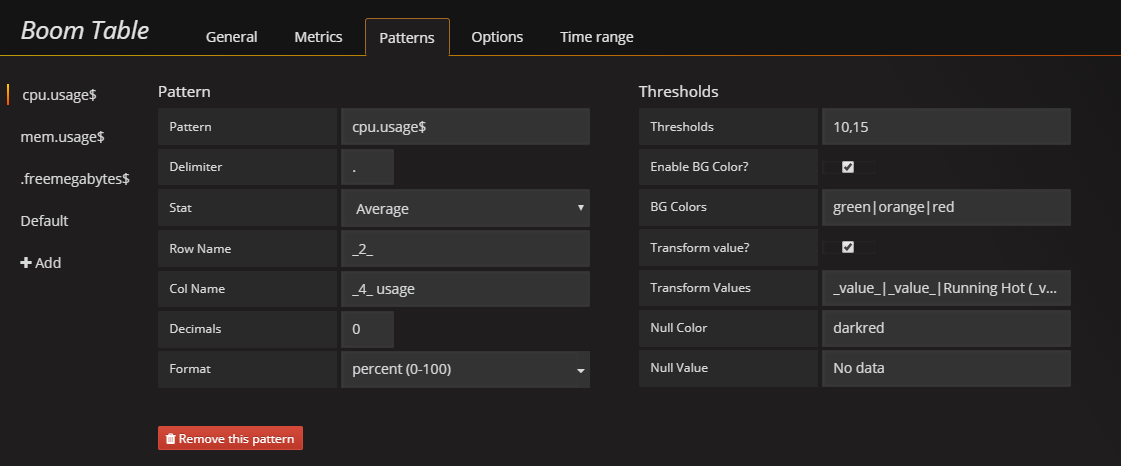
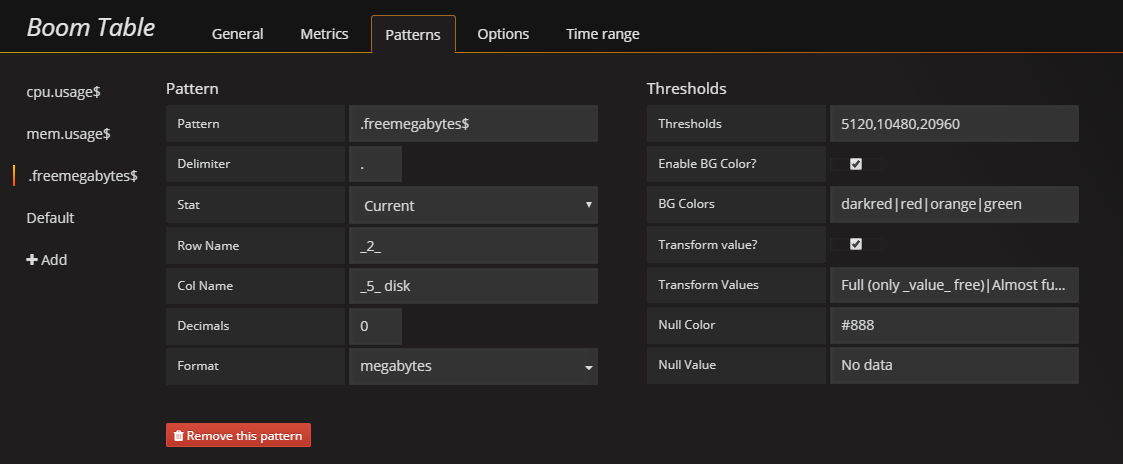
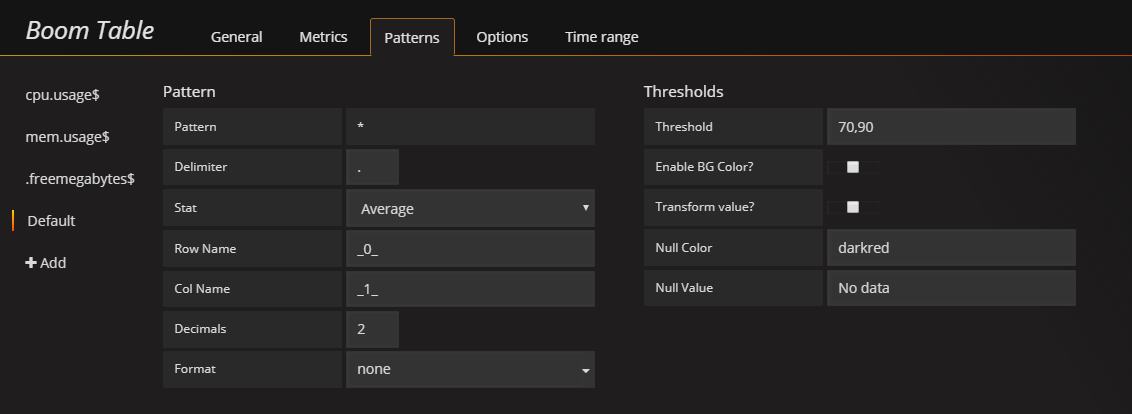
Pattern Editors Sample screenshots
Debug UI Sample screenshots
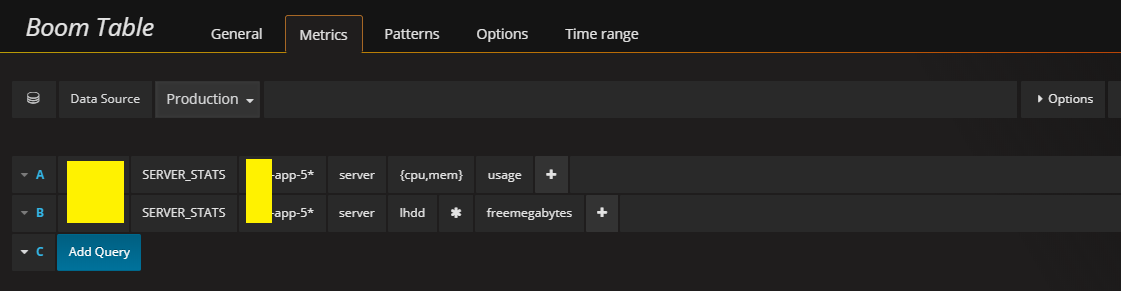
Metrics screenshots
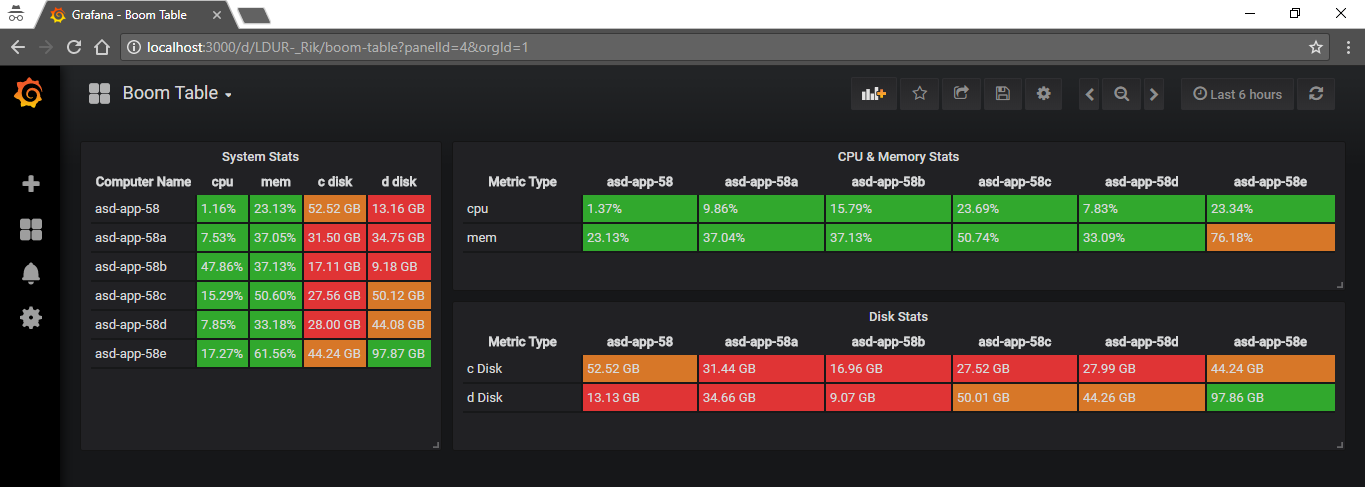
Version 5 screenshots
Pattern are regular expressions / name of the metrics. If there are multiple matching patterns, first match will be considered. To see the matching patterns, enable debug mode in Options panel.
Sample graphite series / Influx / Prometheus metrics
prod.server.my-app-01.sys.cpu.usage
prod.server.my-app-01.sys.mem.usage
prod.server.my-app-01.sys.hdd.c.freespace
prod.server.my-app-01.sys.hdd.d.freespace
prod.server.my-app-02.sys.cpu.usage
prod.server.my-app-02.sys.mem.usage
prod.server.my-app-02.sys.hdd.c.freespace
prod.server.my-app-02.sys.hdd.d.freespace
dev.server.my-app-01.sys.cpu.usage
dev.server.my-app-01.sys.mem.usage
dev.server.my-app-01.sys.hdd.c.freespace
dev.server.my-app-01.sys.hdd.d.freespace
prod.app.sales.usage.requests_per_sec
prod.app.orders.usage.requests_per_sec
alias(carbon.agents.a.cache.queries, 'Carbon A usage')
alias(carbon.agents.b.cache.queries, 'Carbon B usage')
patterns and matching metrics
usage$ --> All the CPU, Memory metrics from prod and dev and also requests_per_sec metrics and also carbon usage
cpu.usage$ --> All the CPU metrics
free --> All the disk freespace metrics
^prod --> All the prod metrics
^dev.*.usage$ --> All the cpu, mem metrics of dev servers
^prod.*.cpu.usage$ --> All the cpu metrics of prod servers
dev.server.my-app-01.sys.cpu.usage --> only dev.server.my-app-01.sys.cpu.usage
 usage$ --> Carbon usage(Note the space before the pattern)
A usage$ --> Only carbon A usage
Row and Col names are derived from series name. If n is wrapped by "_", then that will be replaced by n-th column in graphite/influxdb/prometheus metric (seperated by delimiter). Refer below examples and screenshots to get more idea. Or use debug mode to try.
Sample graphite series / Influx / Prometheus Metrics
prod.server.my-app-01.sys.cpu.usage
Pattern & Output
_4_                         --> cpu
_4_ _5_                     --> cpu usage
_4_ 2 _5_                   --> cpu 2 usage
_4_ use                     --> cpu use
Production _4_ usage        --> Production cpu usage
_series_                    --> prod.server.my-app-01.sys.cpu.usage
_1_ _1_                     --> server server
_4_ __5_                    --> cpu _usage
Note : If you prefer to change the wrapper from "_" to somthing like "~" or "__", you can do it through the option "Row / Column indentification wrapper" in options tab.
Thresholds are numbers seperated by comma. There can be multiple thresholds.
Example:
10,20
70,90,95
Thresholds can be overriden, based on day and time of the browser.
Multiple time based threshold rules can be set for any given pattern. If multiple rule matches, last rule wins. If no rule matches, default thresholds will be applicable. Example given below.
Following notations should be followed when added time based threshold rule
Name : Can be any representation in string but not more than 60 characters.
From : in HHMM format examples: 0000 2400 1330 1250
To : in HHMM format examples: 0000 2400 1330 1250
On : Days seperated by comma. Order doesnt matter. Examples; "Sat,Sun", "Mon,Sun,Tue"
Threshold : Same format as default threshold

WARNING: "From" and "To" fields will be compared against timestamp of last data received from server. If the last data point is not availble, then browser time will be considered.
TIPS : If your threshold time rage ranges between two day, (example: 2300 of saturday to 0230 of sunday), then split the rule into two each for saturdary and sunday.
NOTE : If you specify n number threshold levels in default pattern (ex: 20,30),then time based thresholds should also follow same number of levels.
Works the same way as single stat panel. Background color is a list of colors seperated by pipe symbol. Colors can be named or hexadecimal colors or rgb or rgba. Number of colors should be greater than the number of thresholds.
Example of color patterns:
green|orange|red
darkred|red|orange|red
green|red
green|#797979|rgba(0, 0, 255,0.5)|rgb(0, 0, 255)|red
Example of matching patterns:
1:  thresholds  : 5
    pattern     : green|red
    value       : 5    output  : red
    value       : 6    output  : red
    value       : 4    output  : green

2:  thresholds  : 70,90
    pattern     : green|orange|red
    value       : 95    output  : red
    value       : 85    output  : orange
    value       : 65    output  : green

3:  thresholds  : 70,90
    pattern     : red|orange|green
    value       : 95    output  : green
    value       : 85    output  : orange
    value       : 65    output  : red
Logic is same as background color. But the value to be displayed can be altered here. Display value will be replaced with the value provided. Values are seperated by pipe. if the value is wrapped with _, then it will represent the actual value
Example transformation patterns :
_value_|_value_|_value_
GOOD|BETTER|BAD
GOOD (_value_)|_value_|_value
Time to party|Ill|RIP
Sample value transformation: (Assume your metrics results, 95 and it is percentage data type)
_value_                 -->     95%
GOOD (_value_)          -->     GOOD (95%)
HOT (_value_ > threshold of 80%)     -->     HOT (95% > threshold of 80%)
Contact helpdesk        -->     Contact helpdesk
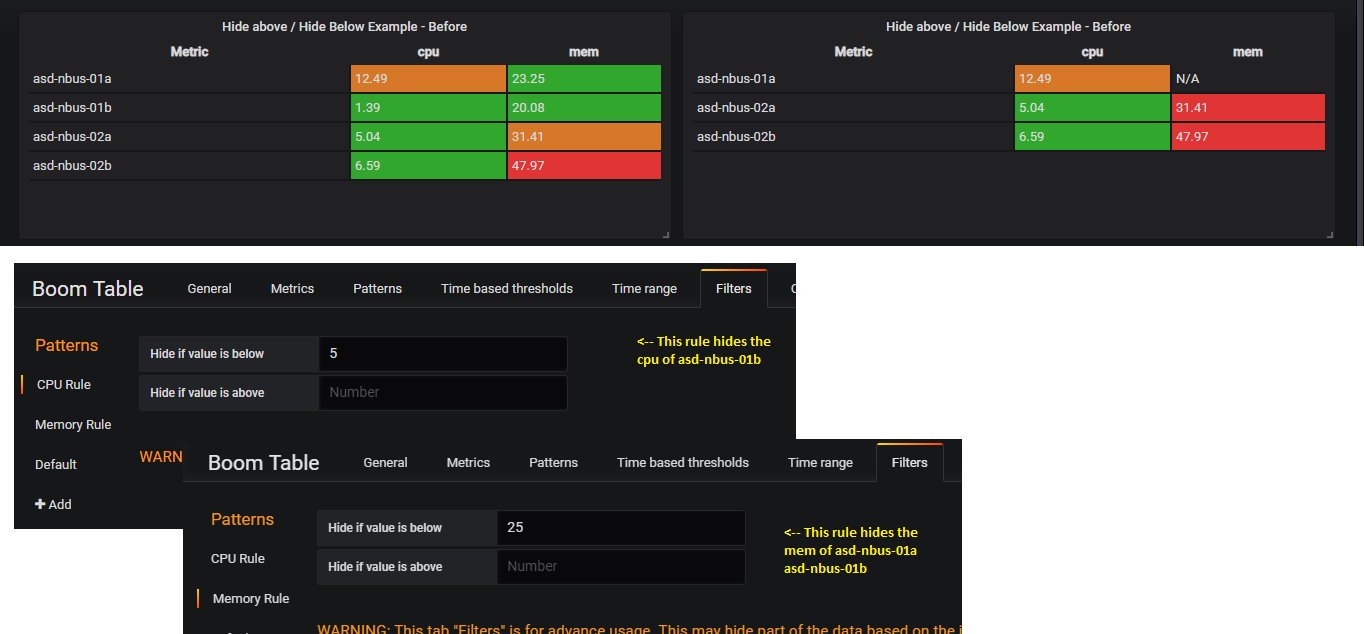
If your output have more rows and if you require to hide certain rows based on their output value, you can use the filter option to hide those rows.
Though this plugin was initially designed to support graphite, It is also capable of handling timeseries database like Prometheus. In order to achieve this, you need to alias your timeseries/Prometheus metrics to proper delimited format. Following screenshot explains plugin usage with Prometheus where the metrics are aliased with pipe delimiter. This can be any delimiter like space, dot, etc.#

Though this plugin was initially designed to support graphite, It is also capable of handling timeseries database like influxDB. In order to achieve this, you need to alias your timeseries/InfluxDB metrics to some proper delimited format. Following screenshot explains plugin usage with influxdb where the metrics are aliased with dot delimiter.This can be any delimiter like space, dot, etc.

Same as other time series data sources. You need to properly format your legend to extract the row and column name.

Version 0.4.x
- Time based thresholds
- Filter option to hide rows based on value
Version 0.3.x
- Options to name the pattern, disable the pattern, Reverse the bg colors and transform values in pattern
- Removed output data from panel model
- Bug fixes
Version 0.2.x
- Build script changed from babel to typescript
- Assign series alias as row to the default pattern
- Bug fixes
Version 0.1.x
- First working version


