Giter Site home page Giter Site logo

tripled's Introduction

TripleD

R-package to read and transform TripleD sample data to produce a database with presence-absence, density, and biomass data for benthic megafauna. The TripleD is a special quantitative sampling dredge produced and used by the NIOZ Royal Netherlands Institute for Sea Research.

This package contains all the code necessary to set up the TripleD database with time-series data collected by NIOZ. This package does not contain data; data can be requested from the NIOZ Data Archiving System (DAS).

The database output of the package can be visually interacted with using a developed Shiny app.

Installation

You can install the TripleD R-package including the HTML vignette by running the following command (beware you need to have the R-package devtools installed):

#install.packages("devtools")
devtools::install_github("dswdejonge/TripleD", build_vignettes = TRUE)

# Read vignette:
browseVignettes("TripleD") # click HTML

Contructing the database

Set up your working directory as follows in order to start with the NIOZ TripleD database:

  1. Go to the NIOZ Data Archiving System (DAS) and request the formatted TripleD data CSV files.
  2. In your working directory create a folder called 'inputfiles'. Within this folder you have to create two other folders called 'Species' and 'Stations'.
  3. Put the CSVs with all species data in the folder 'inputfiles/Species' and the CSVs with all station data in the folder 'inputfiles/Stations' (do not put any files in these folders that are not csv data files formatted for the TripleD database).
  4. Add and run the following R-script to your working directory:
# Load the library
library(TripleD)

# Loads all CSVs, checks format, and stores an R dataframe 
# in the newly created folder 'data'.
# Should not throw errors if the CSVs taken directly from DAS are used.
construct_database(in_folder = "inputfiles")

# Load the bioconversion CSV and check the input format.
check_bioconversion_input()

# Collect bathymetry from NOAA and taxonomy from WoRMS
collect_from_NOAA()
collect_from_WORMS()

# Prepare the bioconversion file to use (add valid taxon
# names and calculate mean conversions for each higher taxon)
prepare_bioconversion()

# Add extra data to the intial database (taxonomy, water depths
# from bathymetry, track lengths from coordinates and ticks,
# bearings, and ash-free dry weight using conversion data)
complete_database()

# Finalize database, by aggregating data, selecting relevant columns, and
# calculating final densities and biomass per sampling station.
finalize_database()

# There is a database with density and biomass data 
# per taxon per station.
load("database.rda")

# View definition of each database column.
att_database

# Extract a community matrix for ecological analysis,
# e.g. Ash-Free Dry Weight per m2 for all species.
CM <- get_community_matrix(database, "species", "Biomass_g_per_m2")

# There is also a database with individual size measurements 
# and weights per taxon.
load("database_individuals.rda")

# View definition of each database_individuals column.
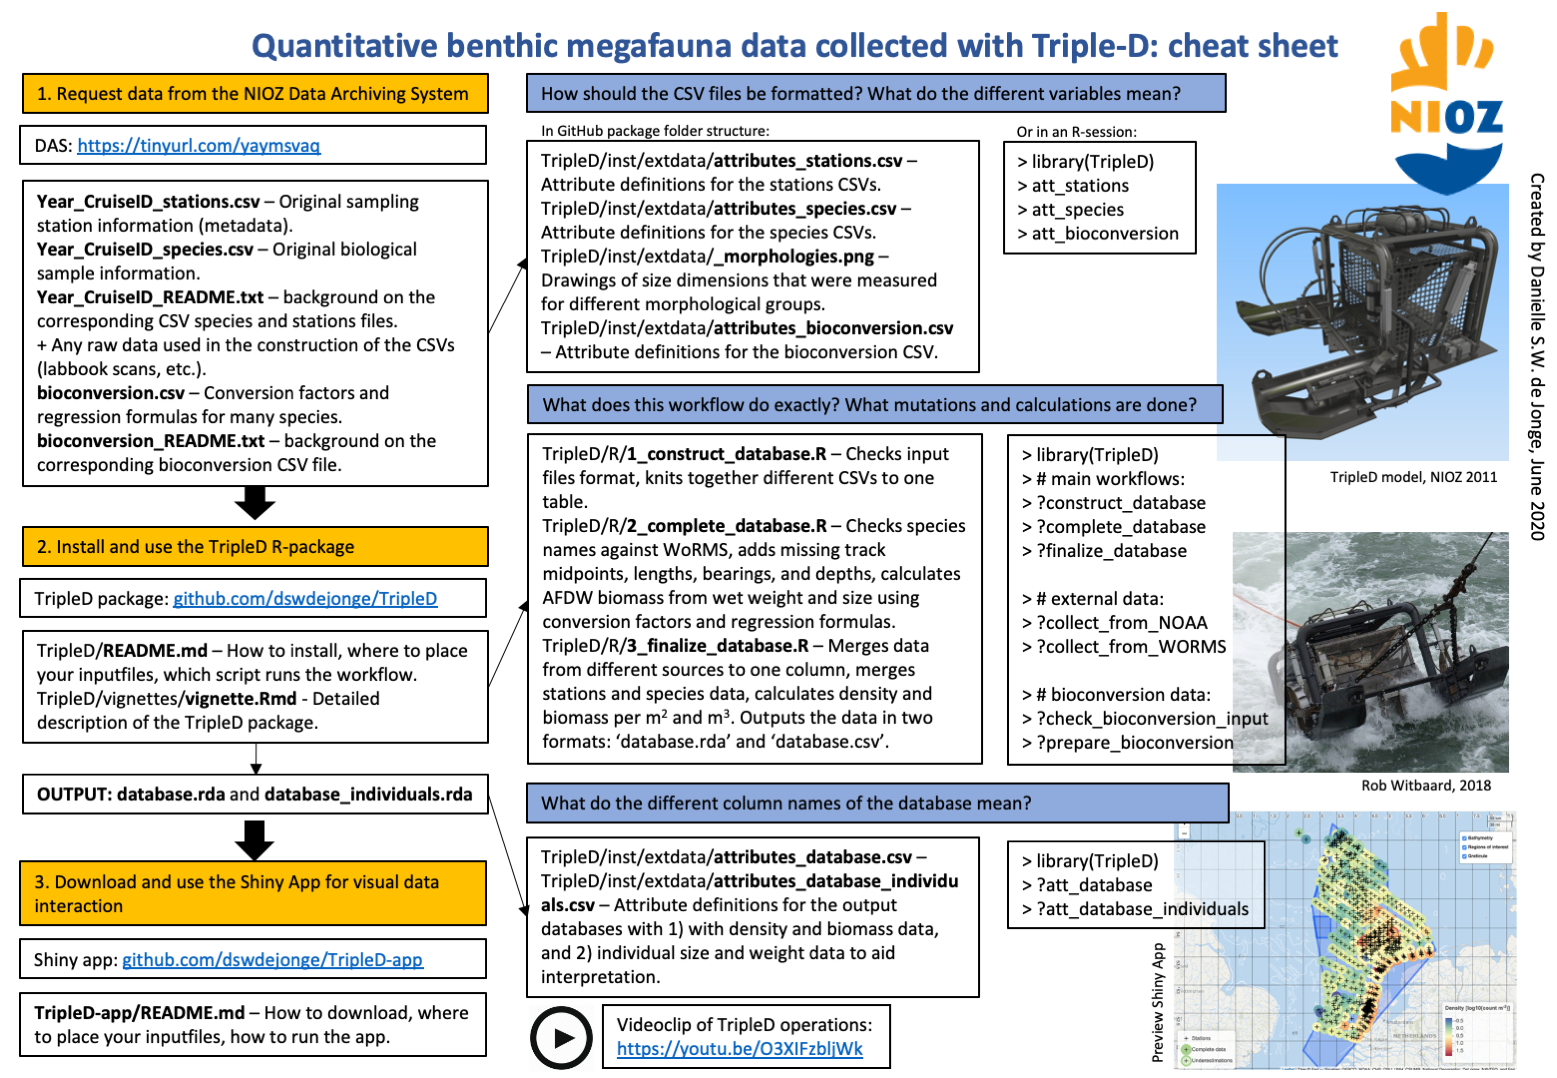
att_database_individuals

Cheat sheet

If you feel lost with the workflow and all the files, use this cheat sheet: cheat sheet

Size dimension

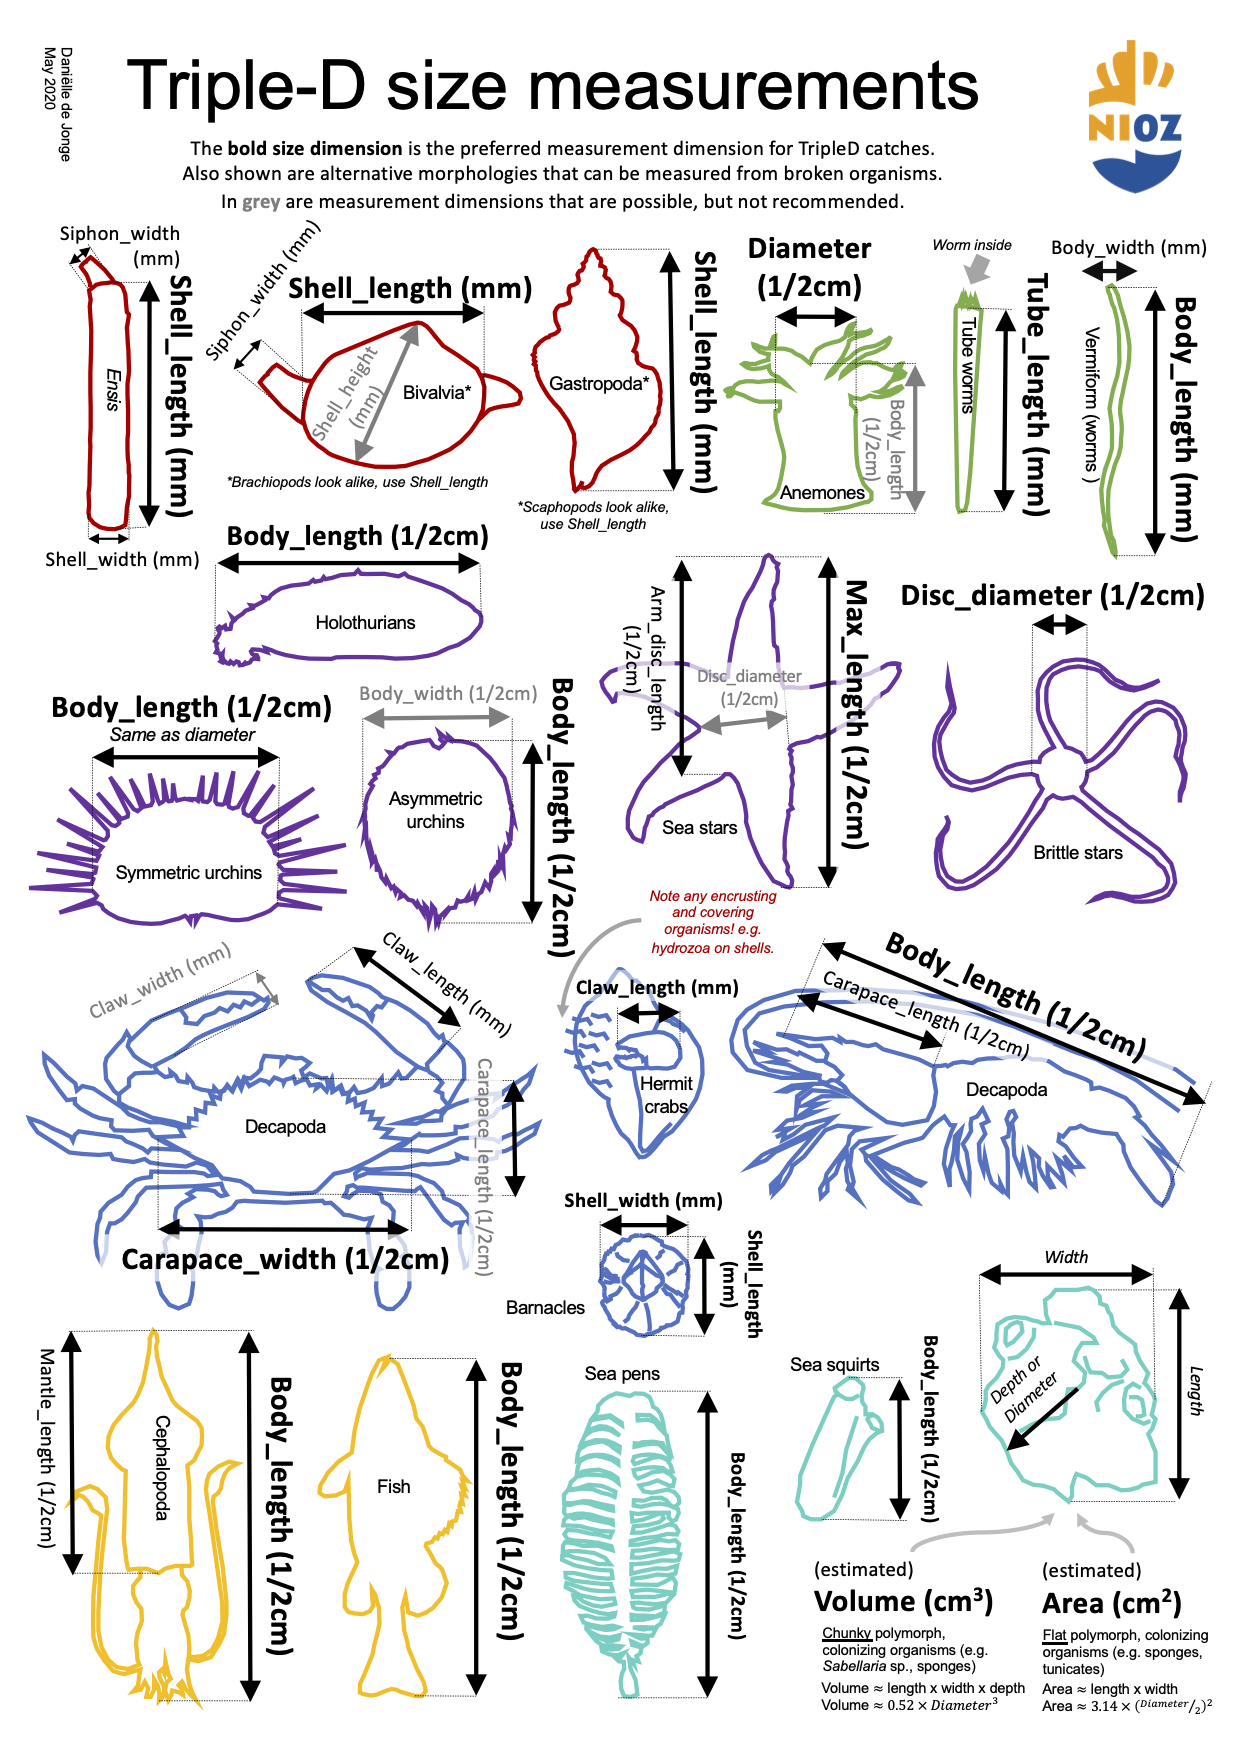
A quick reference and reminder of which size dimensions are measured for different morphological groups. The names in the diagram correspond exactly with the names in the species CSVs and bioconversion CSV that can be requested from the NIOZ Data Archiving System.
size dimensions diagram

tripled's People

Contributors

dswdejonge avatar

Stargazers

harryvederci avatar

Watchers

 avatar

tripled's Issues

Consistency in booleans.

Booleans are now sometimes 1, 0 and NA, or only 1 and NA. Add code to transform all booleans (1/0/NA) to TRUE/FALSE?

Extra station info

Add extra station info from external sources:

  • Environmental data (temperature, nutrients, etc.)
  • Add functional traits to species ('Genus traits handbook'?, Imares?)

If weight is partial, use size measurement for biomass.

If there is a reported weight, but is_Partial is true, then use the estimated length using a regression based on the size measurement. If there also is no regression weight, use the partial weights and report the underestimation.

Write test for bioconversion format.

Test with mistakes:

  • WW_to_AFDW is not a fraction.
  • only WW_to_AFDW or regression are given.
  • WW_to_AFDW has different values for the same species.
  • Taxon name is wrong. -> does it give message and a list of wrong names?

Fix error message.

In file Stations/test_stations_solved.csv, the entries in row(s) 5 are defined 'Focus' in the column 'Cruise_objective', but no excluded taxons are given in the extra column 'Focus'

==

In file Stations/test_stations_solved.csv, the entries in row(s) 5 are defined 'Focus' in the column 'Cruise_objective', but no taxons that were focussed on are given in the extra column 'Focus'

test: error when incomplete, but no excluded column

If a station_objective is incomplete/focus, but there is no information in excluded or focus column, test if you get an error. Is it possible to have both an excluded and focus column? Make into only one column?

Sum of count and biomass, na.rm = T

Sum up anyway, but keep track of if data is complete or incomplete.
i.e. COUNT: 5 + 6 = 11 (complete), but 5 + 6 + NA = 12 (incomplete - NA is at least 1 )
i.e. BIOMASS: 5 + 6 = 11 (complete), but 5 + 6 + NA = 11 (incomplete - not possible to estimate minimum weight to add )

count * frac is not always integer: round

sometimes, the fraction does not result in an integer because the fraction is obscure. Round up/down to the closest integer before using upscaled count for calculations.

Make nice map with abundances.

Issues now:
Map is small.
Map takes long to render.

Additionally:
Nice to have interactive map (click on datapoint to get metadata).

Where/how to store description of how CSVs were created.

This is a manual process. Should be documented how raw data is used to get to the required fields for the TripleD database as specified in the attributes files. However, how and where should this information be stored? It can be used for multiple purposes; either to retrace how data came to be or to use as an example when collecting and cleaning your own data.

Thoughts:

  • A vignette with all headers as specified in the attributes file, and people can freely write how they altered their dataset for use in the database. ++ all information in one location, inclusion in the package. -- difficult to review the changes per csv file, file format (rmarkdown) might not be very time resistent, perhaps a barrier for some to use (hidden in package, use rstudio to edit).
  • A csv or text file with the same name as the stations or species csv with the suffix "_metadata" or something. ++Can be stored together with the CSV in DAS, easy to create and edit. -- Not all info in the same place (if one column in the database appears weird, you can review the assumptions for each CSV in one location).

Add confidence measure?

Perhaps it is possible to add a measure of confidence?

Confidence is less when:

  • fraction is assumed,
  • the reported weight is partial,
  • the data is calculated instead of measured (order of preference in combine data sources)

Recommend Projects

  • React photo React

    A declarative, efficient, and flexible JavaScript library for building user interfaces.

  • Vue.js photo Vue.js

    ๐Ÿ–– Vue.js is a progressive, incrementally-adoptable JavaScript framework for building UI on the web.

  • Typescript photo Typescript

    TypeScript is a superset of JavaScript that compiles to clean JavaScript output.

  • TensorFlow photo TensorFlow

    An Open Source Machine Learning Framework for Everyone

  • Django photo Django

    The Web framework for perfectionists with deadlines.

  • D3 photo D3

    Bring data to life with SVG, Canvas and HTML. ๐Ÿ“Š๐Ÿ“ˆ๐ŸŽ‰

Recommend Topics

  • javascript

    JavaScript (JS) is a lightweight interpreted programming language with first-class functions.

  • web

    Some thing interesting about web. New door for the world.

  • server

    A server is a program made to process requests and deliver data to clients.

  • Machine learning

    Machine learning is a way of modeling and interpreting data that allows a piece of software to respond intelligently.

  • Game

    Some thing interesting about game, make everyone happy.

Recommend Org

  • Facebook photo Facebook

    We are working to build community through open source technology. NB: members must have two-factor auth.

  • Microsoft photo Microsoft

    Open source projects and samples from Microsoft.

  • Google photo Google

    Google โค๏ธ Open Source for everyone.

  • D3 photo D3

    Data-Driven Documents codes.