fish-quant / fq-imjoy Goto Github PK
View Code? Open in Web Editor NEWImJoy plugins to run different smFISH analysis in a user-friendly setting.
Home Page: https://fq-imjoy.readthedocs.io/en/latest/
License: MIT License
ImJoy plugins to run different smFISH analysis in a user-friendly setting.
Home Page: https://fq-imjoy.readthedocs.io/en/latest/
License: MIT License


ImJoy plugins can now be integrated into the documentation, see https://kaibu.org/docs/#/
would be great to have this for FQ as well.
docs-interactive, akin to docs folder in example abovealso, referring to the binder usage might be interesting, since people don't need a local installation.
to upload their data, they would need to provide a zip archive ...
thanks @oeway for all the suggestions.
When trying to launch FISH-QUANT in Imjoy, the error shows us saying that the imjoy couldn't read specific scripts in data files. I have attached the error log here. I have tried in both Windows and Mac on two different computers.
Hi~I'm a fresher and have a problem here. I can only successfully preprocess the example images from fq-segmentation. But when I use the example images from fq-imjoy or my images, it gives me wrong results like this ↓ 。I am using a Windows 10 device.

Adding buttons is now done with add_widget.
Documentation is hard to follow for first time users. Reordering and clarifying certain steps is necessary, e.g. what regular expressions are.
Hello.
I downloaded the 'fq-imjoy-demo' folder from DropBox, and I also installed a local ImJoy on my computer as instructed in the manual. However, even when I placed the location of 'fq-imjoy-demo' in the Root folder, ImJoy is not able to detect it. Thank you in advance!
I attached screenshots of the problem below.


Hi, I have a mac, and my root folder is '/Users/noni/Library/CloudStorage/OneDrive-weizmann.ac.il/1st Rotation/FISHquant/results', somehow it doesn't seem to find it, I feel like I missed something obvious. thanks!
Hello, I feel like I'm missing something obvious. I have downloaded the demo data from Dropbox making sure I have the recommended folder structure of acquisition and analysis. My goal is to test my scan connection using the demo data images. I have saved those folders in C:\Users\Colin\fq-imjoy-demo. However, as directed in the screenshot in the "Typical workflow" explanation, I have ROOT folder = "C:\Users\Colin\fq-imjoy-demo". SUB folder Acquisition = "acquisition" and SUB folder Analysis = "analysis". I completed the channels information and clicked the scanned folder button.
I receive this message.
"Specified data path does not EXIST. No images found. C:\Users\Colin\fq-imjoy-demo/acquisition"
When the paths merged, it defaults a forward slash not backslash, which I am guessing why it cannot find this path on my local machine. I assumed I could load images from my local machine. Am I missing some setting to create a backslash?
The walkthrough example is ROOT folder = "C:\Users\muell\fq-imjoy-tutorial" which is what I was following.
First of all, great tool, although I've been trying for 2 weeks now to get the ImJoy version to work because we currently don't have a Matlab license. Not as intuitive as I thought :D Either way, thanks for all the effort! I'd appreciate your help on my little problem...
I am working on a Mac, Mac OS 12.1
Describe the bug
I have a DAPI image (identifier: C4) for which the "Assign RNAs to cells/nuclei" doesn't work. The mask spit out by your fq-segmentation tool (cells and nuclei) is visible for me in FIJI and looks great to me. 3 fat cells and 2 half ones. When I use that together with spot_detection results to assign the RNA to cells and nuclei, however, it works as expected for other images but not for this one. For this one, it only says "1 cell found" and that is reflected by the csv results. I will attach the image.
In the log below, you will see it analyzing/assigning from four different channels of the same image - I will just upload C1 here.
PS: I know that doing spot detection for C4 (DAPI) doesn't make sense, and much less assigning those spots to the cell/nuclei masks, but honestly, I found that your script gives errors or just stops if I don't provide those files, so I just do.
To Reproduce
I tried the same with checking the "clean segmentation results" checkbox, but it didn't change the results. Only 1 cell detected.
Logs
`[FISH-QUANT][clean_segmentation] received data::
{ "files": [], "file_loaded": "", "path_root": "/Volumes/Extreme SSD/[Secret folders]/", "path_sub_acquisition": "acquisition", "path_sub_analysis": "analysis", "z_first": true, "img_ext": "tif", "channels": [], "ch_name": [], "ch_ident": [], "reg_exp": "(?P<file_ident>.)_(?P.)-(?P.)_\.(?P<img_ext>.)", "current_index": 0, "channel_selected": null, "sigma": [ 1, 0.75 ], "threshold_range": [ 0, 5000, 50 ], "minimum_distance": [ 2, 2 ], "detection_threshold": null, "th_range_min": 0, "th_range_max": 5000, "th_range_nbins": 50, "analyze_clusters": false, "create_plots": true, "show_filtered": true, "show_detection": true, "voxel_size_yx": 64, "voxel_size_z": 500, "psf_size_xy": 200, "psf_size_z": 400, "cluster_alpha": 0.5, "cluster_beta": 2, "foci_radius": 300, "foci_nb_min_spots": 4, "assign_subfolder": "segmentation-results", "assign_subfolder_new":, "assign_ident_spots": "__spots_foci.csv", "assign_ident_cell": "__mask__cells.png", "assign_ident_nuc": "__mask__nuclei.png", "assign_ch_cell": "C1", "assign_ch_nuc": "C4", "assign_ch_spots": "C1", "clean_segmentation_enable": false, "plot_individual_cells_enable": true }
Analyzing spots detection file /Volumes/Extreme SSD/[Secret folders]/analysis/spot_detection/SC9_C1-SKBR3_E7___spots_foci.csv
/Volumes/Extreme SSD/[Secret folders]/acquisition/SC9_C1-SKBR3_E7_.tif
number of cells identified: 1
Analyzing spots detection file /Volumes/Extreme SSD/[Secret folders]/analysis/spot_detection/SC9_C2-SKBR3_E7___spots_foci.csv
/Volumes/Extreme SSD/[Secret folders]/acquisition/SC9_C2-SKBR3_E7_.tif
number of cells identified: 1
Analyzing spots detection file /Volumes/Extreme SSD/[Secret folders]/analysis/spot_detection/SC9_C3-SKBR3_E7___spots_foci.csv
/Volumes/Extreme SSD/[Secret folders]/acquisition/SC9_C3-SKBR3_E7_.tif
number of cells identified: 1
Analyzing spots detection file /Volumes/Extreme SSD/[Secret folders]/analysis/spot_detection/SC9_C4-SKBR3_E7___spots_foci.csv
/Volumes/Extreme SSD/[Secret folders]/acquisition/SC9_C4-SKBR3_E7_.tif
number of cells identified: 1`
Screenshots
Masks from segmentation-results in FIJI:

CSV results for the "1 cell" found:

Sample file: https://drive.google.com/drive/folders/1xPiZGVIaLXm_krVJgpuWMYtUE82LRCH-?usp=sharing
Folder to specify data can also be https and link to a .zip.
these could then be downloaded and extracted.
this should also be compatible when running on binder.
example for an implementation: https://github.com/imjoy-team/imjoy-interactive-segmentation/blob/2f2b6ba1fd3bf92f7b352df1a9aaaf18664f4989/download_example_dataset.py
thanks, @oeway for all the hints.
Currently, spots are only detected with a local max approach and their positions reported.
Might be useful to add an option (button) to also fit all spots with a 3D Gaussian.
Describe the bug
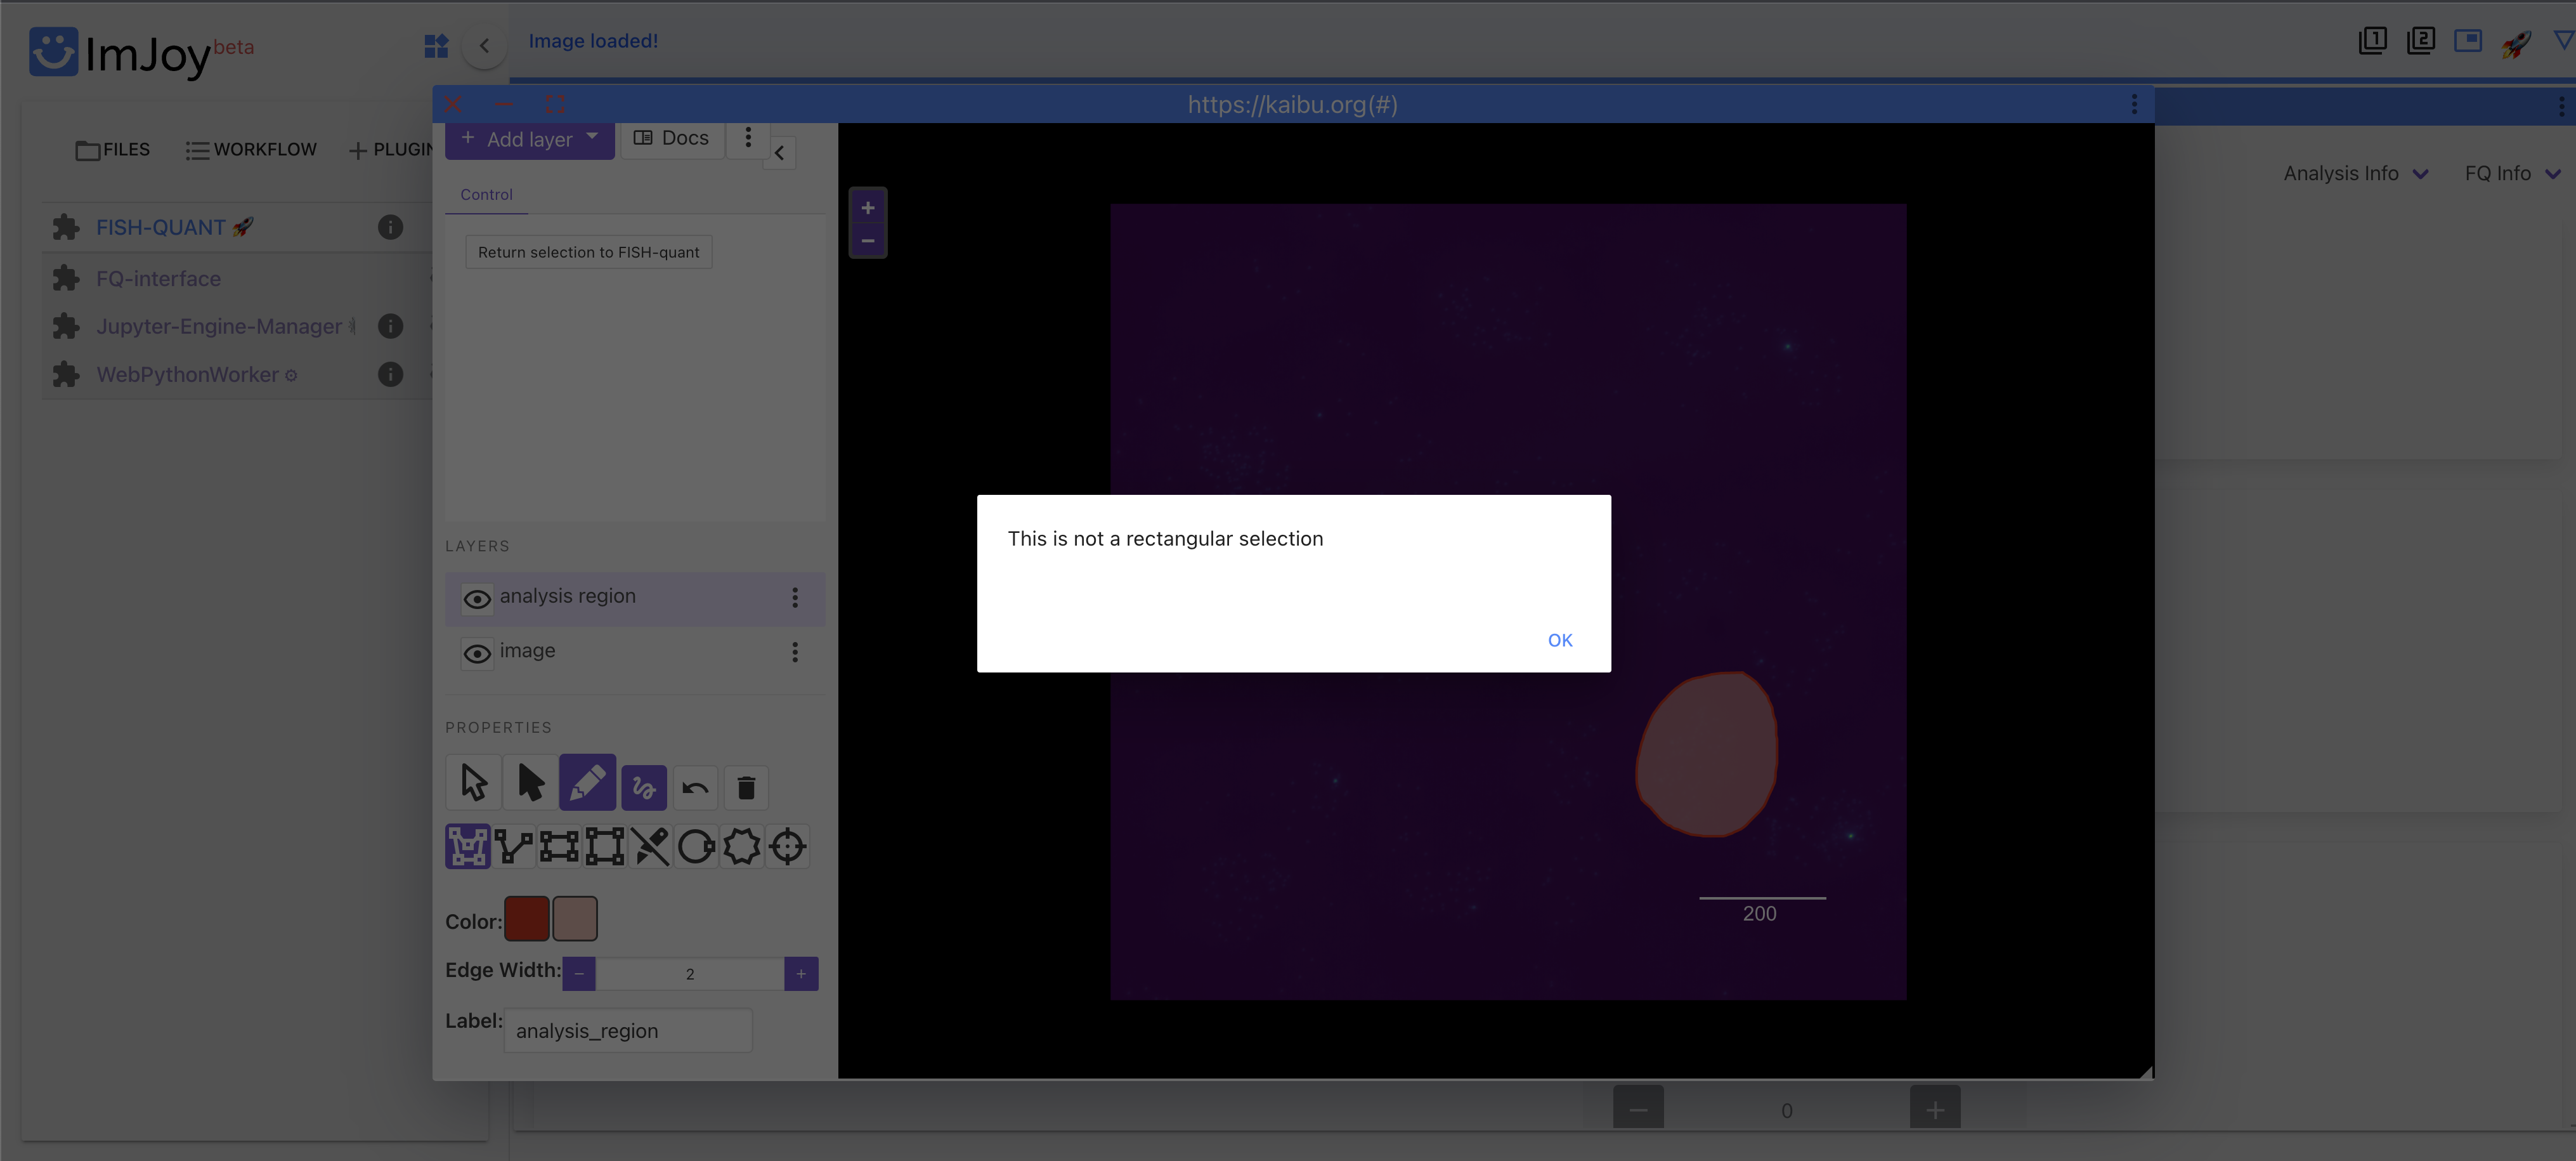
I'm trying to use the "Select smaller region for testing" tool under the "Spot Detection" tab to only analyze one layer of cells surrounding a blood vessel (roughly a circular selection). When I attempt to select this region using the "Circle" tool and then click "Return selection to FISH-QUANT", I get the error message in Kaibu, "Annotation has to be a Polygon." When I then try the "Polygon" tool, I get the error message "This is not a rectangular selection". The only two tools the seem to work are the "Rectangle" and the "Square" tools. Are these really the only supported selection methods in Kaibu?
To Reproduce
Logs
browser console log.docx
plugin log.docx
Screenshots

Versions:
iOS 11.6.2
Chrome Version 99.0.4844.51
FQ plugin: v0.0.16
FQ interface: v0.0.11
big-fish: v0.6.0
Greetings, this is a really cool project! Have been using FQ in Matlab for years and we now have a quirky situation that calls for open source smFISH analysis with a GUI, so thanks!
Describe the bug
Spot detection with FG-Imjoy takes a very long time. I suspect there is something wrong, because file processing has not finished after several hours, even though I have cropped the image down to 115x115x5 and chosen a threshold that detects only < 100 spots.
Shortly after the app hangs, there is a Python error message in the Chrome log:
File "/Users/joshtitlow/Library/Python/3.7/lib/python/site-packages/matplotlib/figure.py", line 428, in show manager = getattr(self.canvas, 'manager') AttributeError: 'FigureCanvasAgg' object has no attribute 'manager'
To Reproduce
Not sure,
imjoy --jupyterLogs
FISH-QUANT_nlnxi1609564245421.txt
Screenshots

Versions:
Additional context
Add any other context about the problem here.
Describe the bug
I can't seem to load any images. After loading ImJoy/Jupyter, and starting FISH-QUANT, I attempted to load my images.
To Reproduce
I have also just tried setting regex to the exact file name test.tif, and it also does not find the image
Logs
Please provide
ENGINE_URL=http://127.0.0.1:9527/
Connected to an existing server: http://127.0.0.1:9527/
Kernel started: b2338322-d0fb-45e7-a3aa-2d27e61192ca
Installing requirements for kernel b2338322-d0fb-45e7-a3aa-2d27e61192ca: ["!python -m pip install big-fish==0.4.0"]
plugin FISH-QUANT (id=FISH-QUANT_9sizi1612999069674) initialized.
Plugin connected.
Setting up plugin.
[FISH-QUANT] plugin initialized.
[FISH-QUANT][scan_folder] received data::
{ "activeTab": 0, "version_interface": "0.0.8", "version_FQ": "0.0.11", "version_bigfish": "0.4.0", "active_tab": "data", "txt_navbar": "No image loaded", "txt_navbar_details": "", "fq_worker": { "ENGINE_URL": "http://127.0.0.1:9527/", "FILE_MANAGER_URL": "http://127.0.0.1:9527/", "config": { "id": "FISH-QUANT_9sizi1612999069674", "name": "FISH-QUANT", "workspace": "fq-main", "type": "native-python", "tag": "stable", "engine_mode": "auto", "engine": "http://127.0.0.1:9527/" }, "rintf": "1qd4r3ot0i1612999267678" }, "fq_worker_url": "http://127.0.0.1:9527/", "files": [], "file_loaded": "", "data_path": "X:\Dropbox\GOESSLING LAB\HFD project\Imaging\Ces1c_pilot\acquisition", "output_path": "acquisition>>analysis", "z_first": true, "img_ext": "tif", "channels": [ { "name": "red", "identifier": "C1" } ], "analysis_region": [], "ch_name": [], "ch_ident": [], "reg_exp": "(?P<file_ident>.*)(?P.)_(?P.)\.(?P<img_ext>.*)$", "voxel_size_yx": 100, "voxel_size_z": 300, "psf_size_xy": 200, "psf_size_z": 400, "cluster_alpha": 0.5, "cluster_beta": 2, "foci_radius": 300, "foci_nb_min_spots": 4, "current_index": 0, "channel_selected": null, "sigma": [ 1, 0.75, 0.75 ], "threshold_range": [ 0, 5000, 50 ], "minimum_distance": [ 2, 2 ], "detection_threshold": null, "img_filt_min": 0, "img_filt_max": 0, "th_range_min": 0, "th_range_max": 5000, "th_range_nbins": 50, "analyze_clusters": false, "create_plots": true, "show_filtered": true, "show_detection": true, "getting_zipped_data": false, "running_load": false, "running_filter": false, "running_detect_test": false, "running_detect_apply": false, "running_decompose_clusters": false, "running_detect_foci": false, "running_detect_image": false, "running_detect_batch": false, "downloading_results_zipped": false, "status_image_loaded": false, "status_image_filtered": false, "status_channel_selected": false, "status_thresholds_tested": false, "status_detection_applied": false, "status_detect_apply": false, "status_decompose_clusters": false }
[FISH-QUANT][scan_folder] channel dictionary: {'C1': 'red'}
Checking file: X:\Dropbox\GOESSLING LAB\HFD project\Imaging\Ces1c_pilot\acquisition\C1-CD1-6M-8.14.19-Ephx2-R-Ces1c-FR-DAPI-B-zstack-001-stitched_0_red.tif
Checking file: X:\Dropbox\GOESSLING LAB\HFD project\Imaging\Ces1c_pilot\acquisition\C2-CD1-6M-8.14.19-Ephx2-R-Ces1c-FR-DAPI-B-zstack-001-stitched_0_FR.tif
Checking file: X:\Dropbox\GOESSLING LAB\HFD project\Imaging\Ces1c_pilot\acquisition\C3-CD1-6M-8.14.19-Ephx2-R-Ces1c-FR-DAPI-B-zstack-001-stitched_0_blue.tif
Checking file: X:\Dropbox\GOESSLING LAB\HFD project\Imaging\Ces1c_pilot\acquisition\CD1-6M-8.14.19-Ephx2-R-Ces1c-FR-DAPI-B-zstack-001-stitched.tif
... no match
Checking file: X:\Dropbox\GOESSLING LAB\HFD project\Imaging\Ces1c_pilot\acquisition\test.tif
... no match
[FISH-QUANT][scan_folder] scan results:
[]
[FISH-QUANT][scan_folder] received data::
{ "activeTab": 0, "version_interface": "0.0.8", "version_FQ": "0.0.11", "version_bigfish": "0.4.0", "active_tab": "data", "txt_navbar": "No image loaded", "txt_navbar_details": "", "fq_worker": { "ENGINE_URL": "http://127.0.0.1:9527/", "FILE_MANAGER_URL": "http://127.0.0.1:9527/", "config": { "id": "FISH-QUANT_9sizi1612999069674", "name": "FISH-QUANT", "workspace": "fq-main", "type": "native-python", "tag": "stable", "engine_mode": "auto", "engine": "http://127.0.0.1:9527/" }, "rintf": "2f3pd3h3gb1612999335804" }, "fq_worker_url": "http://127.0.0.1:9527/", "files": [], "file_loaded": "", "data_path": "X:\Dropbox\GOESSLING LAB\HFD project\Imaging\Ces1c_pilot\acquisition", "output_path": "acquisition>>analysis", "z_first": true, "img_ext": "tif", "channels": [ { "name": "red", "identifier": "C1" } ], "analysis_region": [], "ch_name": [], "ch_ident": [], "reg_exp": "(?P<file_ident>.*)(?P.)_(?P.)\.(?P<img_ext>.*)$", "voxel_size_yx": 100, "voxel_size_z": 300, "psf_size_xy": 200, "psf_size_z": 400, "cluster_alpha": 0.5, "cluster_beta": 2, "foci_radius": 300, "foci_nb_min_spots": 4, "current_index": 0, "channel_selected": null, "sigma": [ 1, 0.75, 0.75 ], "threshold_range": [ 0, 5000, 50 ], "minimum_distance": [ 2, 2 ], "detection_threshold": null, "img_filt_min": 0, "img_filt_max": 0, "th_range_min": 0, "th_range_max": 5000, "th_range_nbins": 50, "analyze_clusters": false, "create_plots": true, "show_filtered": true, "show_detection": true, "getting_zipped_data": false, "running_load": false, "running_filter": false, "running_detect_test": false, "running_detect_apply": false, "running_decompose_clusters": false, "running_detect_foci": false, "running_detect_image": false, "running_detect_batch": false, "downloading_results_zipped": false, "status_image_loaded": false, "status_image_filtered": false, "status_channel_selected": false, "status_thresholds_tested": false, "status_detection_applied": false, "status_detect_apply": false, "status_decompose_clusters": false }
[FISH-QUANT][scan_folder] channel dictionary: {'C1': 'red'}
Checking file: X:\Dropbox\GOESSLING LAB\HFD project\Imaging\Ces1c_pilot\acquisition\C1-CD1-6M-8.14.19-Ephx2-R-Ces1c-FR-DAPI-B-zstack-001-stitched_0_red.tif
Checking file: X:\Dropbox\GOESSLING LAB\HFD project\Imaging\Ces1c_pilot\acquisition\C2-CD1-6M-8.14.19-Ephx2-R-Ces1c-FR-DAPI-B-zstack-001-stitched_0_FR.tif
Checking file: X:\Dropbox\GOESSLING LAB\HFD project\Imaging\Ces1c_pilot\acquisition\C3-CD1-6M-8.14.19-Ephx2-R-Ces1c-FR-DAPI-B-zstack-001-stitched_0_blue.tif
Checking file: X:\Dropbox\GOESSLING LAB\HFD project\Imaging\Ces1c_pilot\acquisition\CD1-6M-8.14.19-Ephx2-R-Ces1c-FR-DAPI-B-zstack-001-stitched.tif
... no match
Checking file: X:\Dropbox\GOESSLING LAB\HFD project\Imaging\Ces1c_pilot\acquisition\test.tif
... no match
[FISH-QUANT][scan_folder] scan results:
[]
[FISH-QUANT][scan_folder] received data::
{ "activeTab": 0, "version_interface": "0.0.8", "version_FQ": "0.0.11", "version_bigfish": "0.4.0", "active_tab": "data", "txt_navbar": "No image loaded", "txt_navbar_details": "", "fq_worker": { "ENGINE_URL": "http://127.0.0.1:9527/", "FILE_MANAGER_URL": "http://127.0.0.1:9527/", "config": { "id": "FISH-QUANT_9sizi1612999069674", "name": "FISH-QUANT", "workspace": "fq-main", "type": "native-python", "tag": "stable", "engine_mode": "auto", "engine": "http://127.0.0.1:9527/" }, "rintf": "xunzzkb2s51612999791535" }, "fq_worker_url": "http://127.0.0.1:9527/", "files": [], "file_loaded": "", "data_path": "X:\Dropbox\GOESSLING LAB\HFD project\Imaging\Ces1c_pilot\acquisition", "output_path": "acquisition>>analysis", "z_first": true, "img_ext": "tif", "channels": [ { "name": "red", "identifier": "C1" } ], "analysis_region": [], "ch_name": [], "ch_ident": [], "reg_exp": "(?P<file_ident>.*)(?P.)_(?P.)\.(?P<img_ext>.*)$", "voxel_size_yx": 100, "voxel_size_z": 300, "psf_size_xy": 200, "psf_size_z": 400, "cluster_alpha": 0.5, "cluster_beta": 2, "foci_radius": 300, "foci_nb_min_spots": 4, "current_index": 0, "channel_selected": null, "sigma": [ 1, 0.75, 0.75 ], "threshold_range": [ 0, 5000, 50 ], "minimum_distance": [ 2, 2 ], "detection_threshold": null, "img_filt_min": 0, "img_filt_max": 0, "th_range_min": 0, "th_range_max": 5000, "th_range_nbins": 50, "analyze_clusters": false, "create_plots": true, "show_filtered": true, "show_detection": true, "getting_zipped_data": false, "running_load": false, "running_filter": false, "running_detect_test": false, "running_detect_apply": false, "running_decompose_clusters": false, "running_detect_foci": false, "running_detect_image": false, "running_detect_batch": false, "downloading_results_zipped": false, "status_image_loaded": false, "status_image_filtered": false, "status_channel_selected": false, "status_thresholds_tested": false, "status_detection_applied": false, "status_detect_apply": false, "status_decompose_clusters": false }
[FISH-QUANT][scan_folder] channel dictionary: {'C1': 'red'}
Checking file: X:\Dropbox\GOESSLING LAB\HFD project\Imaging\Ces1c_pilot\acquisition\C1-CD1-6M-8.14.19-Ephx2-R-Ces1c-FR-DAPI-B-zstack-001-stitched_0_red.tif
Checking file: X:\Dropbox\GOESSLING LAB\HFD project\Imaging\Ces1c_pilot\acquisition\C2-CD1-6M-8.14.19-Ephx2-R-Ces1c-FR-DAPI-B-zstack-001-stitched_0_FR.tif
Checking file: X:\Dropbox\GOESSLING LAB\HFD project\Imaging\Ces1c_pilot\acquisition\C3-CD1-6M-8.14.19-Ephx2-R-Ces1c-FR-DAPI-B-zstack-001-stitched_0_blue.tif
Checking file: X:\Dropbox\GOESSLING LAB\HFD project\Imaging\Ces1c_pilot\acquisition\CD1-6M-8.14.19-Ephx2-R-Ces1c-FR-DAPI-B-zstack-001-stitched.tif
... no match
Checking file: X:\Dropbox\GOESSLING LAB\HFD project\Imaging\Ces1c_pilot\acquisition\test.tif
... no match
[FISH-QUANT][scan_folder] scan results:
[]
Loading plugin FISH-QUANT_9sizi1612999069674 (config=[object Object])
ENGINE_URL=http://127.0.0.1:9527/
Connected to an existing server: http://127.0.0.1:9527/
Kernel started: b2338322-d0fb-45e7-a3aa-2d27e61192ca
Installing requirements for kernel b2338322-d0fb-45e7-a3aa-2d27e61192ca: ["!python -m pip install big-fish==0.4.0"]
plugin FISH-QUANT (id=FISH-QUANT_9sizi1612999069674) initialized.
Plugin connected.
Setting up plugin.
[FISH-QUANT] plugin initialized.
[FISH-QUANT][scan_folder] received data::
{ "activeTab": 0, "version_interface": "0.0.8", "version_FQ": "0.0.11", "version_bigfish": "0.4.0", "active_tab": "data", "txt_navbar": "No image loaded", "txt_navbar_details": "", "fq_worker": { "ENGINE_URL": "http://127.0.0.1:9527/", "FILE_MANAGER_URL": "http://127.0.0.1:9527/", "config": { "id": "FISH-QUANT_9sizi1612999069674", "name": "FISH-QUANT", "workspace": "fq-main", "type": "native-python", "tag": "stable", "engine_mode": "auto", "engine": "http://127.0.0.1:9527/" }, "rintf": "1qd4r3ot0i1612999267678" }, "fq_worker_url": "http://127.0.0.1:9527/", "files": [], "file_loaded": "", "data_path": "X:\Dropbox\GOESSLING LAB\HFD project\Imaging\Ces1c_pilot\acquisition", "output_path": "acquisition>>analysis", "z_first": true, "img_ext": "tif", "channels": [ { "name": "red", "identifier": "C1" } ], "analysis_region": [], "ch_name": [], "ch_ident": [], "reg_exp": "(?P<file_ident>.*)(?P.)_(?P.)\.(?P<img_ext>.*)$", "voxel_size_yx": 100, "voxel_size_z": 300, "psf_size_xy": 200, "psf_size_z": 400, "cluster_alpha": 0.5, "cluster_beta": 2, "foci_radius": 300, "foci_nb_min_spots": 4, "current_index": 0, "channel_selected": null, "sigma": [ 1, 0.75, 0.75 ], "threshold_range": [ 0, 5000, 50 ], "minimum_distance": [ 2, 2 ], "detection_threshold": null, "img_filt_min": 0, "img_filt_max": 0, "th_range_min": 0, "th_range_max": 5000, "th_range_nbins": 50, "analyze_clusters": false, "create_plots": true, "show_filtered": true, "show_detection": true, "getting_zipped_data": false, "running_load": false, "running_filter": false, "running_detect_test": false, "running_detect_apply": false, "running_decompose_clusters": false, "running_detect_foci": false, "running_detect_image": false, "running_detect_batch": false, "downloading_results_zipped": false, "status_image_loaded": false, "status_image_filtered": false, "status_channel_selected": false, "status_thresholds_tested": false, "status_detection_applied": false, "status_detect_apply": false, "status_decompose_clusters": false }
[FISH-QUANT][scan_folder] channel dictionary: {'C1': 'red'}
Checking file: X:\Dropbox\GOESSLING LAB\HFD project\Imaging\Ces1c_pilot\acquisition\C1-CD1-6M-8.14.19-Ephx2-R-Ces1c-FR-DAPI-B-zstack-001-stitched_0_red.tif
Checking file: X:\Dropbox\GOESSLING LAB\HFD project\Imaging\Ces1c_pilot\acquisition\C2-CD1-6M-8.14.19-Ephx2-R-Ces1c-FR-DAPI-B-zstack-001-stitched_0_FR.tif
Checking file: X:\Dropbox\GOESSLING LAB\HFD project\Imaging\Ces1c_pilot\acquisition\C3-CD1-6M-8.14.19-Ephx2-R-Ces1c-FR-DAPI-B-zstack-001-stitched_0_blue.tif
Checking file: X:\Dropbox\GOESSLING LAB\HFD project\Imaging\Ces1c_pilot\acquisition\CD1-6M-8.14.19-Ephx2-R-Ces1c-FR-DAPI-B-zstack-001-stitched.tif
... no match
Checking file: X:\Dropbox\GOESSLING LAB\HFD project\Imaging\Ces1c_pilot\acquisition\test.tif
... no match
[FISH-QUANT][scan_folder] scan results:
[]
[FISH-QUANT][scan_folder] received data::
{ "activeTab": 0, "version_interface": "0.0.8", "version_FQ": "0.0.11", "version_bigfish": "0.4.0", "active_tab": "data", "txt_navbar": "No image loaded", "txt_navbar_details": "", "fq_worker": { "ENGINE_URL": "http://127.0.0.1:9527/", "FILE_MANAGER_URL": "http://127.0.0.1:9527/", "config": { "id": "FISH-QUANT_9sizi1612999069674", "name": "FISH-QUANT", "workspace": "fq-main", "type": "native-python", "tag": "stable", "engine_mode": "auto", "engine": "http://127.0.0.1:9527/" }, "rintf": "2f3pd3h3gb1612999335804" }, "fq_worker_url": "http://127.0.0.1:9527/", "files": [], "file_loaded": "", "data_path": "X:\Dropbox\GOESSLING LAB\HFD project\Imaging\Ces1c_pilot\acquisition", "output_path": "acquisition>>analysis", "z_first": true, "img_ext": "tif", "channels": [ { "name": "red", "identifier": "C1" } ], "analysis_region": [], "ch_name": [], "ch_ident": [], "reg_exp": "(?P<file_ident>.*)(?P.)_(?P.)\.(?P<img_ext>.*)$", "voxel_size_yx": 100, "voxel_size_z": 300, "psf_size_xy": 200, "psf_size_z": 400, "cluster_alpha": 0.5, "cluster_beta": 2, "foci_radius": 300, "foci_nb_min_spots": 4, "current_index": 0, "channel_selected": null, "sigma": [ 1, 0.75, 0.75 ], "threshold_range": [ 0, 5000, 50 ], "minimum_distance": [ 2, 2 ], "detection_threshold": null, "img_filt_min": 0, "img_filt_max": 0, "th_range_min": 0, "th_range_max": 5000, "th_range_nbins": 50, "analyze_clusters": false, "create_plots": true, "show_filtered": true, "show_detection": true, "getting_zipped_data": false, "running_load": false, "running_filter": false, "running_detect_test": false, "running_detect_apply": false, "running_decompose_clusters": false, "running_detect_foci": false, "running_detect_image": false, "running_detect_batch": false, "downloading_results_zipped": false, "status_image_loaded": false, "status_image_filtered": false, "status_channel_selected": false, "status_thresholds_tested": false, "status_detection_applied": false, "status_detect_apply": false, "status_decompose_clusters": false }
[FISH-QUANT][scan_folder] channel dictionary: {'C1': 'red'}
Checking file: X:\Dropbox\GOESSLING LAB\HFD project\Imaging\Ces1c_pilot\acquisition\C1-CD1-6M-8.14.19-Ephx2-R-Ces1c-FR-DAPI-B-zstack-001-stitched_0_red.tif
Checking file: X:\Dropbox\GOESSLING LAB\HFD project\Imaging\Ces1c_pilot\acquisition\C2-CD1-6M-8.14.19-Ephx2-R-Ces1c-FR-DAPI-B-zstack-001-stitched_0_FR.tif
Checking file: X:\Dropbox\GOESSLING LAB\HFD project\Imaging\Ces1c_pilot\acquisition\C3-CD1-6M-8.14.19-Ephx2-R-Ces1c-FR-DAPI-B-zstack-001-stitched_0_blue.tif
Checking file: X:\Dropbox\GOESSLING LAB\HFD project\Imaging\Ces1c_pilot\acquisition\CD1-6M-8.14.19-Ephx2-R-Ces1c-FR-DAPI-B-zstack-001-stitched.tif
... no match
Checking file: X:\Dropbox\GOESSLING LAB\HFD project\Imaging\Ces1c_pilot\acquisition\test.tif
... no match
[FISH-QUANT][scan_folder] scan results:
[]
[FISH-QUANT][scan_folder] received data::
{ "activeTab": 0, "version_interface": "0.0.8", "version_FQ": "0.0.11", "version_bigfish": "0.4.0", "active_tab": "data", "txt_navbar": "No image loaded", "txt_navbar_details": "", "fq_worker": { "ENGINE_URL": "http://127.0.0.1:9527/", "FILE_MANAGER_URL": "http://127.0.0.1:9527/", "config": { "id": "FISH-QUANT_9sizi1612999069674", "name": "FISH-QUANT", "workspace": "fq-main", "type": "native-python", "tag": "stable", "engine_mode": "auto", "engine": "http://127.0.0.1:9527/" }, "rintf": "xunzzkb2s51612999791535" }, "fq_worker_url": "http://127.0.0.1:9527/", "files": [], "file_loaded": "", "data_path": "X:\Dropbox\GOESSLING LAB\HFD project\Imaging\Ces1c_pilot\acquisition", "output_path": "acquisition>>analysis", "z_first": true, "img_ext": "tif", "channels": [ { "name": "red", "identifier": "C1" } ], "analysis_region": [], "ch_name": [], "ch_ident": [], "reg_exp": "(?P<file_ident>.*)(?P.)_(?P.)\.(?P<img_ext>.*)$", "voxel_size_yx": 100, "voxel_size_z": 300, "psf_size_xy": 200, "psf_size_z": 400, "cluster_alpha": 0.5, "cluster_beta": 2, "foci_radius": 300, "foci_nb_min_spots": 4, "current_index": 0, "channel_selected": null, "sigma": [ 1, 0.75, 0.75 ], "threshold_range": [ 0, 5000, 50 ], "minimum_distance": [ 2, 2 ], "detection_threshold": null, "img_filt_min": 0, "img_filt_max": 0, "th_range_min": 0, "th_range_max": 5000, "th_range_nbins": 50, "analyze_clusters": false, "create_plots": true, "show_filtered": true, "show_detection": true, "getting_zipped_data": false, "running_load": false, "running_filter": false, "running_detect_test": false, "running_detect_apply": false, "running_decompose_clusters": false, "running_detect_foci": false, "running_detect_image": false, "running_detect_batch": false, "downloading_results_zipped": false, "status_image_loaded": false, "status_image_filtered": false, "status_channel_selected": false, "status_thresholds_tested": false, "status_detection_applied": false, "status_detect_apply": false, "status_decompose_clusters": false }
[FISH-QUANT][scan_folder] channel dictionary: {'C1': 'red'}
Checking file: X:\Dropbox\GOESSLING LAB\HFD project\Imaging\Ces1c_pilot\acquisition\C1-CD1-6M-8.14.19-Ephx2-R-Ces1c-FR-DAPI-B-zstack-001-stitched_0_red.tif
Checking file: X:\Dropbox\GOESSLING LAB\HFD project\Imaging\Ces1c_pilot\acquisition\C2-CD1-6M-8.14.19-Ephx2-R-Ces1c-FR-DAPI-B-zstack-001-stitched_0_FR.tif
Checking file: X:\Dropbox\GOESSLING LAB\HFD project\Imaging\Ces1c_pilot\acquisition\C3-CD1-6M-8.14.19-Ephx2-R-Ces1c-FR-DAPI-B-zstack-001-stitched_0_blue.tif
Checking file: X:\Dropbox\GOESSLING LAB\HFD project\Imaging\Ces1c_pilot\acquisition\CD1-6M-8.14.19-Ephx2-R-Ces1c-FR-DAPI-B-zstack-001-stitched.tif
... no match
Checking file: X:\Dropbox\GOESSLING LAB\HFD project\Imaging\Ces1c_pilot\acquisition\test.tif
... no match
[FISH-QUANT][scan_folder] scan results:
[]
Screenshots
If applicable, add screenshots to help explain your problem.

Versions:
Installation of the Jupyter extra can fail if a user is in ZSH, which may be confusing for someone who's not encountered such an issue before. It may be worth adding a note or additional example in the plugin engine installation doc, under "Install code Jupyter optimized for ImJoy"
when downloading the zipped results, the folder structure is not conserved
When saving the spot detection results, the settings file contains the regular expression used to identify files.
(at least) in Windows a backslash is doubled in this expression.
"(?P<channel>.*)-(?P<file_ident>.*)-(?P<fov>.*)\\.(?P<img_ext>.*)"
Describe the bug
When I click the "Assign RNAs to cells" button under "Post-processing," the program continuously loads and never produces any CSV files in the "results_per_fov" file within "spot_detection." The "Assign RNAs to cells" button works when I use the example data but not with our own images. I processed our images using "PreProcess" plugin for z-projections and "SegmentObjects" plugin for cell and nuclei masks. FISH-QUANT successfully generates spot detection files "__spots.csv" and "__spots_foci.csv" but it keeps freezing when I try to pair these spots with the masks.
Spot detection performed on a cy3 image. Nuclei mask generated from DAPI image.
To Reproduce
loaded two images (each with cy3 and dapi channel)
**note: images have same names as example data images but they are not the example data;
Spot Detection: selected cy3 for "select channel"
Clicked "Filter Image" using default settings (sigma-xy = 0.75, sigma-z = 1)
Spot detection threshold = 4000. "Apply detection threshold"
Checked "Apply RNA cluster decomposition & detection"
Clicked "Decompose dense regions" using default settings (Spot radius XY = 200, Z = 400)
Clicked "Define Clusters" using default settings (Min nb spots = 4, Max distance (nm) = 300)
Clicked "Launch batch processing" --> image 1 gives 25 spot in CSV; image 2 gives 151 spots in CSV;
**note: I run into the same problem when I only click "Analyze current image"
Post-Processing: File identifiers = "__spots_foci.csv" "__mask__cells.png" "__mask__nuclei.png" Channel identifiers = "cy3" "dapi" "dapi" respectively.
**note: I'm using copies of the same mask for the cells and the nuclei. Both masks are identical and based on the same DAPI image; they just have different identifier strings This is because we did not have a good channel for creating clean cell masks. We are only interested in counting #spots per nuclei, but the program seems to not run if the Cells file identifier is left blank. Therefore I filled it with just a replica of the nuclei mask renamed. I tried this approach with the example data and the analysis ran normally.
Clicked "Assign RNAs to cells"; did not check any boxes here; Loading button starts to circle and continues indefinitely.
Logs
browser console log.docx
plugin log.docx
Screenshots
screenshot of Browser console error - this seems to be the main problem.

Versions:
iOS 11.6.2
Chrome Version 99.0.4844.51
FQ plugin: v0.0.16
FQ interface: v0.0.11
big-fish: v0.6.0
While the cluster analysis is part of the interface, no documentation is provided.
Documentation should contain also information about how to set the parameters.
currently, only 3D images can be processed. processing of 2d images would be desirable.
Hi, I am new to using FISH-Quant but it seems very promising. One issue I am having with my data is that the images are already highly processed to reduce background as they are confocal airyscan images.
I noticed that filtered images highly reduced the differences in values between background and spot. A spot would go from 255 to 40 despite the background being only 4 in that 255 scale. More importatly, any filtering results in spots becoming rings (see below) because the centre is dimmed more. This also means that in big rings, multiple spots will be detected.
Is there a way I can just skip filtering the image and go to thresholding?
Thank you

Raw image

Filtered (sigma = 2 was the best I could get without FISH-Quant getting stuck)
Hi,
First of all thanks a lot for sharing your work, I've been using the MATLAB version of your software for some years, and now I'm trying to move to your new version in ImJoy.
Since sometimes is quite complicated to conclude about gene expression levels (considering that the number of transcripts is also dependent on cell size), I've been using the #transcripts/cell area as a value to evaluate gene expression. I realized that you removed the cell area calculation from the final output file (that could be found in the MATLAB output before), so I would like to know if you have any plugin that can help to assign a number of area pixels to each segmented cell.
Thanks again!
Describe the bug
when showing an image in Kaibu (raw or filtered), it will be shown flipped along y.
Screenshots

Hello, I've always managed to load the files without any problem but since yesterday FISH-quant is not scanning the folder anymore. I tried both on Chrome and Safari.
The same happens with the demo data provided by you.
Any suggestion?
Hello!
Since recently I have been having a problem when trying to load the images from the scanned folder. The plug-in is able to detect the images but not to load them, which then does not allow to continue with spot detection. I am using Chrome as suggested and the plug-in is fully updated, I also tried with Edge but I encounter the same issue. Maybe it is relevant to mention that no error message is appearing, it just says "Loading images. Please wait.." on top, but then nothing happens. I am using a Windows 10 device.
Here is also a console log:
imjoy.io-1651829760467.log
Describe the bug
I have a DAPI Image (Channel 3, identifier C3) and a cell Image (Channel 1 or 2, identifier C1 or C2). The sequemtnartion is working well, all 18 cells got identified. But the spot detection table contains only 3 cells.
I do not get any error messages while calculating. In other images it´s working well, but sometimes i have this weird spot detection output.
To Reproduce
I used the identifiers C2 and C3 (DAPI), C1 is analysed separately.
clean segmetnation results or remove cells touching the border did not change anything
select channel: C2
Threshold 200
decompose dense regions: xy=200, z=400
define clusters: min=4, max=300
Logs
Loading plugin FISH-QUANT_mzgca1671722181507 (config=[object Object])
ENGINE_URL=http://XXX.0.0.1:XXX
Connected to an existing server: http://XXX.0.0.1:XXX/
Kernel started: be40d1e0-3556-4e98-9898-1f3347da2a20
Installing requirements for kernel be40d1e0-3556-4e98-9898-1f3347da2a20: ["!python -m pip install big-fish==0.6.2"]
plugin FISH-QUANT (id=FISH-QUANT_mzgca1671722181507) initialized.
Plugin connected.
Setting up plugin.
[FISH-QUANT] plugin initialized.
[FISH-QUANT][scan_folder] received data::
{ "files": [], "file_loaded": "", "path_root": "/Users/kg/Downloads/cell recognition issue", "path_sub_acquisition": "acquisition", "path_sub_analysis": "analysis", "z_first": true, "img_ext": "tif", "channels": [ { "name": "C2", "identifier": "C2" }, { "name": "C3", "identifier": "C3" } ], "ch_name": [], "ch_ident": [], "reg_exp": "(?P.)-(?P<file_ident>.)(?P.*).(?P<img_ext>.*)", "current_index": 0, "channel_selected": null, "sigma": [ 1, 0.75 ], "threshold_range": [ 0, 5000, 50 ], "minimum_distance": [ 2, 2 ], "detection_threshold": null, "th_range_min": 0, "th_range_max": 5000, "th_range_nbins": 50, "analyze_clusters": false, "create_plots": true, "show_filtered": true, "show_detection": true, "voxel_size_yx": 100, "voxel_size_z": 300, "psf_size_xy": 200, "psf_size_z": 400, "cluster_alpha": 0.5, "cluster_beta": 2, "foci_radius": 300, "foci_nb_min_spots": 4, "assign_subfolder": "segmentation-results", "assign_subfolder_new": "segmentation-results-matched", "assign_ident_spots": "__spots.csv", "assign_ident_cell": "__mask__cells.png", "assign_ident_nuc": "__mask__nuclei.png", "assign_ch_cell": "cy3", "assign_ch_nuc": "dapi", "assign_ch_spots": "cy3", "remove_cropped_cell": false, "clean_segmentation_enable": false, "plot_individual_cells_enable": false }
[FISH-QUANT][scan_folder] channel dictionary: {'C2': 'C2', 'C3': 'C3'}
Checking file: /Users/kgDownloads/cell recognition issue/acquisition/C1-slide2_SKBR3_well7_.tif
... match against regular expression {'channel': 'C1', 'file_ident': 'slide2_SKBR3', 'fov': 'well7', 'img_ext': 'tif'}
Checking file: /Users/kg/Downloads/cell recognition issue/acquisition/C3-slide2_MCF7_well4_.tif
... match against regular expression {'channel': 'C3', 'file_ident': 'slide2_MCF7', 'fov': 'well4', 'img_ext': 'tif'}
Checking file: /Users/kg/Downloads/cell recognition issue/acquisition/C1-slide2_MCF7_well4_.tif
... match against regular expression {'channel': 'C1', 'file_ident': 'slide2_MCF7', 'fov': 'well4', 'img_ext': 'tif'}
Checking file: /Users/kg/Downloads/cell recognition issue/acquisition/C2-slide2_SKBR3_well7_.tif
... match against regular expression {'channel': 'C2', 'file_ident': 'slide2_SKBR3', 'fov': 'well7', 'img_ext': 'tif'}
Checking file: /Users/kg/Downloads/cell recognition issue/acquisition/C2-slide2_MCF7_well4_.tif
... match against regular expression {'channel': 'C2', 'file_ident': 'slide2_MCF7', 'fov': 'well4', 'img_ext': 'tif'}
Checking file: /Users/kg/Downloads/cell recognition issue/acquisition/C3-slide2_SKBR3_well7_.tif
... match against regular expression {'channel': 'C3', 'file_ident': 'slide2_SKBR3', 'fov': 'well7', 'img_ext': 'tif'}
[FISH-QUANT][scan_folder] scan results: [{'file_ident': 'slide2_SKBR3', 'fov': 'well7', 'img_ext': 'tif', 'C2': 'C2-slide2_SKBR3_well7_.tif', 'C3': 'C3-slide2_SKBR3_well7_.tif'}, {'file_ident': 'slide2_MCF7', 'fov': 'well4', 'img_ext': 'tif', 'C2': 'C2-slide2_MCF7_well4_.tif', 'C3': 'C3-slide2_MCF7_well4_.tif'}]
Found 2 images matching the search criteria.
[FISH-QUANT][load_image] received data::
{ "files": [ { "file_ident": "slide2_SKBR3", "fov": "well7", "img_ext": "tif", "C2": "C2-slide2_SKBR3_well7_.tif", "C3": "C3-slide2_SKBR3_well7_.tif" }, { "file_ident": "slide2_MCF7", "fov": "well4", "img_ext": "tif", "C2": "C2-slide2_MCF7_well4_.tif", "C3": "C3-slide2_MCF7_well4_.tif" } ], "file_loaded": "", "path_root": "/Users/kg/Downloads/cell recognition issue", "path_sub_acquisition": "acquisition", "path_sub_analysis": "analysis", "z_first": true, "img_ext": "tif", "channels": [ { "name": "C2", "identifier": "C2" }, { "name": "C3", "identifier": "C3" } ], "ch_name": [], "ch_ident": [], "reg_exp": "(?P.)-(?P<file_ident>.)(?P.*).(?P<img_ext>.*)", "current_index": 0, "channel_selected": null, "sigma": [ 1, 0.75 ], "threshold_range": [ 0, 5000, 50 ], "minimum_distance": [ 2, 2 ], "detection_threshold": null, "th_range_min": 0, "th_range_max": 5000, "th_range_nbins": 50, "analyze_clusters": false, "create_plots": true, "show_filtered": true, "show_detection": true, "voxel_size_yx": 100, "voxel_size_z": 300, "psf_size_xy": 200, "psf_size_z": 400, "cluster_alpha": 0.5, "cluster_beta": 2, "foci_radius": 300, "foci_nb_min_spots": 4, "assign_subfolder": "segmentation-results", "assign_subfolder_new": "segmentation-results-matched", "assign_ident_spots": "__spots.csv", "assign_ident_cell": "__mask__cells.png", "assign_ident_nuc": "mask__nuclei.png", "assign_ch_cell": "cy3", "assign_ch_nuc": "dapi", "assign_ch_spots": "cy3", "remove_cropped_cell": false, "clean_segmentation_enable": false, "plot_individual_cells_enable": false, "file": { "file_ident": "slide2_SKBR3", "fov": "well7", "img_ext": "tif", "C2": "C2-slide2_SKBR3_well7.tif", "C3": "C3-slide2_SKBR3_well7.tif" }, "create_mips": true, "show_status": true }
[FISH-QUANT][load_image] path for MIPs: /Users/kg/Downloads/cell recognition issue/analysis/imjoy-tmp/mips
[FISH-QUANT][load_image] reading image: /Users/kg/Downloads/cell recognition issue/acquisition/C2-slide2_SKBR3_well7_.tif
[FISH-QUANT][create_mip] mip saved as: /Users/kg/Downloads/cell recognition issue/analysis/imjoy-tmp/mips/img_mip_dum__C2.png
[FISH-QUANT][load_image] reading image: /Users/kg/Downloads/cell recognition issue/acquisition/C3-slide2_SKBR3_well7_.tif
[FISH-QUANT][create_mip] mip saved as: /Users/kg/Downloads/cell recognition issue/analysis/imjoy-tmp/mips/img_mip_dum__C3.png
[FISH-QUANT][load_image] loaded image: shape: (2, 33, 1040, 1392), dtype: uint16
[FISH-QUANT][filter_image] received data::
{ "files": [ { "file_ident": "slide2_SKBR3", "fov": "well7", "img_ext": "tif", "C2": "C2-slide2_SKBR3_well7_.tif", "C3": "C3-slide2_SKBR3_well7_.tif" }, { "file_ident": "slide2_MCF7", "fov": "well4", "img_ext": "tif", "C2": "C2-slide2_MCF7_well4_.tif", "C3": "C3-slide2_MCF7_well4_.tif" } ], "file_loaded": { "file_ident": "slide2_SKBR3", "fov": "well7", "img_ext": "tif", "C2": "C2-slide2_SKBR3_well7_.tif", "C3": "C3-slide2_SKBR3_well7_.tif" }, "path_root": "/Users/kg/Downloads/cell recognition issue", "path_sub_acquisition": "acquisition", "path_sub_analysis": "analysis", "z_first": true, "img_ext": "tif", "channels": [ { "name": "C2", "identifier": "C2" }, { "name": "C3", "identifier": "C3" } ], "ch_name": [], "ch_ident": [], "reg_exp": "(?P.)-(?P<file_ident>.)(?P.*).(?P<img_ext>.*)", "current_index": 1, "channel_selected": "C2", "sigma": [ 1, 0.75 ], "threshold_range": [ 0, 5000, 50 ], "minimum_distance": [ 2, 2 ], "detection_threshold": null, "th_range_min": 0, "th_range_max": 5000, "th_range_nbins": 50, "analyze_clusters": false, "create_plots": true, "show_filtered": true, "show_detection": true, "voxel_size_yx": 100, "voxel_size_z": 300, "psf_size_xy": 200, "psf_size_z": 400, "cluster_alpha": 0.5, "cluster_beta": 2, "foci_radius": 300, "foci_nb_min_spots": 4, "assign_subfolder": "segmentation-results", "assign_subfolder_new": "segmentation-results-matched", "assign_ident_spots": "__spots.csv", "assign_ident_cell": "__mask__cells.png", "assign_ident_nuc": "__mask__nuclei.png", "assign_ch_cell": "cy3", "assign_ch_nuc": "dapi", "assign_ch_spots": "cy3", "remove_cropped_cell": false, "clean_segmentation_enable": false, "plot_individual_cells_enable": false, "create_mips": true, "show_status": true }
[FISH-QUANT][filter_image] filtering channel C2 with index 0
[ 1, 0.75, 0.75 ]
[FISH-QUANT][filter_image] name base C2-slide2_SKBR3_well7_
[FISH-QUANT][create_mip] mip saved as: /Users/kg/Downloads/cell recognition issue/analysis/imjoy-tmp/mips/img_filt_mip_dum_c0.png
[FISH-QUANT][detect_test_thresholds] received data::
{ "files": [ { "file_ident": "slide2_SKBR3", "fov": "well7", "img_ext": "tif", "C2": "C2-slide2_SKBR3_well7_.tif", "C3": "C3-slide2_SKBR3_well7_.tif" }, { "file_ident": "slide2_MCF7", "fov": "well4", "img_ext": "tif", "C2": "C2-slide2_MCF7_well4_.tif", "C3": "C3-slide2_MCF7_well4_.tif" } ], "file_loaded": { "file_ident": "slide2_SKBR3", "fov": "well7", "img_ext": "tif", "C2": "C2-slide2_SKBR3_well7_.tif", "C3": "C3-slide2_SKBR3_well7_.tif" }, "path_root": "/Users/kg/Downloads/cell recognition issue", "path_sub_acquisition": "acquisition", "path_sub_analysis": "analysis", "z_first": true, "img_ext": "tif", "channels": [ { "name": "C2", "identifier": "C2" }, { "name": "C3", "identifier": "C3" } ], "ch_name": [], "ch_ident": [], "reg_exp": "(?P.)-(?P<file_ident>.)(?P.*).(?P<img_ext>.*)", "current_index": 1, "channel_selected": "C2", "sigma": [ 1, 0.75 ], "threshold_range": [ 0, 500, 10 ], "minimum_distance": [ 2, 2 ], "detection_threshold": null, "th_range_min": 0, "th_range_max": 5000, "th_range_nbins": 50, "analyze_clusters": false, "create_plots": true, "show_filtered": true, "show_detection": true, "voxel_size_yx": 100, "voxel_size_z": 300, "psf_size_xy": 200, "psf_size_z": 400, "cluster_alpha": 0.5, "cluster_beta": 2, "foci_radius": 300, "foci_nb_min_spots": 4, "assign_subfolder": "segmentation-results", "assign_subfolder_new": "segmentation-results-matched", "assign_ident_spots": "__spots.csv", "assign_ident_cell": "__mask__cells.png", "assign_ident_nuc": "__mask__nuclei.png", "assign_ch_cell": "cy3", "assign_ch_nuc": "dapi", "assign_ch_spots": "cy3", "remove_cropped_cell": false, "clean_segmentation_enable": false, "plot_individual_cells_enable": false, "show_status": true }
[FISH-QUANT][calc_local_max] received data::
{ "minimum_distance": [ 2, 2 ] }
[FISH-QUANT][detect_test_thresholds] testing threshold 0/10: 0.0 yields 409409 spots.
[FISH-QUANT][detect_test_thresholds] testing threshold 1/10: 56.0 yields 333110 spots.
[FISH-QUANT][detect_test_thresholds] testing threshold 2/10: 111.0 yields 50514 spots.
[FISH-QUANT][detect_test_thresholds] testing threshold 3/10: 167.0 yields 4309 spots.
[FISH-QUANT][detect_test_thresholds] testing threshold 4/10: 222.0 yields 723 spots.
[FISH-QUANT][detect_test_thresholds] testing threshold 5/10: 278.0 yields 259 spots.
[FISH-QUANT][detect_test_thresholds] testing threshold 6/10: 333.0 yields 130 spots.
[FISH-QUANT][detect_test_thresholds] testing threshold 7/10: 389.0 yields 93 spots.
[FISH-QUANT][detect_test_thresholds] testing threshold 8/10: 444.0 yields 66 spots.
[FISH-QUANT][detect_test_thresholds] testing threshold 9/10: 500.0 yields 52 spots.
[FISH-QUANT][detect_apply] received data::
{ "files": [ { "file_ident": "slide2_SKBR3", "fov": "well7", "img_ext": "tif", "C2": "C2-slide2_SKBR3_well7_.tif", "C3": "C3-slide2_SKBR3_well7_.tif" }, { "file_ident": "slide2_MCF7", "fov": "well4", "img_ext": "tif", "C2": "C2-slide2_MCF7_well4_.tif", "C3": "C3-slide2_MCF7_well4_.tif" } ], "file_loaded": { "file_ident": "slide2_SKBR3", "fov": "well7", "img_ext": "tif", "C2": "C2-slide2_SKBR3_well7_.tif", "C3": "C3-slide2_SKBR3_well7_.tif" }, "path_root": "/Users/kg/Downloads/cell recognition issue", "path_sub_acquisition": "acquisition", "path_sub_analysis": "analysis", "z_first": true, "img_ext": "tif", "channels": [ { "name": "C2", "identifier": "C2" }, { "name": "C3", "identifier": "C3" } ], "ch_name": [], "ch_ident": [], "reg_exp": "(?P.)-(?P<file_ident>.)(?P.*).(?P<img_ext>.*)", "current_index": 1, "channel_selected": "C2", "sigma": [ 1, 0.75 ], "threshold_range": [ 0, 500, 10 ], "minimum_distance": [ 2, 2 ], "detection_threshold": 200, "th_range_min": 0, "th_range_max": 5000, "th_range_nbins": 50, "analyze_clusters": false, "create_plots": true, "show_filtered": true, "show_detection": true, "voxel_size_yx": 100, "voxel_size_z": 300, "psf_size_xy": 200, "psf_size_z": 400, "cluster_alpha": 0.5, "cluster_beta": 2, "foci_radius": 300, "foci_nb_min_spots": 4, "assign_subfolder": "segmentation-results", "assign_subfolder_new": "segmentation-results-matched", "assign_ident_spots": "__spots.csv", "assign_ident_cell": "__mask__cells.png", "assign_ident_nuc": "__mask__nuclei.png", "assign_ch_cell": "cy3", "assign_ch_nuc": "dapi", "assign_ch_spots": "cy3", "remove_cropped_cell": false, "clean_segmentation_enable": false, "plot_individual_cells_enable": false, "show_status": true }
[FISH-QUANT][detect_apply] name base C2-slide2_SKBR3_well7_
[FISH-QUANT][detect_apply] detection with threshold 200 detects 1324 spots.
[FISH-QUANT][show_results] received data::
{ "display_type": "dialog", "data_show": [ [ "img_raw", "C2", "mip", "false" ], [ "img_filt", "C2", "mip", "true" ], [ "spots", "3", "true" ] ] }
Adding new layer with specs: ['img_raw', 'C2', 'mip', 'false']
channel_index: 0; image_type: img_raw; display_dim: mip;
Adding new layer with specs: ['img_filt', 'C2', 'mip', 'true']
channel_index: 0; image_type: img_filt; display_dim: mip;
Adding new layer with specs: ['spots', '3', 'true']
[FISH-QUANT][decompose_dense_regions] received data::
{ "files": [ { "file_ident": "slide2_SKBR3", "fov": "well7", "img_ext": "tif", "C2": "C2-slide2_SKBR3_well7_.tif", "C3": "C3-slide2_SKBR3_well7_.tif" }, { "file_ident": "slide2_MCF7", "fov": "well4", "img_ext": "tif", "C2": "C2-slide2_MCF7_well4_.tif", "C3": "C3-slide2_MCF7_well4_.tif" } ], "file_loaded": { "file_ident": "slide2_SKBR3", "fov": "well7", "img_ext": "tif", "C2": "C2-slide2_SKBR3_well7_.tif", "C3": "C3-slide2_SKBR3_well7_.tif" }, "path_root": "/Users/kg/Downloads/cell recognition issue", "path_sub_acquisition": "acquisition", "path_sub_analysis": "analysis", "z_first": true, "img_ext": "tif", "channels": [ { "name": "C2", "identifier": "C2" }, { "name": "C3", "identifier": "C3" } ], "ch_name": [], "ch_ident": [], "reg_exp": "(?P.)-(?P<file_ident>.)(?P.*).(?P<img_ext>.*)", "current_index": 1, "channel_selected": "C2", "sigma": [ 1, 0.75 ], "threshold_range": [ 0, 500, 10 ], "minimum_distance": [ 2, 2 ], "detection_threshold": 200, "th_range_min": 0, "th_range_max": 5000, "th_range_nbins": 50, "analyze_clusters": true, "create_plots": true, "show_filtered": true, "show_detection": true, "voxel_size_yx": 100, "voxel_size_z": 300, "psf_size_xy": 200, "psf_size_z": 400, "cluster_alpha": 0.5, "cluster_beta": 2, "foci_radius": 300, "foci_nb_min_spots": 4, "assign_subfolder": "segmentation-results", "assign_subfolder_new": "segmentation-results-matched", "assign_ident_spots": "__spots.csv", "assign_ident_cell": "__mask__cells.png", "assign_ident_nuc": "__mask__nuclei.png", "assign_ch_cell": "cy3", "assign_ch_nuc": "dapi", "assign_ch_spots": "cy3", "remove_cropped_cell": false, "clean_segmentation_enable": false, "plot_individual_cells_enable": false, "show_status": true }
[FISH-QUANT][decompose_dense_regions] from 1324 to 2245 spots.
[FISH-QUANT][show_results] received data::
{ "display_type": "dialog", "data_show": [ [ "img_raw", "C2", "mip", "false" ], [ "img_filt", "C2", "mip", "true" ], [ "spots_decompose", "3", "true" ] ] }
Adding nw layer with specs: ['img_raw', 'C2', 'mip', 'false']
channel_index: 0; image_type: img_raw; display_dim: mip;
Adding new layer with specs: ['img_filt', 'C2', 'mip', 'true']
channel_index: 0; image_type: img_filt; display_dim: mip;
Adding new layer with specs: ['spots_decompose', '3', 'true']
[FISH-QUANT][detect_clusters] received data::
{ "files": [ { "file_ident": "slide2_SKBR3", "fov": "well7", "img_ext": "tif", "C2": "C2-slide2_SKBR3_well7_.tif", "C3": "C3-slide2_SKBR3_well7_.tif" }, { "file_ident": "slide2_MCF7", "fov": "well4", "img_ext": "tif", "C2": "C2-slide2_MCF7_well4_.tif", "C3": "C3-slide2_MCF7_well4_.tif" } ], "file_loaded": { "file_ident": "slide2_SKBR3", "fov": "well7", "img_ext": "tif", "C2": "C2-slide2_SKBR3_well7_.tif", "C3": "C3-slide2_SKBR3_well7_.tif" }, "path_root": "/Users/kg/Downloads/cell recognition issue", "path_sub_acquisition": "acquisition", "path_sub_analysis": "analysis", "z_first": true, "img_ext": "tif", "channels": [ { "name": "C2", "identifier": "C2" }, { "name": "C3", "identifier": "C3" } ], "ch_name": [], "ch_ident": [], "reg_exp": "(?P.)-(?P<file_ident>.)(?P.*).(?P<img_ext>.*)", "current_index": 1, "channel_selected": "C2", "sigma": [ 1, 0.75 ], "threshold_range": [ 0, 500, 10 ], "minimum_distance": [ 2, 2 ], "detection_threshold": 200, "th_range_min": 0, "th_range_max": 5000, "th_range_nbins": 50, "analyze_clusters": true, "create_plots": true, "show_filtered": true, "show_detection": true, "voxel_size_yx": 100, "voxel_size_z": 300, "psf_size_xy": 200, "psf_size_z": 400, "cluster_alpha": 0.5, "cluster_beta": 2, "foci_radius": 300, "foci_nb_min_spots": 4, "assign_subfolder": "segmentation-results", "assign_subfolder_new": "segmentation-results-matched", "assign_ident_spots": "__spots.csv", "assign_ident_cell": "__mask__cells.png", "assign_ident_nuc": "__mask__nuclei.png", "assign_ch_cell": "cy3", "assign_ch_nuc": "dapi", "assign_ch_spots": "cy3", "remove_cropped_cell": false, "clean_segmentation_enable": false, "plot_individual_cells_enable": false, "show_status": true, "name_save": "tmp" }
[FISH-QUANT][detect_clusters] found 56 foci for 2245 spots
[FISH-QUANT][detect_clusters] saving cluster detection results as /Users/kg/Downloads/cell recognition issue/analysis/imjoy-tmp/C2-slide2_SKBR3_well7___cluster_calling.png
[FISH-QUANT][detection_file] received data::
Detection plot present, but removed for display
{ "files": [ { "file_ident": "slide2_SKBR3", "fov": "well7", "img_ext": "tif", "C2": "C2-slide2_SKBR3_well7_.tif", "C3": "C3-slide2_SKBR3_well7_.tif" }, { "file_ident": "slide2_MCF7", "fov": "well4", "img_ext": "tif", "C2": "C2-slide2_MCF7_well4_.tif", "C3": "C3-slide2_MCF7_well4_.tif" } ], "file_loaded": { "file_ident": "slide2_SKBR3", "fov": "well7", "img_ext": "tif", "C2": "C2-slide2_SKBR3_well7_.tif", "C3": "C3-slide2_SKBR3_well7_.tif" }, "path_root": "/Users/kg/Downloads/cell recognition issue", "path_sub_acquisition": "acquisition", "path_sub_analysis": "analysis", "z_first": true, "img_ext": "tif", "channels": [ { "name": "C2", "identifier": "C2" }, { "name": "C3", "identifier": "C3" } ], "ch_name": [], "ch_ident": [], "reg_exp": "(?P.)-(?P<file_ident>.)(?P.*).(?P<img_ext>.*)", "current_index": 1, "channel_selected": "C2", "sigma": [ 1, 0.75 ], "threshold_range": [ 0, 500, 10 ], "minimum_distance": [ 2, 2 ], "detection_threshold": 200, "th_range_min": 0, "th_range_max": 5000, "th_range_nbins": 50, "analyze_clusters": true, "create_plots": true, "show_filtered": true, "show_detection": true, "voxel_size_yx": 100, "voxel_size_z": 300, "psf_size_xy": 200, "psf_size_z": 400, "cluster_alpha": 0.5, "cluster_beta": 2, "foci_radius": 300, "foci_nb_min_spots": 4, "assign_subfolder": "segmentation-results", "assign_subfolder_new": "segmentation-results-matched", "assign_ident_spots": "__spots.csv", "assign_ident_cell": "__mask__cells.png", "assign_ident_nuc": "__mask__nuclei.png", "assign_ch_cell": "cy3", "assign_ch_nuc": "dapi", "assign_ch_spots": "cy3", "remove_cropped_cell": false, "clean_segmentation_enable": false, "plot_individual_cells_enable": false, "batch_analysis": false }
[FISH-QUANT][detect_apply] received data::
{ "files": [ { "file_ident": "slide2_SKBR3", "fov": "well7", "img_ext": "tif", "C2": "C2-slide2_SKBR3_well7_.tif", "C3": "C3-slide2_SKBR3_well7_.tif" }, { "file_ident": "slide2_MCF7", "fov": "well4", "img_ext": "tif", "C2": "C2-slide2_MCF7_well4_.tif", "C3": "C3-slide2_MCF7_well4_.tif" } ], "file_loaded": { "file_ident": "slide2_SKBR3", "fov": "well7", "img_ext": "tif", "C2": "C2-slide2_SKBR3_well7_.tif", "C3": "C3-slide2_SKBR3_well7_.tif" }, "path_root": "/Users/kg/Downloads/cell recognition issue", "path_sub_acquisition": "acquisition", "path_sub_analysis": "analysis", "z_first": true, "img_ext": "tif", "channels": [ { "name": "C2", "identifier": "C2" }, { "name": "C3", "identifier": "C3" } ], "ch_name": [], "ch_ident": [], "reg_exp": "(?P.)-(?P<file_ident>.)(?P.*).(?P<img_ext>.*)", "current_index": 1, "channel_selected": "C2", "sigma": [ 1, 0.75 ], "threshold_range": [ 0, 500, 10 ], "minimum_distance": [ 2, 2 ], "detection_threshold": 200, "th_range_min": 0, "th_range_max": 5000, "th_range_nbins": 50, "analyze_clusters": true, "create_plots": true, "show_filtered": true, "show_detection": true, "voxel_size_yx": 100, "voxel_size_z": 300, "psf_size_xy": 200, "psf_size_z": 400, "cluster_alpha": 0.5, "cluster_beta": 2, "foci_radius": 300, "foci_nb_min_spots": 4, "assign_subfolder": "segmentation-results", "assign_subfolder_new": "segmentation-results-matched", "assign_ident_spots": "__spots.csv", "assign_ident_cell": "__mask__cells.png", "assign_ident_nuc": "__mask__nuclei.png", "assign_ch_cell": "cy3", "assign_ch_nuc": "dapi", "assign_ch_spots": "cy3", "remove_cropped_cell": false, "clean_segmentation_enable": false, "plot_individual_cells_enable": false, "batch_analysis": false, "create_mips": false, "show_status": false, "analysis_region": [], "name_save": "/Users/kg/Downloads/cell recognition issue/analysis/spot_detection/plots_detection/C2-slide2_SKBR3_well7___detection" }
[FISH-QUANT][detect_apply] name base C2-slide2_SKBR3_well7_
[FISH-QUANT][detect_apply] save plots with detection results: /Users/kg/Downloads/cell recognition issue/analysis/spot_detection/plots_detection/C2-slide2_SKBR3_well7___detection.
[FISH-QUANT][detect_apply] detection with threshold 200 detects 1324 spots.
[FISH-QUANT][save_spots] results (ZYX saved as: /Users/kg/Downloads/cell recognition issue/analysis/spot_detection/C2-slide2_SKBR3_well7___spots.csv
[FISH-QUANT][decompose_dense_regions] received data::
{ "files": [ { "file_ident": "slide2_SKBR3", "fov": "well7", "img_ext": "tif", "C2": "C2-slide2_SKBR3_well7_.tif", "C3": "C3-slide2_SKBR3_well7_.tif" }, { "file_ident": "slide2_MCF7", "fov": "well4", "img_ext": "tif", "C2": "C2-slide2_MCF7_well4_.tif", "C3": "C3-slide2_MCF7_well4_.tif" } ], "file_loaded": { "file_ident": "slide2_SKBR3", "fov": "well7", "img_ext": "tif", "C2": "C2-slide2_SKBR3_well7_.tif", "C3": "C3-slide2_SKBR3_well7_.tif" }, "path_root": "/Users/kg/Downloads/cell recognition issue", "path_sub_acquisition": "acquisition", "path_sub_analysis": "analysis", "z_first": true, "img_ext": "tif", "channels": [ { "name": "C2", "identifier": "C2" }, { "name": "C3", "identifier": "C3" } ], "ch_name": [], "ch_ident": [], "reg_exp": "(?P.)-(?P<file_ident>.)(?P.*).(?P<img_ext>.*)", "current_index": 1, "channel_selected": "C2", "sigma": [ 1, 0.75 ], "threshold_range": [ 0, 500, 10 ], "minimum_distance": [ 2, 2 ], "detection_threshold": 200, "th_range_min": 0, "th_range_max": 5000, "th_range_nbins": 50, "analyze_clusters": true, "create_plots": true, "show_filtered": true, "show_detection": true, "voxel_size_yx": 100, "voxel_size_z": 300, "psf_size_xy": 200, "psf_size_z": 400, "cluster_alpha": 0.5, "cluster_beta": 2, "foci_radius": 300, "foci_nb_min_spots": 4, "assign_subfolder": "segmentation-results", "assign_subfolder_new": "segmentation-results-matched", "assign_ident_spots": "__spots.csv", "assign_ident_cell": "__mask__cells.png", "assign_ident_nuc": "__mask__nuclei.png", "assign_ch_cell": "cy3", "assign_ch_nuc": "dapi", "assign_ch_spots": "cy3", "remove_cropped_cell": false, "clean_segmentation_enable": false, "plot_individual_cells_enable": false, "batch_analysis": false, "create_mips": false, "show_status": false, "analysis_region": [], "name_save": "/Users/kg/Downloads/cell recognition issue/analysis/spot_detection/plots_detection/C2-slide2_SKBR3_well7___detection" }
[FISH-QUANT][decompose_dense_regions] from 1324 to 2245 spots.
[FISH-QUANT][detect_clusters] received data::
{ "files": [ { "file_ident": "slide2_SKBR3", "fov": "well7", "img_ext": "tif", "C2": "C2-slide2_SKBR3_well7_.tif", "C3": "C3-slide2_SKBR3_well7_.tif" }, { "file_ident": "slide2_MCF7", "fov": "well4", "img_ext": "tif", "C2": "C2-slide2_MCF7_well4_.tif", "C3": "C3-slide2_MCF7_well4_.tif" } ], "file_loaded": { "file_ident": "slide2_SKBR3", "fov": "well7", "img_ext": "tif", "C2": "C2-slide2_SKBR3_well7_.tif", "C3": "C3-slide2_SKBR3_well7_.tif" }, "path_root": "/Users/kg/Downloads/cell recognition issue", "path_sub_acquisition": "acquisition", "path_sub_analysis": "analysis", "z_first": true, "img_ext": "tif", "channels": [ { "name": "C2", "identifier": "C2" }, { "name": "C3", "identifier": "C3" } ], "ch_name": [], "ch_ident": [], "reg_exp": "(?P.)-(?P<file_ident>.)(?P.*).(?P<img_ext>.*)", "current_index": 1, "channel_selected": "C2", "sigma": [ 1, 0.75 ], "threshold_range": [ 0, 500, 10 ], "minimum_distance": [ 2, 2 ], "detection_threshold": 200, "th_range_min": 0, "th_range_max": 5000, "th_range_nbins": 50, "analyze_clusters": true, "create_plots": true, "show_filtered": true, "show_detection": true, "voxel_size_yx": 100, "voxel_size_z": 300, "psf_size_xy": 200, "psf_size_z": 400, "cluster_alpha": 0.5, "cluster_beta": 2, "foci_radius": 300, "foci_nb_min_spots": 4, "assign_subfolder": "segmentation-results", "assign_subfolder_new": "segmentation-results-matched", "assign_ident_spots": "__spots.csv", "assign_ident_cell": "__mask__cells.png", "assign_ident_nuc": "__mask__nuclei.png", "assign_ch_cell": "cy3", "assign_ch_nuc": "dapi", "assign_ch_spots": "cy3", "remove_cropped_cell": false, "clean_segmentation_enable": false, "plot_individual_cells_enable": false, "batch_analysis": false, "create_mips": false, "show_status": false, "analysis_region": [], "name_save": "/Users/kg/Downloads/cell recognition issue/analysis/spot_detection/plots_foci/C2-slide2_SKBR3_well7___foci_calling" }
[FISH-QUANT][detect_clusters] found 56 foci for 2245 spots
[FISH-QUANT][detect_clusters] saving cluster detection results as /Users/kg/Downloads/cell recognition issue/analysis/spot_detection/plots_foci/C2-slide2_SKBR3_well7___foci_calling.png
[FISH-QUANT][save_spots] results (ZYXF saved as: /Users/kg/Downloads/cell recognition issue/analysis/spot_detection/C2-slide2_SKBR3_well7___spots_foci.csv
[FISH-QUANT][save_foci] results (<class 'type'> saved as: /Users/kg/Downloads/cell recognition issue/analysis/spot_detection/C2-slide2_SKBR3_well7___foci.csv
[FISH-QUANT][save_analysis_details]
[FISH-QUANT][save_analysis_details] saved as /Users/kg/Downloads/cell recognition issue/analysis/spot_detection/C2-slide2_SKBR3_well7___analysis_details.json
[FISH-QUANT][clean_segmentation] received data::
{ "files": [ { "file_ident": "slide2_SKBR3", "fov": "well7", "img_ext": "tif", "C2": "C2-slide2_SKBR3_well7_.tif", "C3": "C3-slide2_SKBR3_well7_.tif" }, { "file_ident": "slide2_MCF7", "fov": "well4", "img_ext": "tif", "C2": "C2-slide2_MCF7_well4_.tif", "C3": "C3-slide2_MCF7_well4_.tif" } ], "file_loaded": { "file_ident": "slide2_SKBR3", "fov": "well7", "img_ext": "tif", "C2": "C2-slide2_SKBR3_well7_.tif", "C3": "C3-slide2_SKBR3_well7_.tif" }, "path_root": "/Users/kg/Downloads/cell recognition issue", "path_sub_acquisition": "acquisition", "path_sub_analysis": "analysis", "z_first": true, "img_ext": "tif", "channels": [ { "name": "C2", "identifier": "C2" }, { "name": "C3", "identifier": "C3" } ], "ch_name": [], "ch_ident": [], "reg_exp": "(?P.)-(?P<file_ident>.)(?P.*).(?P<img_ext>.*)", "current_index": 1, "channel_selected": "C2", "sigma": [ 1, 0.75 ], "threshold_range": [ 0, 500, 10 ], "minimum_distance": [ 2, 2 ], "detection_threshold": 200, "th_range_min": 0, "th_range_max": 5000, "th_range_nbins": 50, "analyze_clusters": true, "create_plots": true, "show_filtered": true, "show_detection": true, "voxel_size_yx": 100, "voxel_size_z": 300, "psf_size_xy": 200, "psf_size_z": 400, "cluster_alpha": 0.5, "cluster_beta": 2, "foci_radius": 300, "foci_nb_min_spots": 4, "assign_subfolder": "segmentation-results", "assign_subfolder_new": "segmentation-results-matched", "assign_ident_spots": "__spots.csv", "assign_ident_cell": "__mask__cells.png", "assign_ident_nuc": "__mask__nuclei.png", "assign_ch_cell": "C2", "assign_ch_nuc": "C3", "assign_ch_spots": "C2", "remove_cropped_cell": false, "clean_segmentation_enable": true, "plot_individual_cells_enable": false }
Analyzing segmentation result for: /Users/kg/Downloads/cell recognition issue/analysis/segmentation-results/C2-slide2_MCF7_well4___mask__cells.png
Created path to save new segmentation masks: /Users/kg/Downloads/cell recognition issue/analysis/segmentation-results-matched
Analyzing segmentation result for: /Users/kg/Downloads/cell recognition issue/analysis/segmentation-results/C2-slide2_SKBR3_well7___mask__cells.png
[FISH-QUANT][assign_rnas_cells] received data::
{ "files": [ { "file_ident": "slide2_SKBR3", "fov": "well7", "img_ext": "tif", "C2": "C2-slide2_SKBR3_well7_.tif", "C3": "C3-slide2_SKBR3_well7_.tif" }, { "file_ident": "slide2_MCF7", "fov": "well4", "img_ext": "tif", "C2": "C2-slide2_MCF7_well4_.tif", "C3": "C3-slide2_MCF7_well4_.tif" } ], "file_loaded": { "file_ident": "slide2_SKBR3", "fov": "well7", "img_ext": "tif", "C2": "C2-slide2_SKBR3_well7_.tif", "C3": "C3-slide2_SKBR3_well7_.tif" }, "path_root": "/Users/kg/Downloads/cell recognition issue", "path_sub_acquisition": "acquisition", "path_sub_analysis": "analysis", "z_first": true, "img_ext": "tif", "channels": [ { "name": "C2", "identifier": "C2" }, { "name": "C3", "identifier": "C3" } ], "ch_name": [], "ch_ident": [], "reg_exp": "(?P.)-(?P<file_ident>.)(?P.*).(?P<img_ext>.*)", "current_index": 1, "channel_selected": "C2", "sigma": [ 1, 0.75 ], "threshold_range": [ 0, 500, 10 ], "minimum_distance": [ 2, 2 ], "detection_threshold": 200, "th_range_min": 0, "th_range_max": 5000, "th_range_nbins": 50, "analyze_clusters": true, "create_plots": true, "show_filtered": true, "show_detection": true, "voxel_size_yx": 100, "voxel_size_z": 300, "psf_size_xy": 200, "psf_size_z": 400, "cluster_alpha": 0.5, "cluster_beta": 2, "foci_radius": 300, "foci_nb_min_spots": 4, "assign_subfolder": "segmentation-results", "assign_subfolder_new": "segmentation-results", "assign_ident_spots": "__spots.csv", "assign_ident_cell": "__mask__cells.png", "assign_ident_nuc": "__mask__nuclei.png", "assign_ch_cell": "C2", "assign_ch_nuc": "C3", "assign_ch_spots": "C2", "remove_cropped_cell": false, "clean_segmentation_enable": true, "plot_individual_cells_enable": true }
Analyzing spots detection file /Users/kg/Downloads/cell recognition issue/analysis/spot_detection/C2-slide2_MCF7_well4___spots.csv
Loading image: /Users/kg/Downloads/cell recognition issue/acquisition/C2-slide2_MCF7_well4_.tif
Image dimension: 3
Spots (total/cyto/nucleus): 9037/4524/4513
number of cells identified: 1
[ { "cell_id": 10, "bbox": [ 348, 804, 800, 1138 ], "cell_coord": { "_rtype": "ndarray", "_rshape": [ 104, 2 ], "_rdtype": "int64", "_rvalue": {} }, "cell_mask": { "_rtype": "ndarray", "_rshape": [ 452, 334 ], "_rdtype": "bool", "_rvalue": {} }, "nuc_coord": { "_rtype": "ndarray", "_rshape": [ 698, 2 ], "_rdtype": "int64", "_rvalue": {} }, "nuc_mask": { "_rtype": "ndarray", "_rshape": [ 452, 334 ], "_rdtype": "bool", "_rvalue": {} }, "rna_coord": { "_rtype": "ndarray", "_rshape": [ 901, 3 ], "_rdtype": "int64", "_rvalue": {} }, "image": { "_rtype": "ndarray", "_rshape": [ 452, 334 ], "_rdtype": "uint16", "_rvalue": {} } } ]
Results will be saved as /Users/kg/Downloads/cell recognition issue/analysis/spot_detection/results_per_fov/C2-slide2_MCF7_well4__SPOTS_SUMMARY.csv
Analyzing spots detection file /Users/kg/Downloads/cell recognition issue/analysis/spot_detection/C2-slide2_SKBR3_well7___spots.csv
Loading image: /Users/kg/Downloads/cell recognition issue/acquisition/C2-slide2_SKBR3_well7_.tif
Image dimension: 3
Spots (total/cyto/nucleus): 1324/748/576
number of cells identified: 3
[ { "cell_id": 3, "bbox": [ 0, 830, 320, 1192 ], "cell_coord": { "_rtype": "ndarray", "_rshape": [ 1450, 2 ], "_rdtype": "int64", "_rvalue": {} }, "cell_mask": { "_rtype": "ndarray", "_rshape": [ 320, 362 ], "_rdtype": "bool", "_rvalue": {} }, "nuc_coord": { "_rtype": "ndarray", "_rshape": [ 790, 2 ], "_rdtype": "int64", "_rvalue": {} }, "nuc_mask": { "_rtype": "ndarray", "_rshape": [ 320, 362 ], "_rdtype": "bool", "_rvalue": {} }, "rna_coord": { "_rtype": "ndarray", "_rshape": [ 108, 3 ], "_rdtype": "int64", "_rvalue": {} }, "image": { "_rtype": "ndarray", "_rshape": [ 320, 362 ], "_rdtype": "uint16", "_rvalue": {} } }, { "cell_id": 4, "bbox": [ 14, 524, 320, 818 ], "cell_coord": { "_rtype": "ndarray", "_rshape": [ 1268, 2 ], "_rdtype": "int64", "_rvalue": {} }, "cell_mask": { "_rtype": "ndarray", "_rshape": [ 306, 294 ], "_rdtype": "bool", "_rvalue": {} }, "nuc_coord": { "_rtype": "ndarray", "_rshape": [ 736, 2 ], "_rdtype": "int64", "_rvalue": {} }, "nuc_mask": { "_rtype": "ndarray", "_rshape": [ 306, 294 ], "_rdtype": "bool", "_rvalue": {} }, "rna_coord": { "_rtype": "ndarray", "_rshape": [ 65, 3 ], "_rdtype": "int64", "_rvalue": {} }, "image": { "_rtype": "ndarray", "_rshape": [ 306, 294 ], "_rdtype": "uint16", "_rvalue": {} } }, { "cell_id": 5, "bbox": [ 80, 1126, 400, 1392 ], "cell_coord": { "_rtype": "ndarray", "_rshape": [ 1282, 2 ], "_rdtype": "int64", "_rvalue": {} }, "cell_mask": { "_rtype": "ndarray", "_rshape": [ 320, 266 ], "_rdtype": "bool", "_rvalue": {} }, "nuc_coord": { "_rtype": "ndarray", "_rshape": [ 370, 2 ], "_rdtype": "int64", "_rvalue": {} }, "nuc_mask": { "_rtype": "ndarray", "_rshape": [ 320, 266 ], "_rdtype": "bool", "_rvalue": {} }, "rna_coord": { "_rtype": "ndarray", "_rshape": [ 88, 3 ], "_rdtype": "int64", "_rvalue": {} }, "image": { "_rtype": "ndarray", "_rshape": [ 320, 266 ], "_rdtype": "uint16", "_rvalue": {} } } ]
Results will be saved as /Users/kg/Downloads/cell recognition issue/analysis/spot_detection/results_per_fov/C2-slide2_SKBR3_well7__SPOTS_SUMMARY.csv
Screenshots

ebc-a1ef-95e40b95bdd1.png)
cell_id cell_area nuc_area nb_rna nb_rna_in_nuc nb_rna_out_nuc
3 85112 28424 5550 1913 3637
4 60432 25160 3157 1321 1836
5 58644 4588 5062 470 4592
Versions:
macOS Ventura Version 13.0.1
Chrome Version 108.0.5359.124
Additional context
Thank yout for this software!
The data i used:
https://drive.google.com/drive/folders/1xbkvPNF23Rl7e_d8QSPay4v8s20ozQj8
Installing the ImJoy plugin enigne is not always easy & can also lead to issue with dependencies.
Would be useful to provide a Docker image to faciliate the installation.
Hi, I'm having some problems adapting the parameters of the detection in images with high background interference. I work with plant tissue, so the autofluorescence is sometimes really high. When I run your software in MATLAB I had been able to discard those dots coming from the high-intensity background, by setting a maximum threshold in the Sigma-XY criteria. Now I'm trying with your ImJoy version and I see that I can just adjust the minimum threshold for intensity. Is there any possibility to adapt this to improve the detection precision?
The settings I'm using are:
"settings": {
"filter": {
"method": "LoG",
"sigma": [
1,
0.75,
0.75
]
},
"detection": {
"method": "localmax",
"mind_dist": [
2,
2
],
"threshold": 122
And this is the output that I'm obtaining:

If I analyze the same outline with similar criteria in MATLAB and adjust the sigmaXY maximum threshold I obtain a good detection. Here I show you the results for the cell marked with a red square above


Do you have any suggestions on how could I adjust better this criteria in Imjoy?
Thanks in advance
Currently, 3D images are projected into 2D with a maximum intensity projection. For some display, images are automatically rescaled and shown, these images are also used to create results plots.
Might be good to have some control of this process by providing advanced settings to
A declarative, efficient, and flexible JavaScript library for building user interfaces.
🖖 Vue.js is a progressive, incrementally-adoptable JavaScript framework for building UI on the web.
TypeScript is a superset of JavaScript that compiles to clean JavaScript output.
An Open Source Machine Learning Framework for Everyone
The Web framework for perfectionists with deadlines.
A PHP framework for web artisans
Bring data to life with SVG, Canvas and HTML. 📊📈🎉
JavaScript (JS) is a lightweight interpreted programming language with first-class functions.
Some thing interesting about web. New door for the world.
A server is a program made to process requests and deliver data to clients.
Machine learning is a way of modeling and interpreting data that allows a piece of software to respond intelligently.
Some thing interesting about visualization, use data art
Some thing interesting about game, make everyone happy.
We are working to build community through open source technology. NB: members must have two-factor auth.
Open source projects and samples from Microsoft.
Google ❤️ Open Source for everyone.
Alibaba Open Source for everyone
Data-Driven Documents codes.
China tencent open source team.
