
Pipe is a Web app for querying any data source, and analyzing and visualizing the result.
LIVE DEMO: http://rf.pipend.com/
Usually 3 different software are needed to write and execute a query on a database, transform the result and visualize the outcome.
How many times did you have to copy and paste the result of a SQL or MongoDB query into another tool (Excel, R, or your custom app) for further analysis and then copy the result of your analysis into another tool for sharing it on the Web or with your colleagues?
Pipe is an all-in-one solution for querying, analyzing and visualizing any data source and sharing the result.
The project is currently under development
- Start a mongodb instance
- Start a redis instance (optional, it is only necessary if you choose
redis-storevalue forcache-storeconfig) $ git clone https://github.com/Pipend/pipe.git$ sudo npm installnpm run configureto createconfig.lsin the root of the repository. Review and update the following in the config- Update
query-database-connection-stringto the query string of your mongodb instance - Configure
connectionshash by specifying the connection details for the databses that you like to connect and query. Each connection is a LiveScript hash; you can configure as many connections as you like for the following kind databses: MongoDB, MSSQL, PostgreSQL, MySQL. - Configure
cache-store, you can choose eitherredis-storeorjs-store(in-memory) $ gulp- Open a browser and navigate to http://localhost:4081
For the screenshot feature make sure you have PhantomJS ≥ 2.0.1 in your PATH.
You can connect Pipe to almost any data source. It comes with built-in support for the following databases:
- SQL: (MySQL, PostreSQL, MSSQL)
- MongoDB
- ElasticSearch
- Redis
- Any Web API (using curl) or Stream (using WebSockets)
Multi Query
The result of a Pipe query can be used as the input of another query: multiple Pipe queries can be joined together in a larger computation.
Depending on your database and query language, some analysis are easier and faster done on the result of the query at client-side.
Use Transformation block to manipulate the result of your query using built-in utilities and statistical functions. (you can even import and use your favorite JavaScript library)
This snippet gives you a taste of data transformation in Pipe:
result =>
   result.map(({_id, values}) => ({
      key: _id,
      values: values
         .map(({bucket, count}) => [bucket * 3600*1000, count])
  }))
You can program your transformation snippet in ES6 JavaScript (using Underscore, Lodash, RxJS or similar libraries) or LiveScript (using Prelude.ls).
Pipe provides a compact and powerful syntax for writing (dynamic) MongoDB and ElasticSearch queries. It also supports macros in SQL:
SELECT ProductId, Count(*) AS Units FROM Purchases
WHERE CustomerId IN (${customers.map(c => c.id).join(',')}$)
In this example customers array can be the result of another Pipe query that is passed as the input into this SQL query.
Using Pipe syntax a MongoDB aggregation query will look like:
$match do
  campaignId: 12341
  creationTime:
    $gte: new Date '2016–01–01' .valueOf!
    $lte: Date.now!

$group do
  _id: bucketize 24 * 3600 * 1000, '$creationTime'
  impressions: $sum: '$impressions'
  clicks: $sum: '$clicks'

$sort impressions: -1
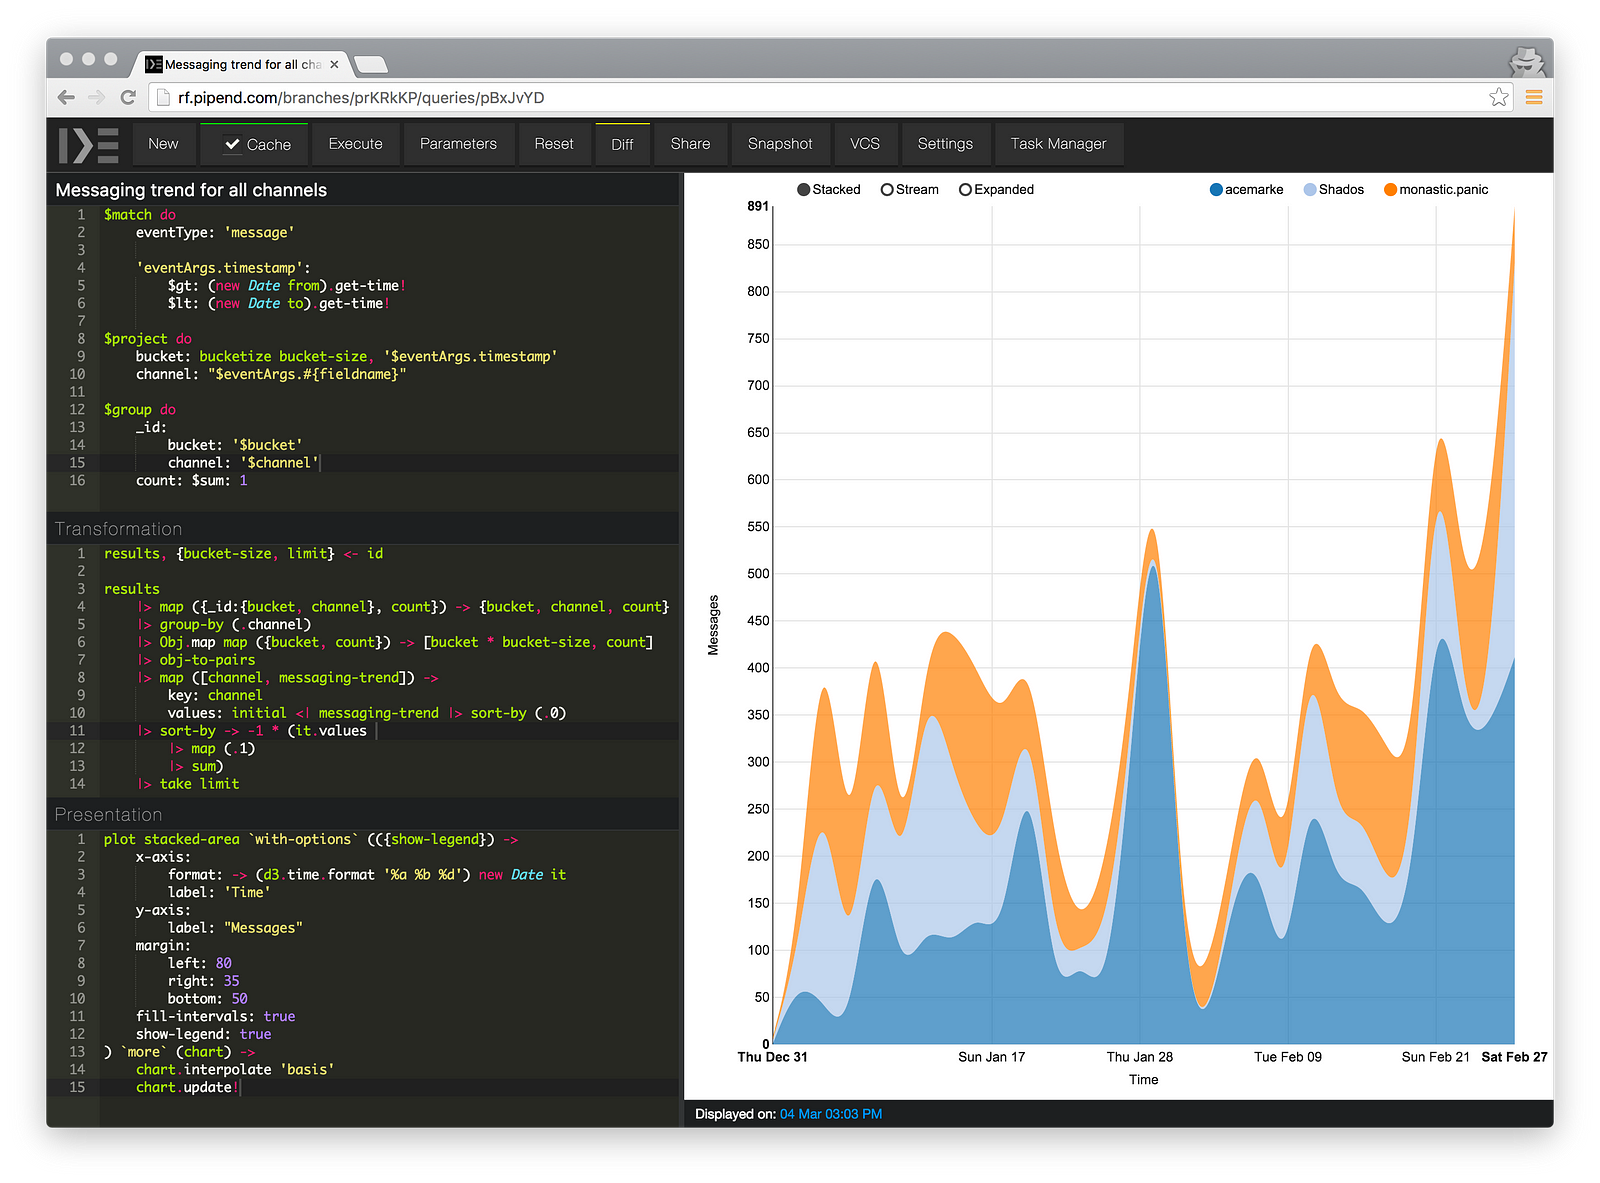
Plottables are ready-to-use, standardized data visualization components. Pipe comes with many built-in Plottables (check them out here: http://pipend.github.io/pipe-web-client/).
Using a Plottable can be as easy as:
plot(withOptions(timeseries, {
    x: d => d.time
  , y: d => d.value
})
Or just plot(timeseries).
Pipe is a gist for your queries, you can save, fork, clone or share the source code of your query or just the final result of transformation or visualization.
Pipe supports JavaScript, ES6 Babel or LiveScript.


