Giter Site home page Giter Site logo

grafana / pyroscope Goto Github PK

View Code? Open in Web Editor NEW
9.4K 89.0 556.0 130.99 MB

Continuous Profiling Platform. Debug performance issues down to a single line of code

Home Page: https://grafana.com/oss/pyroscope/

License: GNU Affero General Public License v3.0

Dockerfile 0.02% Makefile 0.34% Go 39.80% Shell 0.16% JavaScript 0.22% SCSS 0.68% HTML 0.02% Jsonnet 0.52% TypeScript 10.33% CSS 0.34% C 47.53% Mustache 0.03% CMake 0.01%
continuous-profiling profiling performance golang ruby python find-bottlenecks linux pyroscope observability

pyroscope's Introduction

Pyroscope

ci JS Tests Status Go Report License: AGPLv3 FOSSA Status Latest release DockerHub GoDoc

๐ŸŒŸ What is Grafana Pyroscope?

Grafana Pyroscope is an open source continuous profiling platform. It will help you:

  • Find performance issues and bottlenecks in your code
  • Use high-cardinality tags/labels to analyze your application
  • Resolve issues with high CPU utilization
  • Track down memory leaks
  • Understand the call tree of your application
  • Auto-instrument your code to link profiling data to traces

๐Ÿ”ฅ Pyroscope Live Demo ๐Ÿ”ฅ

Pyroscope GIF Demo

๐ŸŽ‰ Features

  • Minimal CPU overhead
  • Horizontally scalable
  • Efficient compression, low disk space requirements
  • Can handle high-cardinality tags/labels
  • Calculate the performance "diff" between various tags/labels and time periods
  • Advanced analysis UI

๐Ÿ’ป Quick Start: Run Pyroscope Locally

Homebrew

brew install pyroscope-io/brew/pyroscope
brew services start pyroscope

Docker

docker run -it -p 4040:4040 grafana/pyroscope

For more documentation on how to configure Pyroscope server, see our server documentation.

Send data to server via Pyroscope agent (language specific)

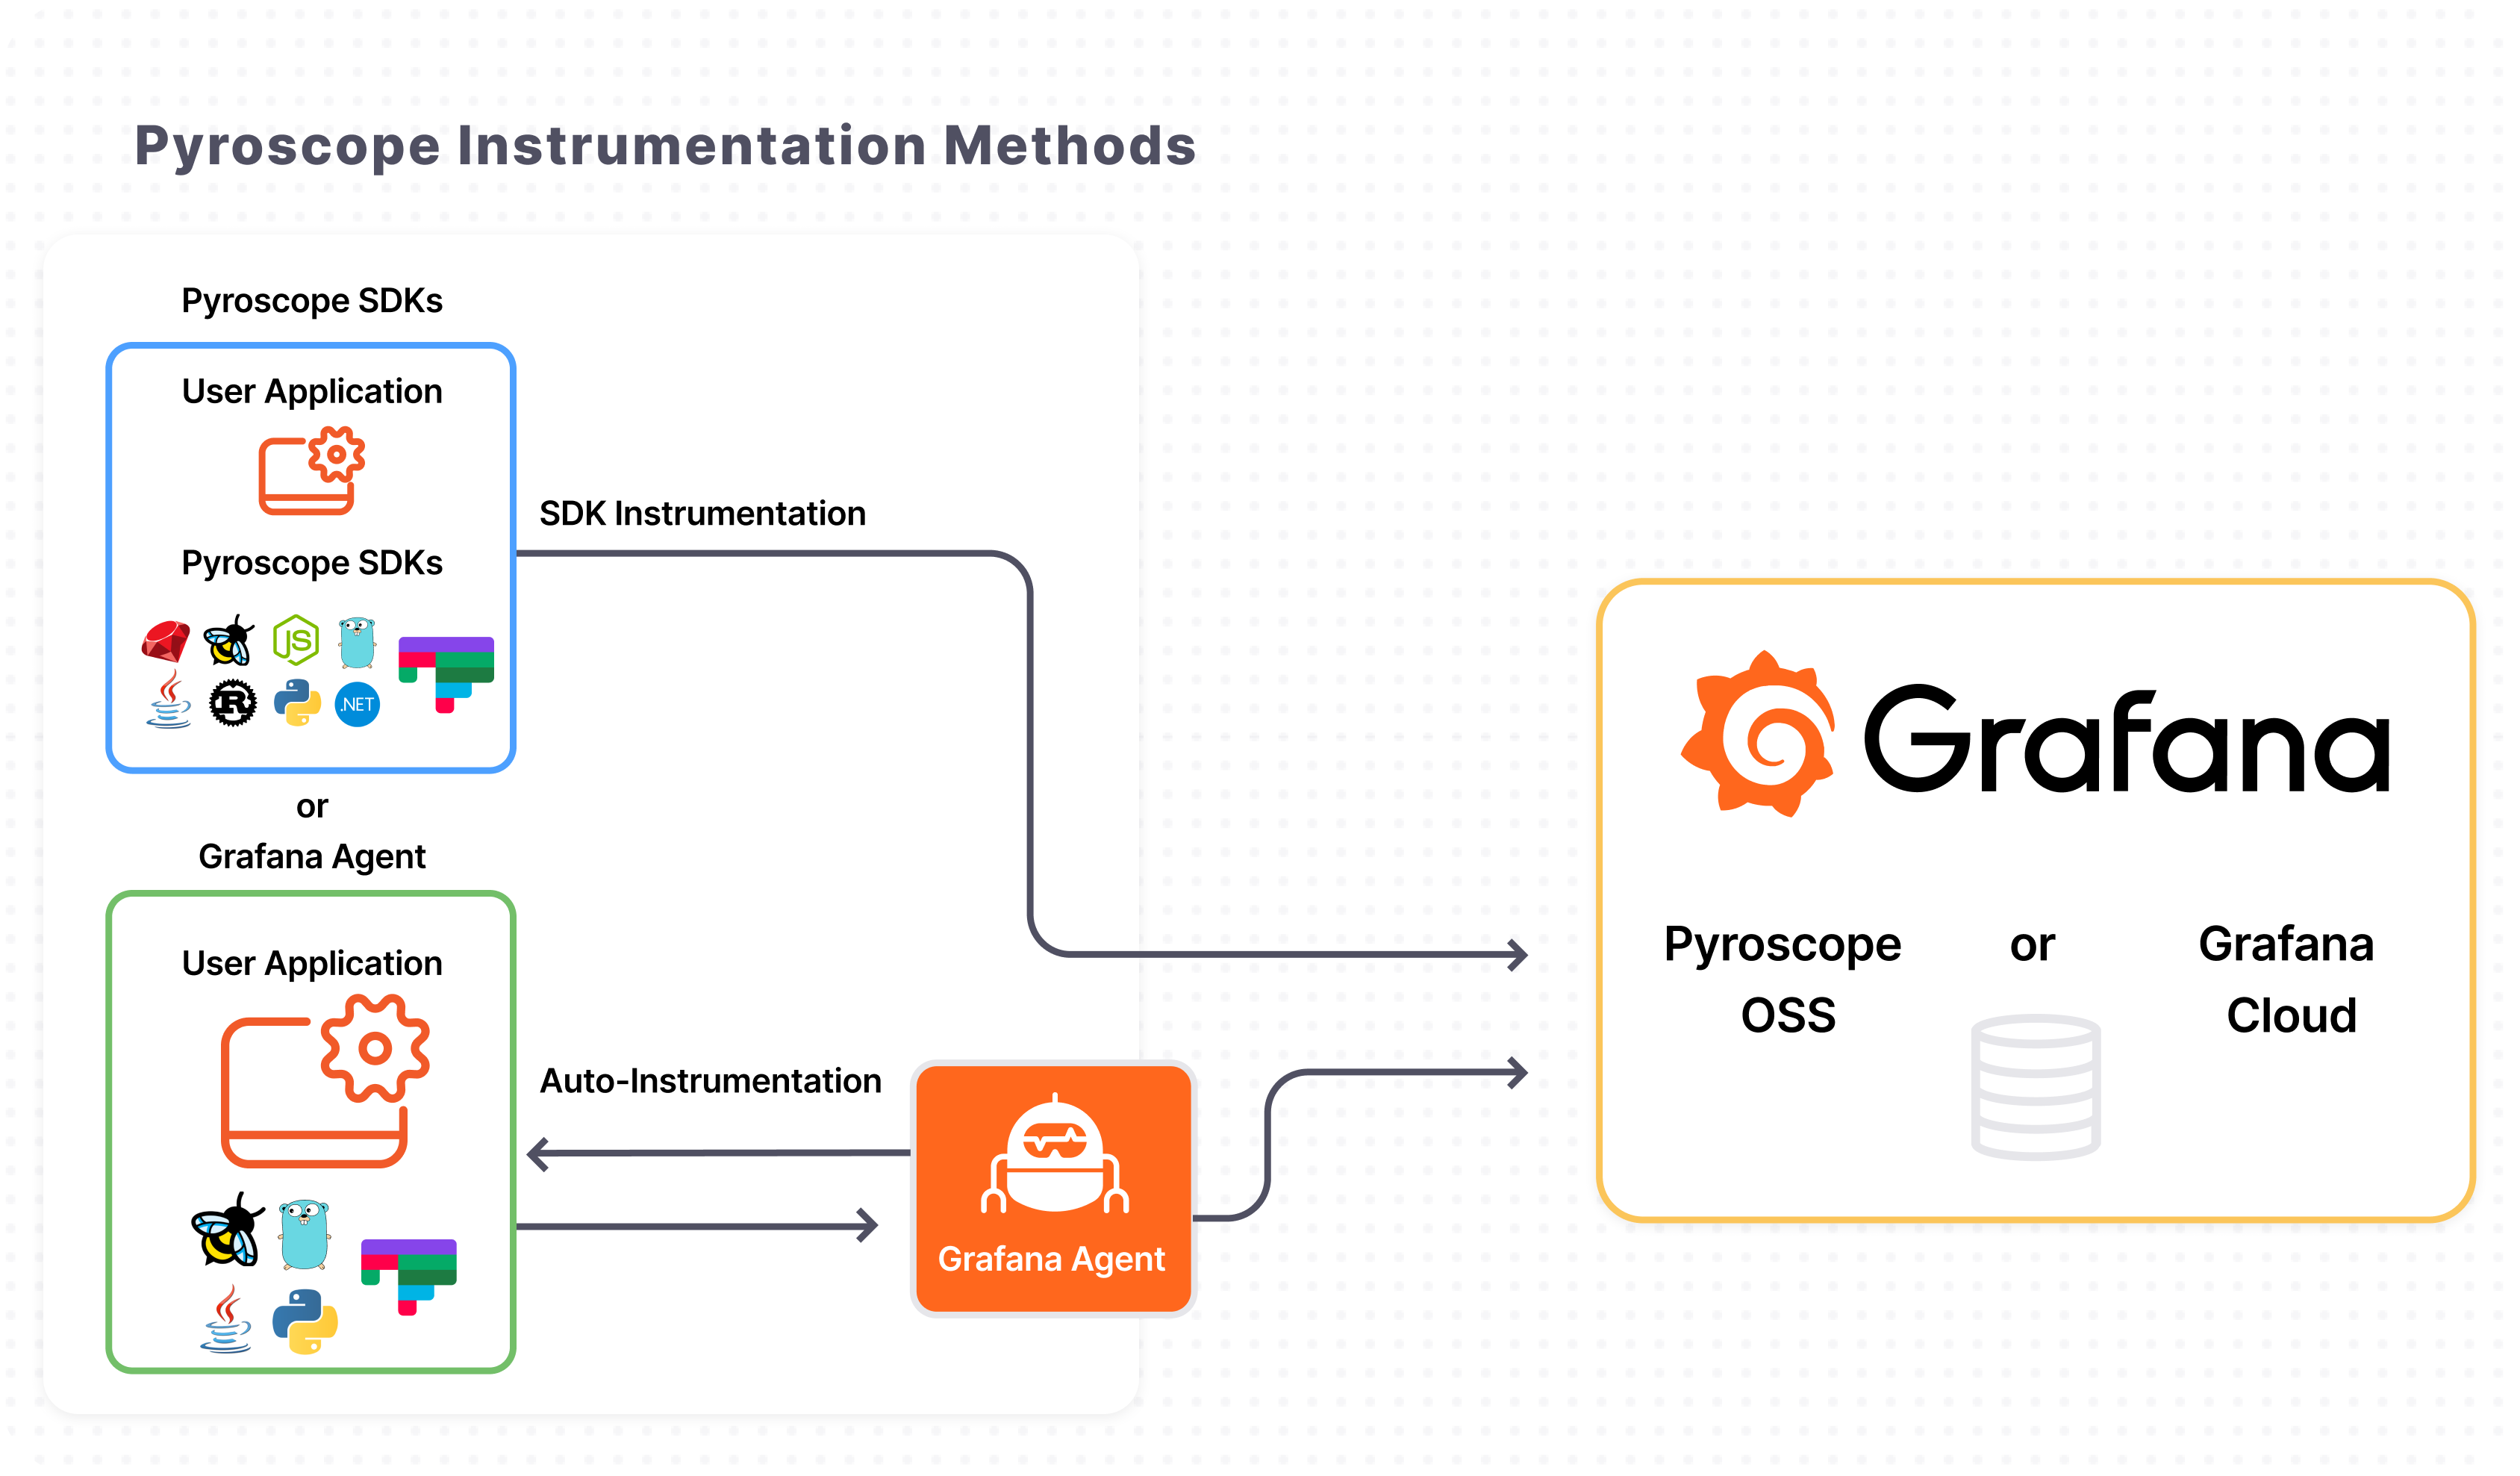
For more documentation on how to add the Pyroscope agent to your code, see the agent documentation on our website or find language specific examples and documentation below:


Golang

Documentation
Examples

Java

Documentation
Examples

Python

Documentation
Examples

Ruby

Documentation
Examples

Node.js

Documentation
Examples

Dotnet

Documentation
Examples

eBPF

Documentation
Examples

Rust

Documentation
Examples

Deployment Diagram

deployment_diagram

Documentation

For more information on how to use Pyroscope with other programming languages, install it on Linux, or use it in production environment, check out our documentation:

Downloads

You can download the latest version of pyroscope for macOS, linux and Docker from our Releases page.

Supported Languages

  • Go (via pprof)
  • Python (via py-spy)
  • Ruby (via rbspy)
  • Linux eBPF
  • Java (via async-profiler)
  • Rust (via pprof-rs)
  • .NET
  • PHP (via phpspy)
  • Node

Let us know what other integrations you want to see in our issues or in our slack.

Credits

Pyroscope is possible thanks to the excellent work of many people, including but not limited to:

  • Brendan Gregg โ€” inventor of Flame Graphs
  • Julia Evans โ€” creator of rbspy โ€” sampling profiler for Ruby
  • Vladimir Agafonkin โ€” creator of flamebearer โ€” fast flame graph renderer
  • Ben Frederickson โ€” creator of py-spy โ€” sampling profiler for Python
  • Adam Saponara โ€” creator of phpspy โ€” sampling profiler for PHP
  • Alexei Starovoitov, Brendan Gregg, and many others who made BPF based profiling in Linux kernel possible
  • Jamie Wong โ€” creator of speedscope โ€” interactive flame graph visualizer

Contributing

To start contributing, check out our Contributing Guide

Thanks to the contributors of Pyroscope!

pyroscope's People

Contributors

09jvilla avatar abeaumont avatar adrk avatar aleks-p avatar alonlong avatar aocenas avatar bryanhuhta avatar cyriltovena avatar darrenjaneczek avatar dependabot[bot] avatar dogfrogfog avatar eh-am avatar eve832 avatar github-actions[bot] avatar grafakus avatar hi-rustin avatar iolivernguyen avatar jdbaldry avatar joey-grafana avatar knylander-grafana avatar kolesnikovae avatar korniltsev avatar loggy avatar louisinflow avatar pavelpashkovsky avatar petethepig avatar pyroscopebot avatar rperry2174 avatar shaleynikov avatar simonswine avatar

Stargazers

 avatar  avatar  avatar  avatar  avatar  avatar  avatar  avatar  avatar  avatar  avatar  avatar  avatar  avatar  avatar  avatar  avatar  avatar  avatar  avatar  avatar  avatar  avatar  avatar  avatar  avatar  avatar  avatar  avatar  avatar  avatar  avatar  avatar  avatar  avatar  avatar  avatar  avatar  avatar  avatar  avatar  avatar  avatar  avatar  avatar  avatar  avatar  avatar  avatar  avatar  avatar  avatar  avatar  avatar  avatar  avatar  avatar  avatar  avatar  avatar  avatar  avatar  avatar  avatar  avatar  avatar  avatar  avatar  avatar  avatar  avatar  avatar  avatar  avatar  avatar  avatar  avatar  avatar  avatar  avatar  avatar  avatar  avatar  avatar  avatar  avatar  avatar  avatar  avatar  avatar  avatar  avatar  avatar  avatar  avatar  avatar  avatar  avatar  avatar  avatar

Watchers

 avatar  avatar  avatar  avatar  avatar  avatar  avatar  avatar  avatar  avatar  avatar  avatar  avatar  avatar  avatar  avatar  avatar  avatar  avatar  avatar  avatar  avatar  avatar  avatar  avatar  avatar  avatar  avatar  avatar  avatar  avatar  avatar  avatar  avatar  avatar  avatar  avatar  avatar  avatar  avatar  avatar  avatar  avatar  avatar  avatar  avatar  avatar  avatar  avatar  avatar  avatar  avatar  avatar  avatar  avatar  avatar  avatar  avatar  avatar  avatar  avatar  avatar  avatar  avatar  avatar  avatar  avatar  avatar  avatar  avatar  avatar  avatar  avatar  avatar  avatar  avatar  avatar  avatar  avatar  avatar  avatar  avatar  avatar  avatar  avatar  avatar  avatar  avatar

pyroscope's Issues

Make search functionality more obvious

Right now the search bar gets lost in all the colors on the page. Because the typical use case is that someone is using Pyroscope to dig into a particular file / function, we should change the color so that it stands out from the black background

image

.deb package - wrong file path

In the docs it is stated to install the Pyroscope server under Ubuntu with

wget https://dl.pyroscope.io/release/pyroscope_0.0.23_amd64.deb
sudo apt-get install pyroscope_0.0.23_amd64.deb

However, this raises an error on my machine

$ sudo apt-get install pyroscope_0.0.23_amd64.deb
Reading package lists... Done
Building dependency tree       
Reading state information... Done
E: Unable to locate package pyroscope_0.0.23_amd64.deb
E: Couldn't find any package by glob 'pyroscope_0.0.23_amd64.deb'
E: Couldn't find any package by regex 'pyroscope_0.0.23_amd64.deb'

Replacing sudo apt-get install pyroscope_0.0.23_amd64.deb with sudo apt-get install ./pyroscope_0.0.23_amd64.deb solves my problem.

Environment

$ cat /etc/os-release
NAME="Ubuntu"
VERSION="18.04.3 LTS (Bionic Beaver)"
ID=ubuntu
ID_LIKE=debian
PRETTY_NAME="Ubuntu 18.04.3 LTS"
VERSION_ID="18.04"
HOME_URL="https://www.ubuntu.com/"
SUPPORT_URL="https://help.ubuntu.com/"
BUG_REPORT_URL="https://bugs.launchpad.net/ubuntu/"
PRIVACY_POLICY_URL="https://www.ubuntu.com/legal/terms-and-policies/privacy-policy"
VERSION_CODENAME=bionic
UBUNTU_CODENAME=bionic

Add a way to export flamegraph (and table) as image or pdf

A lot of people have been asking for ways of how they can export the flamegraph data so that they can either save it or share it with other members of their org. We should add a button that allows users to export this data. Some things to consider:

  1. Data should be able to export to image
  2. Table also needs to be somehow converted to image
  3. Potentially both should be able to send as a PDF

This is also one of the first steps to be able to add alerts

write: broken pipe

Out of requests (on local), one request end up with write: broken pipe

ERRO[0263] Error happened when uploading a profile:Post "http://localhost:4040/ingest?from=1613035910&name=Verify+Rest&sampleRate=100&spyName=gospy&until=1613035920": write tcp 127.0.0.1:58206->127.0.0.1:4040: write: broken pipe

And another error:
ERRO[0453] Error happened when uploading a profile:Post "http://localhost:4040/ingest?from=1613036100&name=Verify+Rest&sampleRate=100&spyName=gospy&until=1613036110": EOF

Support Perl!

I'm in a conference with Ryan, where he's talking about Pyroscope and is encouraging this: Support Perl!

Add view to compare Flamegraphs from two time periods

While this has a lot of potential to add value, it's definitely a much trickier issue to tackle. Posting anyway as we may move towards trying to make this happen depending on if people feel this is necessary.

Currently a common use case for Pyroscope is:

A user has determined that part of their application or service is running slow or consuming too much CPU resources. So, they take the following steps:

  1. They look at Pyroscope "problem period" to pinpoint the file and function most responsible
  2. They fix / improve the speed of that function
  3. They look at a period post-fix to determine if their fix improved their CPU problem

Here is a picture that demonstrates this situation.

500x500_flame_graph_table

  • Before the fix, a function in B was taking up 75% of CPU resources while a function in C was taking up 25%
  • User fixed function in B
  • After the fix, B now uses 25% of CPU resources while C now takes up 75%

The most important part about this picture is the sum of the total CPU time at the bottom. With context i.e. if you are the dev who wrote these functions, fixed them, and are now reviewing the results, then you would know that your overall CPU resource consumption decrease (congrats!)

However, even without the context that B is the only place where changes were made, looking at the aggregate CPU time of the table on the left and comparing it with that of the table on the right

Date range selectors send too many requests

Currently when using the date range selectors, they send an API request every time they're updated. Instead there should be an "Apply" button that only sends one request once a user is done updating the date range.

Set up a way to get errors from rbspy / pyspy

Currently we have this setup where we include rust code as a static library with these bindings. All functions return error codes, but no error messages.

We need error messages.

I think the classic C way of doing this is:

  • return -1 from the functions
  • having some static char *errorMessage variable that is modified every time there's an error.

Maybe there are also better ways, I don't know.


This is a good issue if you're familiar with C / Rust programming.

Go application hang after starting pyroscope profiler

I'm trying to use pyroscope to profile JuiceFS.

But after adding the code snippet in main to start the profiler, the service doesn't work. When I do ls in the directory mounted by JuiceFS, it never returns.

The web UI looks like the following screenshot:

Screen Shot 2021-02-20 at 10 06 36 AM

Why agent cost half time in flame graph?

My environment:
macOS Bigsur
go1.13.1

When I add agent code in my go program, I found something strange.

image

pyroscope agent exactly cost half time

Maybe something went wrong or there is some knowledge I don't get?

Lint Go Code

Community Call To Action

Feel free to open PRs, even if it's one or two small fixes. This kind of work is important but often overlooked. This is a great way to learn more about the internals of the project and we'd appreciate any help on this.

Summary

We use revive as the main linter.

How to tackle these

Run the linter. It will print a bunch of issues in the code

make lint

Sample output:

pkg/util/serialization/metadata.go
  (17, 2)  https://revive.run/r#unhandled-error  Unhandled error in call to function w.Write  

pkg/storage/key.go
  (104, 4)  https://revive.run/r#unhandled-error       Unhandled error in call to function sb.WriteString               
  (36, 1)   https://revive.run/r#cyclomatic            function ParseKey has cyclomatic complexity 12                   
  (36, 1)   https://revive.run/r#cognitive-complexity  function ParseKey has cognitive complexity 12 (> max enabled 7)  

pkg/server/labels.go
  (19, 2)  https://revive.run/r#unhandled-error   Unhandled error in call to function w.Write                              
  (34, 2)  https://revive.run/r#unhandled-error   Unhandled error in call to function w.Write                              
  (8, 62)  https://revive.run/r#unused-parameter  parameter 'r' seems to be unused, consider removing or renaming it as _  

pkg/config/config.go
  (19, 18)  https://revive.run/r#struct-tag          malformed tag                                                         
  (80, 39)  https://revive.run/r#struct-tag          malformed tag                                                                       
  (85, 0)   https://revive.run/r#line-length-limit   line is 161 characters, out of limit 120   
...

Pick any of these and try to fix it. Some of them are trivial (e.g line length ones), and some require deeper understanding of the underlying code. If you have any questions, or if something doesn't work, reach out to me on our slack or open issues.

We also have instruction on how to set up VSCode to do the linting inside the editor: https://pyroscope.io/docs/developer-guide#go

Progress

At the time of writing (Jan 28th) we're at 224 problems (51 errors) (173 warnings)

Jan 31st โ€” 202 problems (51 errors) (151 warnings) Thanks to @Pranay0302!

Jun 9th โ€” 139 problems (30 errors) (109 warnings) Thanks to @AdrK !

Cover storage/segment with randomized tests

storage/segment is an implementation of a segment tree, somewhat similar to this wikipedia definition.

This allows us to very efficiently store and (arguably more importantly) query years of profiling data very quickly. The problem is that operations on this type of data structure are quite complex, and I already found multiple bugs while working on them (most recently this: 47ebbd9).

To give us some more confidence I think we should add some randomized tests where it would randomly "write" a bunch of data to a simple data structure (e.g just an array) and our segment tree. Then it would read the results from the simple data structure + from the segment tree and compare them.

This way we a) might be able to find more subtle bugs, b) prevent regressions

Make table format better horizontally

First column where the function names currently takes up all remaining width of table. This makes it hard to read because data is not close together.

Screen Shot 2021-01-18 at 1 21 09 PM

Add Legend to Tie Colors to package/filenames

As of right now, the colors in the Flamegraphs correspond to the package of the method in that node. For example:
image

In the highlighted section:

  • threading.py is orange
  • threadloop.py is green
  • base_events.py is blue

The colors are randomly selected from this array which should also have a larger list of colors so that its less likely where theres a situation where two different files randomly get assigned the same color

To make it so people are aware of logic of the coloring we need something that maps the colors to the file names they represent.

Add UI Indicator directing people to switch to view their own application

Currently the default in the "applcation" dropdown defaults to the pyroscope server itself. The reason for this is because even if you haven't started the agent for your particular application the pyroscope server will always have data as long as its running (see here).

image

A user unfamiliar with the UI will look at this profile and not necessarily know whats going on. They might not realize that they should select their own application from the dropdown like this:

image

When the UI opens and defaults to the Pyroscope server self-profile, we should add some kind of indicator that users should select their own application if the agent is running on that application. This would likely be one of the following:

  • Add "alert" text beside the selector instructing users to select their own app (if the page has just initialized and they haven't selected a new item in the dropdown yet
  • Highlight the selector dropdown until the user has clicked on

Ex:
image

Show number of invocations along with the time in the frontend

The frontend should show the total number of invocations of a function along with its total time in the charts. It is good to know that a function is taking 4s because it was called 20 times vs another function that was called 2 times and took 3s.

Move Date Range Picker to side of dropdown

Right now when using the date range picker it hides the "apply dates" button, which one needs to click in order to apply the new daterange.

Would be nice if the date range picker was over to the side so that someone using it will know that they need to go and apply the range in order for it to stick:

image

Clean up logging on go side

Currently it's a mess and mostly used for debugging. We should make it look nicer and be actually useful for people using pyroscope, not just developers.

As a part of this we should also add a logging option to the go integration.

Flamegraph: Code preview

Would be cool if a preview of the relevant code can be shown from the flamegraph.

  • Could have hovercard that shows function details
  • Could link to line in github, or perhaps even open in their code editor

Make table highlight corresponding items in flamegraph

Now that we've added a table we made it so that you can see exactly which functions are consuming resources:
image

In this case, lets say we wanted to dig into:
github.com/dgrapah-io/badger/v2.(*levelHandler).numTables

Right now you could type it into the search bar:
image

but it would be be better if you could also either hover or click the the item in the table and have the same functionality as the search bar of showing where that item is in the flamegraph

Add table with more detail about Flamegraph nodes

Right now, the flamegraph nodes get their hierarchy from the stacktrace and they get their size from the number of samples collected while the application was working on that function.

Since we also know the sample rate:

  • we should show this data as time in addition to the number of samples.
  • we should show this in table form to allow for sorting

The purpose of this is to make it easier to quickly find the functions that are using the most cpu resources... Here is a sketch of what this could look like:

cropped_flame_graph

This type of view would offer two benefits:

  • Allow for people to see how much aggregate cpu time was spent in each function
  • Give more clarity as to which filenames correspond to which colors as mentioned in #14

Memory leak detection

Hi,

pyroscope looks awesome! I am looking forward to use it to monitor / profile our server application.

I was wondering if pyroscope can also measure memory usage, and help debug memory leaks? Is that in scope / on the roadmap?
Just curious, and feel free to close the issue.

Make a program that would generate an example config file

Someone else brought it up, but I don't remember where, so I apologize in advance for lack of proper attribution.

Summary

We have a config struct for the server, located here, it looks like this:

type Server struct {
	LogLevel       string `def:"info", desc:"debug|info|warn|error"`
	BadgerLogLevel string `def:"error", desc:"debug|info|warn|error"`
	StoragePath string `def:"<installPrefix>/var/lib/pyroscope" desc:"directory where pyroscope stores profiling data"`
	ApiBindAddr string `def:":4040" desc:"port for the HTTP server used for data ingestion and web UI"`
...

It would be cool to write a script that would take this struct and generate a self-documented sample config file, for example:

---
# debug|info|warn|error
log-level: "info"

# debug|info|warn|error
badger-log-level: "error"

# directory where pyroscope stores profiling data
storage-path: "/var/lib/pyroscope"

# port for the HTTP server used for data ingestion and web UI
api-bind-addr: ":4040"
...

More Details

We have this code here that turns a struct into a flagSet. Flag sets are much easier to work with. There's also this DefaultUsageFunc function (link) that takes a flagSet and prints usage info from it. So basically for this issue we could have a function that does more or less the same thing but generates a self documented yaml file.

TODO:

  • write a go program that would turn a struct into a self documented yaml, it's gonna be pretty simple so I think we can put it into scripts/packages/<some name>.go and then run it via go run: go run scripts/packages/<some name>.go
  • make a job in Makefile that would run it and update scripts/packages/server.yml file

Later we'll also put it somewhere on our docs website.

Add a Ability to Go back to previous Timerange

Multiple people either explicitly mentioned this or had a hard time figuring out how to zoom out. I think we should just have a zoom out button.

Default View on page load:
image

"Zoomed view" when a yellow bar in the timeline is selected:
image

We need a button that allows you to go back to the initial default view. Since URL params change this may be addressable using those as well.

"Failed to open process - check if it is running" error with Python on macOS

Community Call To Action

If you've experienced this, please post some details about your setup, e.g macOS version, python version, how you installed python on your machine, where it's installed, if you use pipenv / virtualenv or not in this issue.

Summary

Some people report getting a message like this when they run pyroscope exec on macOS with python apps:

Failed to open process - check if it is running

Simplest way to reproduce:

sudo pyroscope exec -log-level debug python -c 'import time; time.sleep(10)'

Context

Behind the scenes we're using this awesome piece of software called py-spy. There are some limitations that are described in the README of that project, e.g here. For example, it straight up doesn't work with python that comes with macOS. Some of our users are reporting that sometimes it doesn't work even with python that's not preinstalled.

Relevant py-spy issues

TODO:

  • collect more feedback from the community, try to understand all the cases when this happens
  • figure out how we can address some of these issues
  • for cases that we can fix we should develop solutions and also try to push them upstream where applicable
  • for cases that we can not fix / control for (e.g system integrity protection on macOS) add detection mechanisms and explicit messages in our software so that people don't waste time debugging this.

Add crosshair to mouse when hovering timeline

Currently there is functionality that you can click and drag on the timeline at the top to inspect a particular timeline on it more closely.

However, when many go to this timeline they don't realize that they are able to interact with it with that functionality. Would be cool to add a different colored vertical line when hovering over the timeline.

Something like this red line that follows your mouse when its hovering:
image

Update button falls to next row when date range picker is open

When the date range picker is open, the "update" button drops to the next row. Instead it should stay in the same spot that its in in the picture on the left

Screen Shot 2021-02-01 at 4 40 52 PM

We should also add a label "From" for the top one and "To" for the bottom one so that people know that those correspond with the dates they're selecting

image

Make "Reset View" button stand out when a node is being inspected

Here is a gif showing what a lot of users do when they come in and click on a node
2021-02-24 16 16 47

Situation 1:

  1. The click a node to zoom in on it
  2. They try to click the node a second time to zoom out from it... But nothing happens when re-click a node

This problem can be fixed, but making the behavior such that:

  • When a user clicks on a node that is currently in focus, then that resets the view to normal (similar to clicking the "reset view" button)

Situation 2:

  1. They click a node to zoom in on it
  2. They want to zoom back out, but they don't know how (and they don't see the button that appears)

This was the original motivation for this issue. This problem can be fixed by:

  • Moving the "reset view" button next to the controls on the right side of the panel
  • Making the "reset view" button more visible ... (i.e. changing the color of its border, changing its background color, etc -- we'd want it to be more visible, but also not distracting)

image

  • When a user clicks on a node that is currently in focus, then that resets the view to normal (similar to clicking the "reset view" button)
  • Moving the "reset view" button next to the controls on the right side of the panel
  • Making the "reset view" button more visible ... (i.e. changing the color of its border, changing its background color, etc -- we'd want it to be more visible, but also not distracting)

Add "color by" dropdown

Currently we determine a nodes color based off of the file it came from. As we start to add more metrics to this page, we may want to start coloring nodes off of other things. Some examples include:

  • a monochrome color that varies in intensity/brightness based off of self time
  • a monochrome color that varies in intensity/brightness based off of total time
  • coloring for libraries vs user code (i.e. pandas or numpy would be a different color than code someone wrote)

And while this wouldn't be part of the dropdown, worth noting that eventually we hope to add:

  • coloring for a diff

While we aren't looking to implement all of these at once, just having the ability to switch coloring methods based off a dropdown is the first step.

Alert user with text if startDate > endDate

We have a new DatePicker dropdown, but now its easier to accidentally choose an endDate that is smaller than startDate. When state.startDate > state.endDate then we should add some red text to the bottom to alert the user that they have an invalid date range.

This way they will not accidentally wait for the data to update for an invalid date range.

Screen Shot 2021-01-30 at 4 54 22 PM

DRY actions for leftFrom, leftUntil, rightFrom, and rightUntil

In PR #90 I introduced the ability to set three different timelines:

  1. The main timeline at that top. this happens on both the "single view" page and the "comparison" page
  2. The left timeline -- this only happens on the comparison page (where there are two timelines / flamegraphs)
  3. the right timeline -- this only happens on the comparison page ( where there are two timelines / flamegraphs)

In order to update these all independently from each other I created a separate action for each of them. They could probably be merged into one since they are doing essentially the same thing:

https://github.com/pyroscope-io/pyroscope/blob/main/webapp/javascript/redux/actions.js#L22-L56

Recommend Projects

  • React photo React

    A declarative, efficient, and flexible JavaScript library for building user interfaces.

  • Vue.js photo Vue.js

    ๐Ÿ–– Vue.js is a progressive, incrementally-adoptable JavaScript framework for building UI on the web.

  • Typescript photo Typescript

    TypeScript is a superset of JavaScript that compiles to clean JavaScript output.

  • TensorFlow photo TensorFlow

    An Open Source Machine Learning Framework for Everyone

  • Django photo Django

    The Web framework for perfectionists with deadlines.

  • D3 photo D3

    Bring data to life with SVG, Canvas and HTML. ๐Ÿ“Š๐Ÿ“ˆ๐ŸŽ‰

Recommend Topics

  • javascript

    JavaScript (JS) is a lightweight interpreted programming language with first-class functions.

  • web

    Some thing interesting about web. New door for the world.

  • server

    A server is a program made to process requests and deliver data to clients.

  • Machine learning

    Machine learning is a way of modeling and interpreting data that allows a piece of software to respond intelligently.

  • Game

    Some thing interesting about game, make everyone happy.

Recommend Org

  • Facebook photo Facebook

    We are working to build community through open source technology. NB: members must have two-factor auth.

  • Microsoft photo Microsoft

    Open source projects and samples from Microsoft.

  • Google photo Google

    Google โค๏ธ Open Source for everyone.

  • D3 photo D3

    Data-Driven Documents codes.