MorphL is an AI platform for e-commerce companies which in essence consists of a suite of machine learning models that are platform agnostic, that can be used across the customer journey and, of course, across the organization. One of these models offers online retailers the ability to optimize their budget allocation across multiple channels with the end goal of maximizing their revenues.
During COVID-19 crisis and in the spirit of #givefirst we decided to open-source the “E-commerce Budget Optimization” model and offer it for FREE to online retailers out there.
This initiative consists of the following activities/resources:
-
A series of live AI & ML webinars taking place every Monday at 1PM (GMT+2): https://www.crowdcast.io/e/Ecommerce-Marketing-Spend-Optimization
-
Kickoff Meeting Presentation: https://bit.ly/budget-optimization-kickoff
-
Google Analytics Custom Report: https://bit.ly/ga-bo-report
-
Slack invite: https://bit.ly/morphl-slack-invite
The business problem can be expressed in the following manner: given a total budget B, calculate the optimum monthly budget allocation {B1, ..., B12} across multiple channels (and potentially campaigns {C1, ..., Cn}) in order to maximize revenue R.
Here's a very basic Marketing Budget Allocation Planning that assumes Year to Date (YTD) average Cost-per-Click (CPC), Conversion Rate (CVR) and Average Order Value (AOV) for each channel.
While the task is to optimize the budget allocation between multiple channels & campaigns, some of them are "inner" optimizable (Google Ads, Facebook Ads), others are out of reach: E-mail, SEO, etc. There are multiple "problems" at once that are embedded in this "budget allocation" term and we’ll try to provide a direction to solving the problem using the campaigns as black-boxes, making use only of the cost and the revenue produced.
First of all, in the perfect scenario, where we got a set of Campaigns {C1, ..., Cn} with a perfectly explainable function Budget(i) → Revenue(i), for i ∈ Campaigns, the task is trivial to solve. However, campaigns are most likely not a linear function of Budget, meaning that investing too little or too much would cause non-linearities.
The main issue here is that there are some hard assumptions about the Projected Revenues, which are probably hand picked. We’ve got a small time series and we can know for each day (Google Ads Daily/Facebook Ads Daily) and month how much we invested and how much revenue we've got.
We can, thus, predict how much the daily/monthly revenue we'll have, given the historical data. This will automatically give a model where we can predict for each campaign and given budget an estimated revenue return.
Another observable fact is that picking the weights for all campaigns relatively close to each other {0.2857, 0.3174, 0.3968}, meaning putting all eggs in one basket (best performing one), is wrong. We could alter the weights to be close to each other using a regularization technique, while also allowing favouring the best performing one.
Thus, the task is divided into 2 parts. • Computing a model (B → Rev) for each Campaign • Compute a optimal budget allocation, given the models for each Campaign
We can build a daily and a monthly model (and probably any other interval we desire, but for simplicity let’s keep only these). This is the simplest model, where each campaign (C) is a black box. We’re trying to define the dependency between the allocated budget (B), and the historical data of this campaign, to predict the revenue of the campaign.
RevC (ti) = P(B|RevC (t0), . . . RevC (ti−1))
How we model this is irrelevant (RNN, HMM or even a linear model). Once we have it, we can, in theory make a Rev = f(B) estimation for each campaign.
For the task of computing a model for each Campaign, we can use:
-
Monthly aggregated data. This is the easiest case, however I propose this as the baseline solution
-
Daily data. Use the daily data to model the time series, which should show some improvements over the baseline solution.
Once we have a model for each campaign, we can solve the problem of picking the optimal budget allocation. The revenue plots for each campaign could look like this:
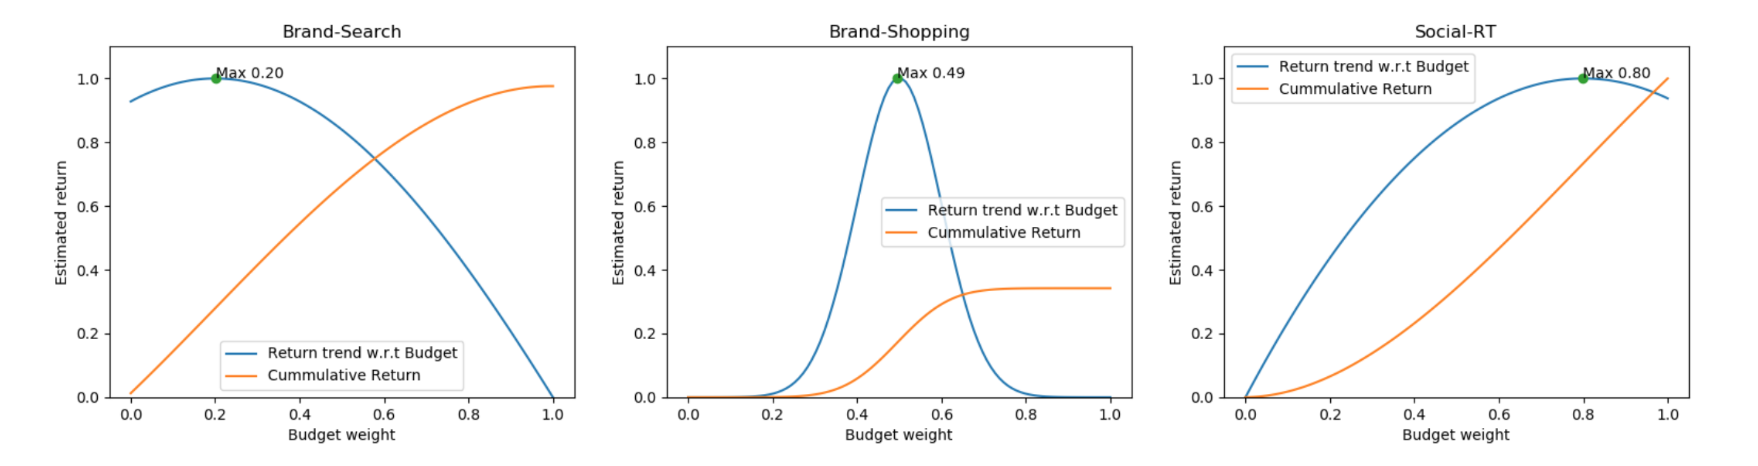
The yellow line represents the cumulative sum (return/revenue) given the budget. Clearly, this is a monotonically increasing function (we get more money as we pour more money, however potentially sub optimal). The blue line is the relation between the budget and the returning sum. This tells us how much we should optimally invest in each campaign, thus we can infer how much we should allocate for each marketing channel, resulting in the optimal solution.
We observe that even for dummy data, once we make the models non-linear, the global optimum varies greatly. We thus propose a solution based on various non convex continuous optimization algorithms, such as genetic algorithms and colony optimization.


