This project creates a templating system for the creation of 3D data visualization. These templates will allow users to supply their data in various formats and then choose a template for visualizing that data.
Current templates include:
- Regional ( country heatmap )
- Location & Realtime( longitude/latitude points mapping )
- Relationship ( relationship map )
- Pointcloud ( x, y, z map )
We will be adding more templates in the near future to include the ability to add time information and point clouds.
Currently we expect each data record to be in one row of spreadsheet or csv.
To use our visualization tool, simply start by choosing the data source. Next, choose the template and match up the required fields with how you organize your data. The tool will pick up the first line in your file. Simply let the tool know what each value means by clicking on your value and then the matching parser attribute.
Hit the visualize button and you're done!
Here is the link of our appilcation. http://seneca-cdot.github.io/3DataViz/
If you do not know how to use the app, please read this Instruction.
What we have built so far is an application prototype that consists of mainly these.
- Architecture
- Data Processor ( Client )
- Visualization Templates ( Client )
- APIs ( Server )
Here is the diagram of our application architecture.
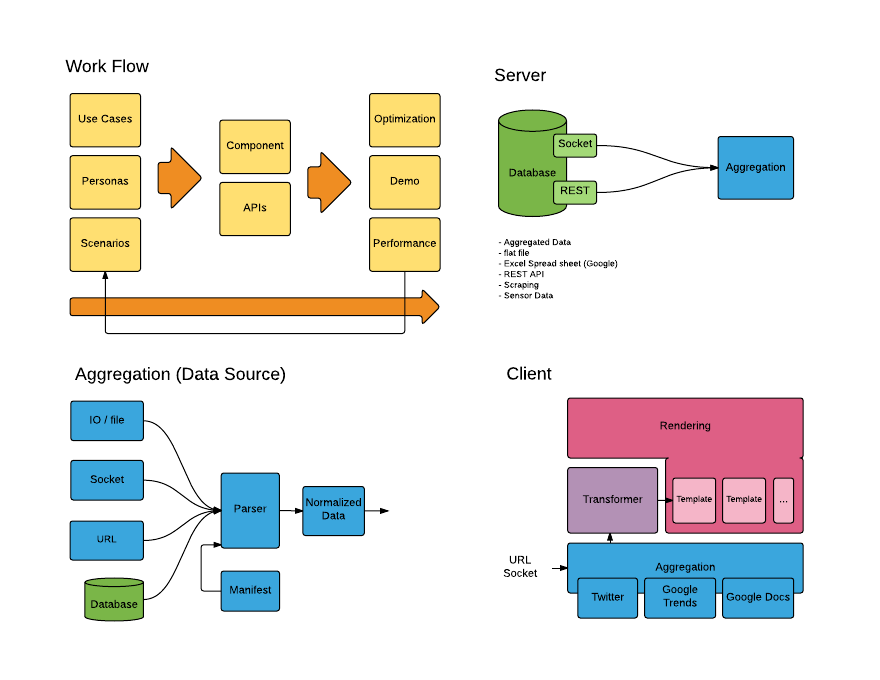
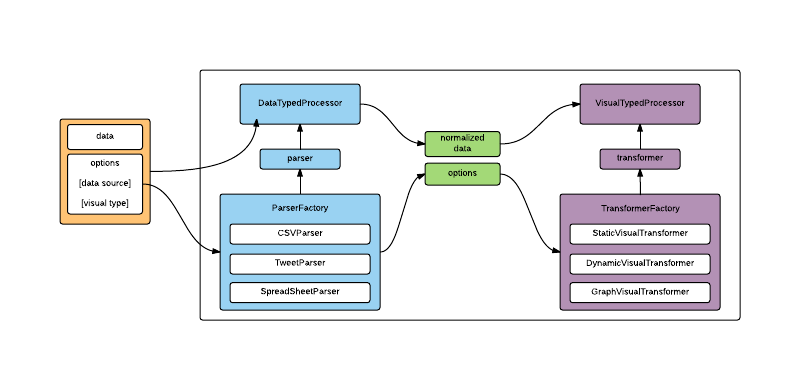
Data processor is one of the most important part of our project. There are two main modules within the data processor. One is parser and the other one is transformer.
When the parser receives data and its data type, the parser will choose suitable functions to parse it. Then, the parser will output normalized data and pass it to the transformer.
The transformer will transform the normalized data in the format that specific visualization template can understand and visualize the data.
There are currently four different types of visualization templates in our application.
- Countries - This template colourizes top 10 countries from the data given.
- Points - This template plots images onto the globe. Each image represents the location where each data occurs.
- Dynamic - This template shows a sparkle object above the globe. Each sparkle represents the location where each data occurs. Data will be given dynamically.
- Flight path - This template will visualize a flight path from departure to destination.
There are currently two APIs that we provide from server side.
- Twitter data which aggregated in DB - We collected tweets for WWDC2015 and save them to our database. We provide an REST API to retrieve those data to visualize.
- Live tweets from Twitter - This API provides web socket connection that delivers live tweets from Twitter Streaming API.
If you have any feedbacks for our project or any other use cases that you would like to achieve using our application, Please let us know.


