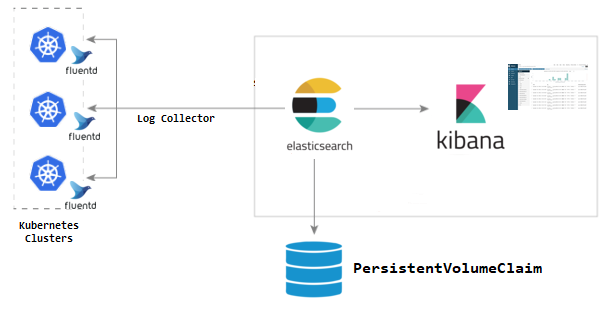
When running multiple services and applications on a Kubernetes cluster, a centralized, cluster-level logging stack can help you quickly sort through and analyze the heavy volume of log data produced by your Pods. One popular centralized logging solution is the Elasticsearch, Fluentd, and Kibana (EFK) stack and for application monitoring APM server can deploy, this project is complete solution for centralized logging.
- Knowledge of Kubernetes and its object types like StatefulSets, DaemonSet, PersistentVolumes & init container.
- Basic knowledge of Elasticsearch, Fluentd & Kibana.
- Basic knowledge of Elasticsearch Node types and their roles (Master, Data & client nodes).
- An existing Kubernetes cluster with a minimum of two nodes.
These instructions will get you a centralized logging for your kubernetes cluster and APM server for application performance metrics
kubectl create ns infra
The first node of the cluster we’re going to set up is the master which is responsible for controlling the cluster.
kubectl apply -f elasticsearch-master-configmap.yaml -f elasticsearch-master-service.yaml -f elasticsearch-master-deployment.yaml
kubectl get pods -n efk-xpack
output
elasticsearch-master-cd84d8dcb-s76p6 1/1 Running 0 3h36m
The second node of the cluster we’re going to set up is the data node that is responsible for hosting the data and executing the queries (CRUD, search, aggregation).
kubectl apply -f elasticsearch-data-configmap.yaml -f elasticsearch-data-service.yaml -f elasticsearch-data-statefulset.yaml
kubectl get pods -n efk-xpack
output
elasticsearch-data-0                     1/1     Running   0          3h20m
elasticsearch-data-1                     1/1     Running   0          153m
elasticsearch-data-2                     1/1     Running   0          152m
elasticsearch-master-cd84d8dcb-s76p6     1/1     Running   0          3h36m
The client is responsible for exposing an HTTP interface and pass queries to the data node.
kubectl apply -f elasticsearch-client-configmap.yaml -f elasticsearch-client-service.yaml -f elasticsearch-client-deployment.yaml
kubectl get pods -n efk-xpack
output
elasticsearch-client-d59f4b6f6-5b2rj     1/1     Running   0          3h15m
elasticsearch-client-d59f4b6f6-9zkj6     1/1     Running   0          161m
elasticsearch-client-d59f4b6f6-k9t7q     1/1     Running   0          161m
elasticsearch-data-0                     1/1     Running   0          3h20m
elasticsearch-data-1                     1/1     Running   0          153m
elasticsearch-data-2                     1/1     Running   0          152m
elasticsearch-master-cd84d8dcb-s76p6     1/1     Running   0          3h36m
We have enabled the xpack security module to secure the cluster, now execute the command to initialize the passwords: bin/elasticsearch-setup-passwords within the client node container (any node would work) to generate default users and passwords.
kubectl exec -it $(kubectl get pods -n efk-xpack | grep elasticsearch-client | sed -n 1p | awk '{print $1}') -n efk-xpack -- bin/elasticsearch-setup-passwords auto -b
kubectl create secret generic elasticsearch-pw-elastic -n efk-xpack --from-literal password=5xxxxxxxxxxxxxxxx
- Create a configmap, service and Deployment for kibana
kubectl apply -f kibana-configmap.yaml -f kibana-service.yaml -f kibana-deployment.yaml
- Check the loadbancer IP for kibana
kubectl get svc -n efk-xpack
output:-
kibana LoadBalancer 10.128.151.134 172.105.46.123 80:32087/TCP 3h24m

kubectl apply -f fluentd-config-map.yaml -f fluentd-daemonset.yaml
- Go to apm-server and change values.yaml as per your requirement
output.elasticsearch:
      hosts: ["http://elasticsearch-client.infra.svc.cluster.local:9200"]
      ## If you have security enabled- you'll need to add the credentials
      ## as environment variables
      username: "${ELASTICSEARCH_USERNAME}"
      password: "${ELASTICSEARCH_PASSWORD}"
      ## If SSL is enabled
      # protocol: https
      # ssl.certificate_authorities:
      #  - /usr/share/apm-server/config/certs/elastic-ca.pem

      extraEnvs:
        - name: 'ELASTICSEARCH_USERNAME'
          value: elastic
        - name: 'ELASTICSEARCH_PASSWORD'
          valueFrom:
            secretKeyRef:
              name: elasticsearch-pw-elastic
              key: password
-
Deploy the helm charts
- Add helm repo
helm repo add elastic https://helm.elastic.co- Deploy apm server using helm
helm install apm-server elastic/apm-server -f values.yaml


