Last 10 year Cricket match Analysis for Top 5 ranked Teams
Sports data is high-dimensional data with multiple magnitudes. Exploring and extracting information from it is interesting, challenging, and of high demand. Adequate visualization techniques are needed to represent these data and to tell a story precisely. In this paper, we are trying to understand the characteristics of sports data using one-day international men’s cricket data and finding out the best visualizations used for analyzing the data. The research is focused on finding the factors affecting a team's victory using visualization techniques. In the background study, we have examined various papers from the generic visualization domain, sports domain, and cricket data visualization reports. All different aspects of this information are combined and used for the whole research. First, we identified major features from cricket match data and analyzed them using various techniques like regression. With the help of previous papers, applied different visualization techniques used in the field such as heat maps, scatter plots, multiple stacked bar plots, and line charts. Combined more features in the visuals and tried detailed visualizations of the area of interest to do a deep analysis. After creating visuals, the usability evaluation is done using a group of 10 people and made improvements based on feedback. Web scraping is used for data collection and Spotfire is the visualization tool used for the study.
This study is an attempt to understand the factors affecting the success rate of a team. Team victory is determined by several factors, including the teams’ strong areas, weather, toss, players’ rating, and so on. We are exploring a team’s success rate and its dependency on the above-mentioned features to determine various factors such as a safe score to achieve a win, winning patterns of different teams, individual contribution towards the overall team performance and other factors. Research Questions Case 1:
- What is a typical safe score for a team to win?
- What is the winning pattern of a team? Chasing the score or batting first? Case 2:
- Is there any positive relation between playing in home ground and match win for top 5 teams?
- Is there any positive relation between toss win and match win for top 5 teams?
- What are the changing trends over the last 5 years when considering the team's performance, run rate, total score? Does the success rate depend on team rank, run rates?
The cricket data required various cleaning, grouping, and transformations before the implementation of the visualization model. The ESPNcricinfo website collects and arranges data of every match on their stats page. This develops time- series data for each team with attributes such as match result, ground, team's run rates. Wikipedia pages were used to collect the team ranks over years. There were other data sources too that we tried to extract data from initially. While ESPNcricinfo pages have the feature to filter and group data by team, opposition, year, and results. This we found to be more structured to meet our requirements and include features to answer our research questions. However, the data is available in webpages in HTML format, so we developed a custom web scraping script in NodeJS using cheerio, a tool for parsing HTML and XML in NodeJS and fetched the last 10 years' data for the matches played among top- performing teams. The data obtained was in JSON format and converted into CSV using online tool https://www.convertcsv.com/json-to-csv.htm.
For the first case, to find a safe score, I have used the scatterplot visual with year and score in x and y-axis respectively. Color is chosen as the tool to distinguish match results and various teams are shown using different shapes. The scatter plot is chosen because there are a limited number of points to show, and it can adapt by adding 4 features to show simultaneously for this case.
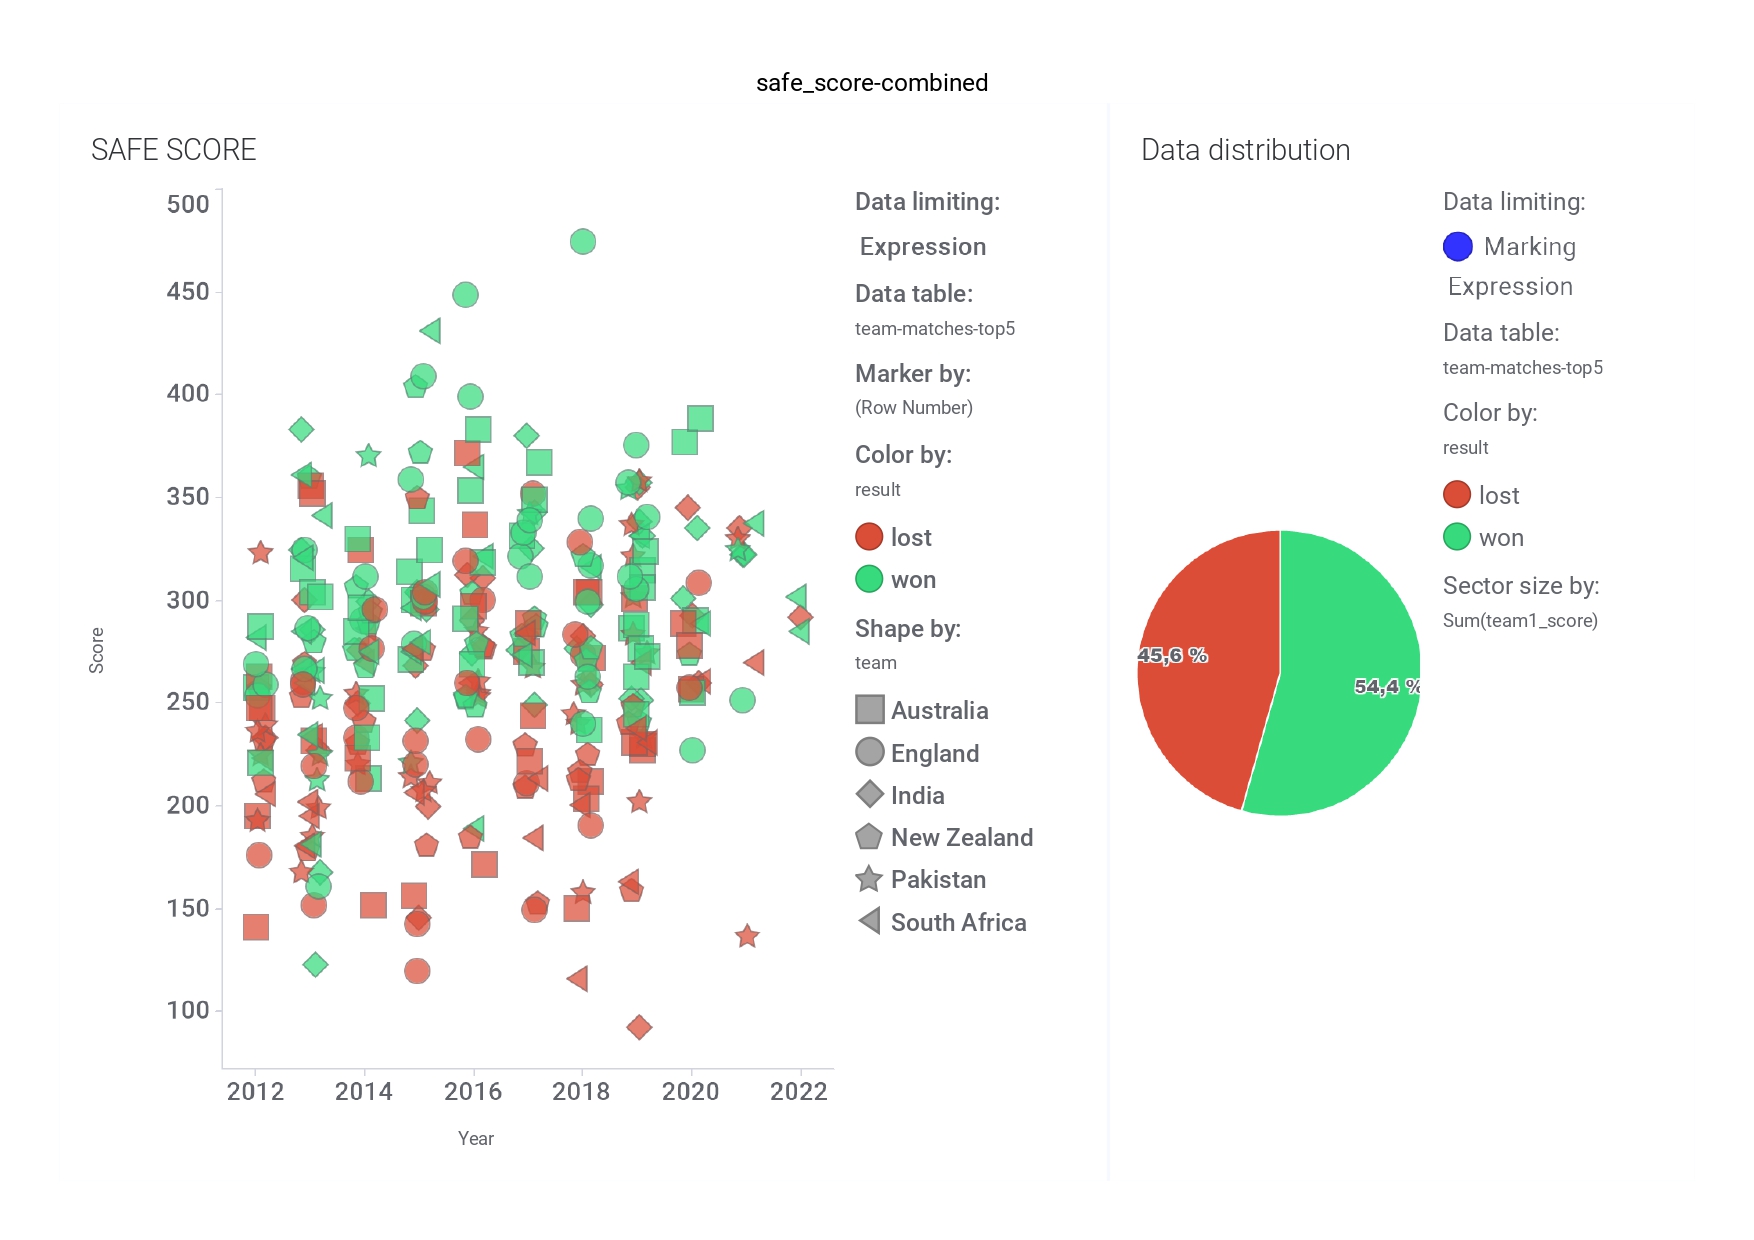
Plot to analyze safe score to win. Right part shows the win-loss distribution in data.
The left part of Figure 2 shows the features mentioned and the right side shows result data distribution. The result data distribution is balanced with 45.6% of lost and 54.4% of win matches and hence there is no evident bias in the data and can rely on it for further analysis.
The scatterplot shows a pattern of green-colored clusters forming towards the top part and a red cluster towards the bottom. Examine the area of interest by selecting the part in the visual for deeper examination. The uppermost area with all green points is selected and detailed in Figure 3. It shows that if the score is above 372 the winning chance of a team is 100%. But a typical score to win need not be expecting a 100% win but a higher chance of victory. Moreover, the score 372 which is the lowest score for 100% victory can change as new matches are played. So, that may not be a valid approach to locate a typical safe score. Instead, by describing the upper area of the chart where there are more wins, it can be found that a score above 300 gives 75.1% wins and 24.9% loss and that gives more understanding.
Regarding the visual elements in the plot, green is used for showing wins and red for losses, which is a general standard followed. The shapes represent different teams and can be used to inspect if any team is developing interesting patterns. This will also show a divergence in data points.
The second case deals with finding the winning pattern for teams. There are 2 possible types of victory for a team, either by scoring high runs so that the opponent cannot reach the score or by chasing in which the team scores more runs than the set target by an opponent. Side-by-side bar charts are the easiest and most popular ones to represent such a scenario to compare two different classes. The team and the opposition teams are grouped in the x-axis and the number of wins in the y-axis. Different colors are used to identify the win type. Tried several different ways to effectively plot this case. At first, I created a single bar chart with all team and opposition groups as shown in figure 5. But it is chaotic and difficult to analyze with the information explosion.

In the next chart, the groups were separated into different charts and shown on a single page to reduce the complexity. The complexity is reduced, and multiple teams can be compared, but it is fully occupied and cannot accommodate any more teams and hence not scalable.

To solve the above issue, an interactive filtering technique is tested as shown in following figure. The team name attribute is used for the filter. Though the complexity and the scalability are addressed, the advantage of comparing different teams simultaneously is lost in this case.

To extract information using all attributes by addressing above mentioned complexities bar charts may not be sufficient. A heat map is used as the next step as in following figure.

From this heatmap, it is observed that some teams have consistently had a pattern of winning with all oppositions. The Australian team has won more matches by scoring a high total. Similarly, England has an advantage in winning with chasing. Winning patterns depend on various factors such as the toss, the decision that teams take, and the ground circumstances such as batting friendly or bowling friendly grounds or pitches. The observed pattern for Australia and England is further analyzed by combining these other factors to get more in-depth insights. The outcome of this deeper study is discussed in the results section. Regarding the visual elements in the plot, the gradient of orange color is used for showing the number of wins. This plot needs to represent all teams' winning counts together for comparison. So a color that is different from team colors is selected to avoid any potential preconception.
Since Australia has a consistent winning pattern with high score and England in both forms but with more numbers in chasing. For a deeper analysis, other factors were also combined and found that for Australia the greatest number of high score wins are from their home regions and grounds.
For the visualizing this, Tree map is used to show the region wise grounds and a horizontal bar chart is used for showing the matches count in different grounds and color is used to identify the region. See the following figure for details.

While analyzing the trend, it is seen that most of the team have drops in their attributes in the last 2 years. This could be because of the lesser number of matches played after the covid period. Following figure shows the drop with Indian teams attributes.

Nielsen’s Usability Heuristics, user feedbacks were studied.
Programming Language: Python, NodeJs
Visualisation tool: Spotfire
Other tools: Google sheet

