

This panel plugin provides a D3-based multistat panel for Grafana 7.3+.
A hexagon is created for each metric received, with the ability to group metrics into a composite metric, and display the triggered state of the composite.
This plugin supports autoscaling for best-fit sizing of each polygon to the panel size. When the complete text cannot be displayed, only tooltips are active.


Specify the desired number of columns and rows, or select Autosize to allow the plugin to calculate a "best fit" for the size of the panel.
Max # of columns to create
Max # rows to create NOTE: if both columns and rows are set, only rows*columns will be displayed, generally one or none should be set.
Set a limit on number of hexagons to be displayed, set to 0 for no limit.

Set the size of the polygon to a fixed size, or select auto-size for "best fit".


Set the font to be used for Tooltips

Show all Show triggered

This field allows you to specify a regular expression to pick a portion of matching metric names to be rendered instead of the full name.
If you have these 3 Queries, returning a series: Foo-A, values 1,2,3 Bar-B, values 4,5,6 Misc, values 7,8,9
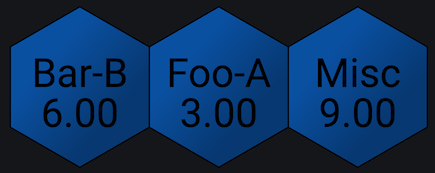
Adding the regular expression: /(Foo|Bar)/, will display:
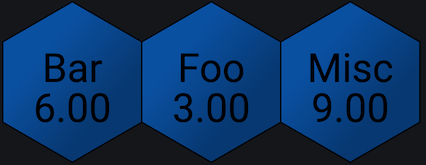
Specify a regular expression to pick a portion of matching metric names.
Click through to use when none are defined for a hexagon.
Display the metric in the hexagon
Display the metric value


Animate hexagon to display metrics if there are composites

Speed of animation in milliseconds
This plugin supports "ranged" states.
Thresholds are expected to be sorted by ascending value, where
T0 = lowest decimal value, any state
TN = highest decimal value, any state
Initial state is set to "ok"
A comparison is made using "greater than or equal to" against the value
If value >= thresholdValue state = X
Comparisons are made in reverse order, using the range between the Nth (inclusive) threshold and N+1 (exclusive)
  InclusiveValue = T(n).value
  ExclusiveValue = T(n+1).value
When there is no n+1 threshold, the highest value threshold T(n), a simple inclusive >= comparison is made
Example 1: (typical linear)
    T0 - 5, ok
    T1 - 10, warning
    T2 - 20, critical
  Value >= 20 (Value >= T2)
  10 <= Value < 20  (T1 <= Value < T2)
  5 <= Value < 10   (T0 <= Value < T1)
Example 2: (reverse linear)
    T0 - 50, critical
    T1 - 90, warning
    T2 - 100, ok
  Value >= 100
  90 <= value < 100
  50 <= value < 90
Example 3: (bounded)
    T0 - 50, critical
    T1 - 60, warning
    T2 - 70, ok
    T3 - 80, warning
    T4 - 90, critical
    Value >= 90
    80 <= Value < 90
    70 <= Value < 80
    60 <= Value < 70
    50 <= Value < 60
The "worst" state is returned after checking every threshold range
Hovering over a hexagon shows the metrics that comprise the displayed state. For composites this will expand members of the composite.

This shows creation of composites, where you select which metrics comprise the composite.

This shows composites configured for GPU 0,1,2,3, and non-grouped metrics from GPU4-7.

Template variables are available in the clickThroughUrl setting, specified by using ${varname}. They can also be passed to another dashboard by appending var-VARNAME=value to the url
/dashboard/xyz?var-VARNAME=${VARNAME}Overrides using regular expressions with capture groups provide addition variables that can be referenced in a clickthroughUrl.
Example:
Regular Expression: /TEMP_(?<A_HOST>.*)_/
Clickthrough URL: /grafana/d/eCLHPr57k/drilldown?orgId=1&var-host=${A_HOST}
The above example will expand the capture named group A_HOST and replace the value in the specified URL.
Each polygon represents either a single metric, or a composite metric
An example drilldown clickthrough url can be specified like this:
dashboard/db/drilldown?var-HOSTNAME=${__cell_name}NOTE: Metrics are sorted using the global options "Sorting" settings. Global filters are also applied before dereferencing is performed.
The name and value of a polygon can be referenced using the following syntax:
- Metric Name:
${__cell_name} - Metric Value:
${__cell} - Metric Raw Value:
${__cell:raw}syntax. By default values are URI encoded. Use this syntax to disable encoding
The names and values of a composite polygon can be referenced using the following syntax:
- Composite Name:
${__composite_name} - Metric Name:
${__cell_name_n} - Metric Value:
${__cell_n} - Metric Raw Value:
${__cell_n:raw}syntax. By default values are URI encoded. Use this syntax to disable encoding
This plugin relies on @grafana/toolkit, typical build sequence:
yarn install
yarn build
For development, you can run:
yarn watchThe code will be parsed then copied into "dist" if "jslint" passes without errors.
A docker-compose.yml file is include for easy development and testing, just run
docker-compose upThen browse to http://localhost:3000
- Grafana 7.3+
Grafana TestData is not enabled by default. To enable it, first navigate to the Plugins section, found in your Grafana main menu. Click the Apps tabs in the Plugins section and select the Grafana TestData App. (Or navigate to http://your_grafana_instance/plugins/testdata/edit to go directly there). Finally click the enable button to enable.
This panel is based on this D3 example:
Many thanks to contributors:
- Mathieu Rollet (matletix)
- Mattias Jiderhamn (mjiderhamn)
- AnushaBoggarapu
- KamalakarGoretta
- Rene Hennig (renehennig)
- Hamza Ziyani (HZiyani)
and many others!


![dependabot[bot] avatar](https://avatars.githubusercontent.com/in/29110?v=4 "dependabot[bot]")


