Immersive Graph Visualization
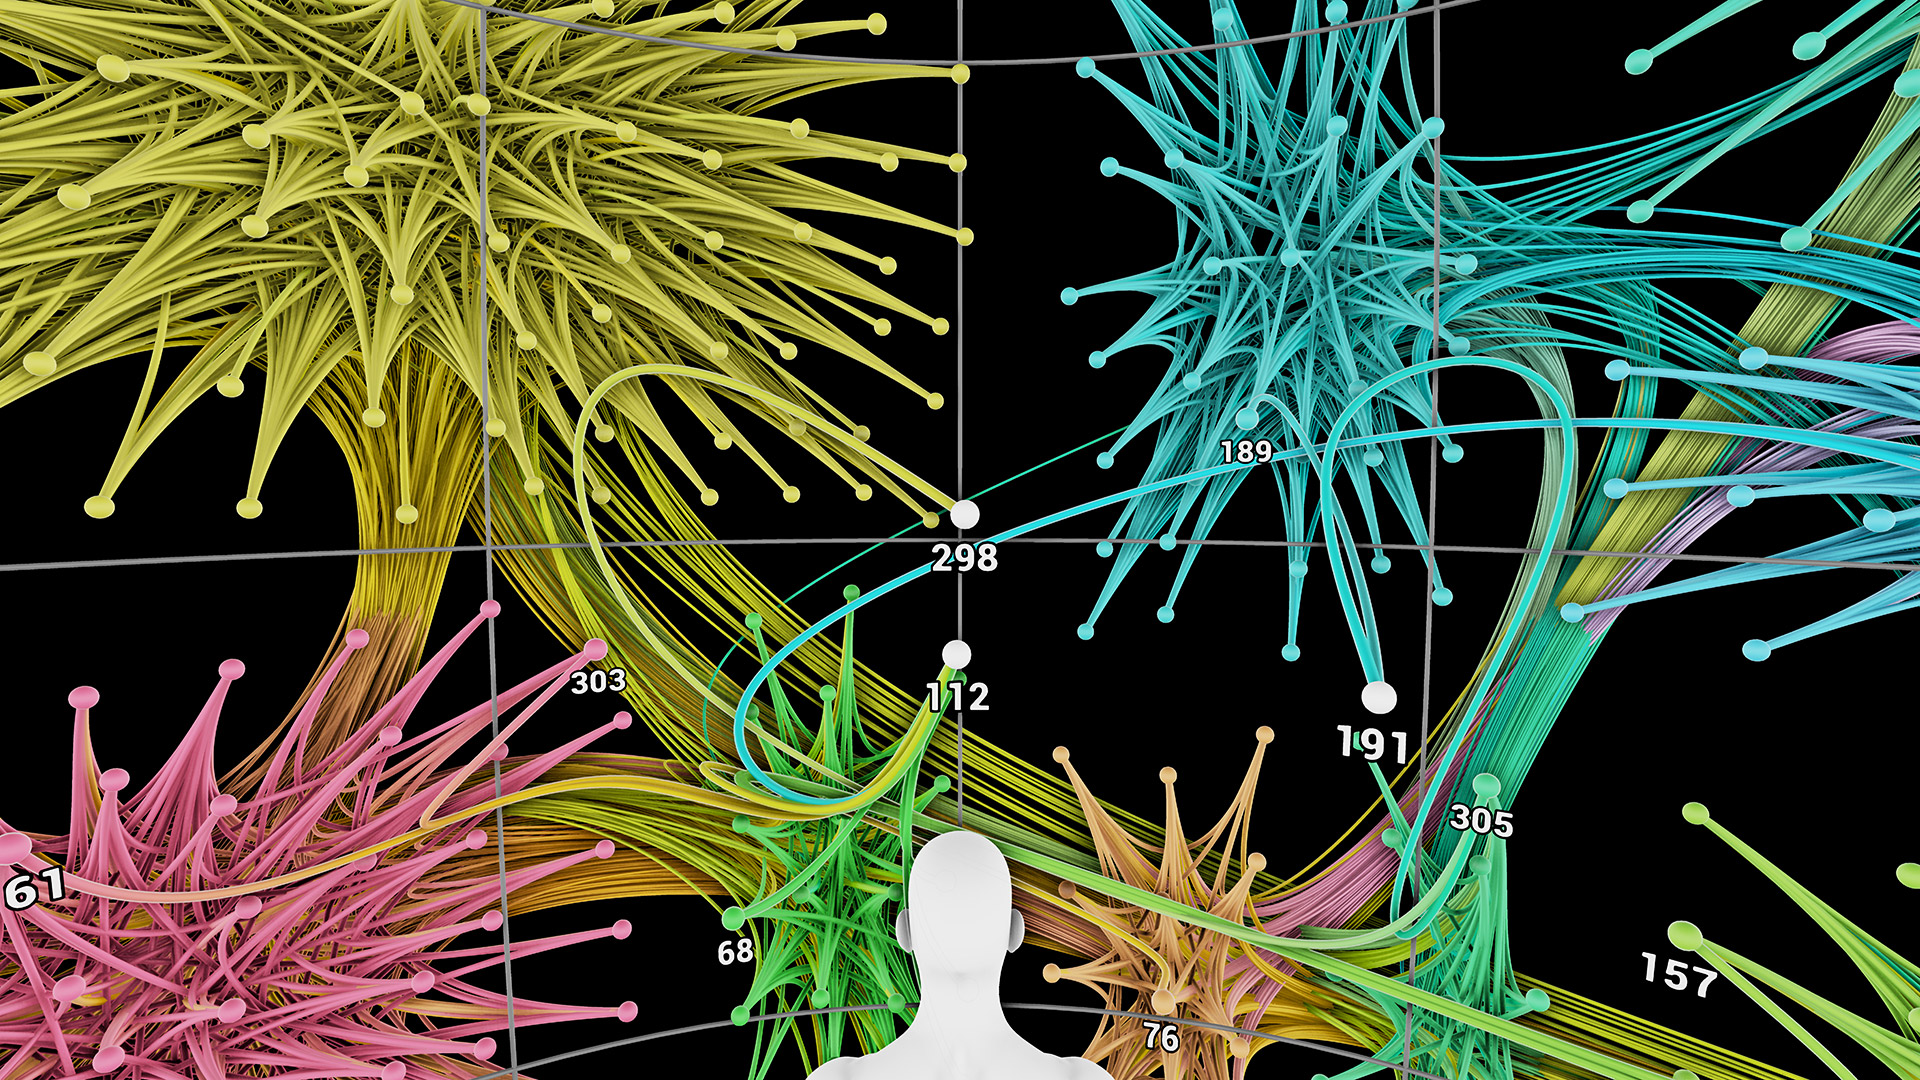
An implementation of the immersive graph visualization technique described in our paper (video preview):
@article{kwon16imsv,
    title={{A Study of Layout, Rendering, and Interaction Methods for Immersive Graph Visualization}},
    author={Kwon, Oh-Hyun and Muelder, Chris and Lee, Kyungwon and Ma, Kwan-Liu},
    journal={IEEE Transactions on Visualization and Computer Graphics},
    year={2016},
    volume={22},
    number={7},
    pages={1802-1815}
}
Oh-Hyun Kwon, Chris Muelder, and Kwan-Liu Ma are with VIDI Labs at the University of California, Davis. Kyungwon Lee is with Integrated Design Lab at the Ajou University, Korea.
Requirements
- Main application
- A Windows PC with nice graphics card(s). NVIDIA GTX 980 or better is recommended.
- Unreal Engine 4.17
- Oculus Rift (CV1)
- This application is designed for a seated environment with a keyboard and a mouse. This application does not use positional tracking and Oculus Touch. Find more details in our paper.
- HTC Vive is not tested yet.
- Data preprocessing (
/Preprocess)
Getting up and running
- In the Unreal Engine editor, use
VR Preview. - To understand how the application works, start from
AIGVGraphActor::BeginPlay.
Shorcuts in the application
| Command | Description |
|---|---|
` (backtick) |
Toggle console. Console commands for this application start with IGV_ prefix. |
Ctrl + O |
Open a file dialog. The file dialog is not visible in the head mounted display. |
V |
Reset viewpoint. |
Console commands
| Command | Description |
|---|---|
IGV_OpenFile |
Open a file dialog. The file dialog is not visible in the head mounted display. |
IGV_SetFieldOfView [float] |
Set the field of view of graph layout. The value should be determined based on the size of given graph. |
IGV_SetAspectRatio [float] |
Set the aspect ratio of graph layout. |
IGV_SetTreemapNesting [float] |
Set the nesting factor of treemap layout. |
To add more console commands, see AIGVPlayerController.
Data preprocessing
To visualize other graphs, please prepare the data as the following format:
{
    "nodes": [
        {"id": "A"},
        {"id": "B"},
        {"id": "C"}
    ],
    "links": [
        {"source": "A", "target": "B"},
        {"source": "A", "target": "C"}
    ]
}
Then, preprocess the data:
python main.py data/lesmis.json -r 1.0The -r parameter will change the size of resulting clustering hierarchy.
Output data will be saved in /Saved/Data/Graph directory.
Acknowledgement
This research has been sponsored by the U.S. National Science Foundation through grant IIS-1741536: Critical Visualization Technologies for Analyzing and Understanding Big Network Data.
