Giter Site home page Giter Site logo

inductivecomputerscience / pbplots Goto Github PK

View Code? Open in Web Editor NEW
111.0 111.0 74.0 1.16 MB

A plotting library available in many programming languages.

Home Page: https://repo.progsbase.com/repoviewer/no.inductive.libraries/Plots/latest/

License: MIT License

C 27.09% Shell 0.08% C++ 8.97% Java 10.07% JavaScript 7.52% TypeScript 8.59% C# 7.45% PHP 7.60% Python 7.02% Visual Basic .NET 8.72% Ruby 6.88% Assembly 0.01%
easy-to-use graphs plots reusable

pbplots's Issues

Substandard C

This seems like a useful library. I am a C coder/user. C in here is unfortunately in need of some improvements. Few examples.

What is the point of double as an argument to malloc, for example

// pbPlots.c line 127
colors = (RGBA**)malloc(sizeof(RGBA) * 8.0);

That of course produces a lot of warnings

1>~\pbPlots-0.1.7.1\C\pbPlots.c(127,45): warning C4244: 'function': conversion from 'double' to 'size_t', possible loss of data
  1. standard C is C11.
  2. these days one does
// this is VMT not VLA
colors =  malloc( sizeof( RGBA[8] ) );

Next. There is even code like this one:

// line 151
reference->image->x = (RGBABitmap**)malloc(sizeof(RGBABitmap) * 0.0);
// same as
reference->image->x = NULL ;
// or is it? it depends on the implementation

Next. This code is all heap-based. Stack-based code tends to be faster. But that requires refactoring.
There are dozens of unnecessary heap allocations. As an example CreateRectangle (line:168) is much faster in this form:

// C struct copy elision is very fast, return by value when making struct instances
Rectangle reateRectangle(double x1, double y1, double x2, double y2){
  Rectangle r = {  .x1 = x1, y1 = y1, .x2 = x2, .y2 = y2 } ;
  return r;
}

Also in standard C, there is no need to cast the allocation results. There are much more opportunities for improvement.

I assume all is known and this code will be improved.

Vector too long

In some unknown conditions PNum variable inside ComputeGridLinePositions() is getting value NaN, which causes exception Vector too long. Its appearing randomly.

How to plot vector of all zeros?

When I try to plot vector of all zeros it shows the following error
It also shows same error for any other value than 0.
terminate called after throwing an instance of 'std::length_error' what(): cannot create std::vector larger than max_size() Aborted (core dumped)

Here's the code

#include "pbPlots/supportLib.hpp"
#include "pbPlots/pbPlots.hpp"

using namespace std;

vector<double> get_p_axis(double step_size){
	int length = 1/step_size + 1.0;
	vector<double> p(length);

	int start = 0;
	for(int i = 0; i<length;i++)
		p[start++] = step_size*i;

	return p;
}

int main(){
	vector <double> p,H_of_p;
	p = get_p_axis(0.001);
	H_of_p.resize(p.size(),0);

	ScatterPlotSeries *series = GetDefaultScatterPlotSeriesSettings();
	series->xs = &p;
	series->ys = &H_of_p;
	series->linearInterpolation = true;
	series->lineType = toVector(L"dashed");
	series->lineThickness = 2;
	series->color = GetGray(0.3);


	ScatterPlotSettings *settings = GetDefaultScatterPlotSettings();
	settings->width = 600;
	settings->height = 400;
	settings->autoBoundaries = true;
	settings->autoPadding = true;
	settings->title = toVector(L"Cross Entropy");
	settings->xLabel = toVector(L"q");
	settings->yLabel = toVector(L"H(q)");
	settings->scatterPlotSeries->push_back(series);

	RGBABitmapImageReference *imageRef = CreateRGBABitmapImageReference();
	DrawScatterPlotFromSettings(imageRef,settings);
	
	vector<double> *png_data = ConvertToPNG(imageRef->image);
	WriteToFile(png_data,"Assn1_B.png");
	DeleteImage(imageRef->image);

	return 0;	
}```

Issue with the png file

Hello,

My code compiles perfectly but no png file is created.
Here the method supposed to plot the curve :

`void Sol::draw_sol_init(){
bool sucess;
StringReference *errorMessage = new StringReference();
RGBABitmapImageReference *imageRef = CreateRGBABitmapImageReference();
// m_space, m_sol_init are two vector with the same size
sucess = DrawScatterPlot(imageRef, 600, 400, &m_space, &m_sol_init, errorMessage);

if(sucess){
    std::vector<double> *pngdata = ConvertToPNG((*imageRef).image);
    WriteToFile(pngdata, "sol_init.png");
    DeleteImage((*imageRef).image);
    std::cout << "test"  <<std::endl;
}
else{
    std::cout << "nsm" << std::endl;
}

}`

and here my all project
Mesh.zip

Thank you in advance for your help.

problem compiling Example 1 using Visual Studio 2010

I am a relatively new C programmer and am trying to run the pbPlots example 1 under the old (and free) Visual Studio 2010 C IDE. If I am interpretting the error messages correctly, it appears that pbPlots' source file "supportlib.c" makes use of the "FILE" type in a manner incompatible with how its defined in VS2010's header file "stdio.h". I am trying to include a screen grab (with the offending complaint highlighted in yellow) along with this Issue here but I'm not sure I attached it herein correctly... we'll see.

Bottom line, I have no idea whatsoever as to how to even approach this hiccup. Thoughts/suggestions?

tmp 20230509-192513

C++ example, FreeAllocations()

I am not sure if I should put this here or not, but I am not finding any info when google searching nor can I find the mehtod located anywhere in the files the insturctions have you download when setting up pbPlots so I am curious how to use or where to I find the FreeAllocations() method that is being called in the examples? Thanks for any help with this and my apologizes that it is probably not a real issue just a question I am trying to find an answer to.

Great work on this library by the way, I find it very useful.

Works Fine but !!

I can draw graph thanks to your libraries but when i try to import the png into my program it misses the bottom part of it :
image
image

What i find strange its the fact that when i close my app it finish to generate the png :
image

Fault in example2 (c++) version of the code

I am running the c++ version of the code. when I use example1 or example 3 of the main programs these complete execution to the end just fine.
When using example2, I obtain a run time error located within the FreeAllocations function.

I am running Microsoft Visual Studio 2022. I downloaded pbPlot from GitHub in April 2024

The defect symptom shows up in the microsoft C++ library function xmemory as follows :
// If the following asserts, it likely means that we are performing
// an aligned delete on memory coming from an unaligned allocation.
_STL_ASSERT(_Ptr_user[-2] == _Big_allocation_sentinel, "invalid argument");

prior to making this report, I added some debug code which I can provide to you. Here are the metrics :
The linked list of MEMORY structures has a total length of 243399 structures.
When the FreeAllocation function is called and MEMORY structures are deallocated I observe that 46 of the linked structures remain.
I have tracked the problem down top the line delete x within the code segment

if(cur->isArray)
    {
	vector<void*> *x = (vector<void*> *)cur->mem;
            delete x;

Based on debugging code I added, the length of the MEMORY structures linked list grows from a length of 22 just after
the line in the main program (example 2) : ScatterPlotSettings* settings = GetDefaultScatterPlotSettings();
to a long length of 243366 jut after the source line
success = DrawScatterPlotFromSettings(imageReference, settings, errorMessage);
so I m postulating that some memory item allocated with in this DrawScatterPlotFromSettings function is not properly allocated.

Is there any additional information I can provide ?

I will continue to investigate.

Dave Anglea

X and Y Labels flipped

I had to triple check. And it's late so I may still be wrong.

But it seems the x and y labels are flipped.

Here is a screenshot of a graph with the symptoms:
Flipped Axis

Here is a screenshot of the relevant graphing code snippet:
Code Snippet

And just in case here is code with a single datapoint output:
Data Point
So we know that radii are the larger numbers and are stored in vector radiusses (which I used for graphing x).

Also, great work, and thanks for making it opensource. I'm glad to see a multi-lingual graphing solution. I also appreciate the autoscaling and nan-ignoring it seems to do.

could not make the bargraph with x-axis labels work, c++

#include "pbPlots.hpp"
#include "supportLib.hpp"

//library from pbplots, https://github.com/InductiveComputerScience/pbPlots

using namespace std;

int main(){
bool success;
StringReference *errorMessage = CreateStringReferenceLengthValue(0, L' ');
RGBABitmapImageReference *imageReference = CreateRGBABitmapImageReference();

vector<double> ys{2, -1, -2, -1, 2};

BarPlotSeries *series = GetDefaultBarPlotSeriesSettings();
series->ys = &ys;


BarPlotSettings *settings = GetDefaultBarPlotSettings();
settings->width = 800;
settings->height = 600;
settings->title = toVector(L"something");
settings->yLabel = toVector(L"Price");
settings->barPlotSeries->push_back(series);

settings->autoLabels = false;
settings->xLabels = new vector (5.0);
settings->xLabels->at(0) = CreateStringReference(toVector(L"product1"));
settings->xLabels->at(1) = CreateStringReference(toVector(L"product2"));
settings->xLabels->at(2) = CreateStringReference(toVector(L"product3"));
settings->xLabels->at(3) = CreateStringReference(toVector(L"product4"));
settings->xLabels->at(4) = CreateStringReference(toVector(L"product5"));

/*
*/

success = DrawBarPlotFromSettings(imageReference, settings, errorMessage);

if(success){
	vector<double> *pngdata = ConvertToPNG(imageReference->image);
	WriteToFile(pngdata, "example3.png");
	DeleteImage(imageReference->image);
}else{
	cerr << "Error: ";
	for(wchar_t c : *errorMessage->string){
		wcerr << c;
	}
	cerr << endl;
}

FreeAllocations();

return success ? 0 : 1;

}

ive copied the examples and the bargraph without x axis labels work, but when i copied the code for it it doesnt run.
i used replit .

error:
sh -c make -s
./main.cpp:26:27: error: use of class template 'vector' requires template arguments
settings->xLabels = new vector (5.0);
^
/nix/store/dlni53myj53kx20pi4yhm7p68lw17b07-gcc-10.3.0/include/c++/10.3.0/bits/stl_vector.h:389:11: note: template is declared here
class vector : protected _Vector_base<_Tp, _Alloc>
^
1 error generated.
make: *** [Makefile:10: main] Error 1
exit status 2

Vector was not declared in this scope

Hi,

I followed this tutorial in order to be able to plot data in my c++ project. I am using QtCreator and my project is a catkin package (i.e. is defined by CMakeLists.txt and package.xml files).

When compiling this simple code of the tutorial I get

‘vector’ was not declared in this scope
     vector<double> x{-2, -1, 0, 1, 2};
     ^~~~~~`

After replacing vector with std::vector my code compiles, but there is no .png file generated.

Do you have any idea what may be the problem?

Thanks

Overlapping Graphs

It would be nice to include a method where multiple graphs using different data can be included on a single png ie multiple lines displaying different data,
An additional change would be allowing users to have both linear interpolation and the Points for easier viewing.

rectangle conflict with std::rectangle

I'm using vs2019 and had issue with pbPlots.cpp/.hpp. They are using namespace std and vs used rectangle from wingdi.h instead of local rectangle.
Solved by changing rectangle on rectangle_pbPlots in all files.

graph a function in C.

Hello, I am a student and I have a little problem, in my school we need to graph a function and I want to know I can Draw the graph without a line. For example I have this graph and have two lines one of these is the line that I draw and i dont want the other line
Grafica de la forma y=mx+b

The "Expression:transposed pointer range" error by using it in C++20

My code:

RGBABitmapImageReference *imageReference = CreateRGBABitmapImageReference();
    vector<double> xs = vector<double>();
    for(int i = 1; i<turn;i++){
        xs.push_back(i);
    }
    vector<double> ys = vector<double>();
    for(int a : s.totalpopulation)
        ys.push_back(a);
    DrawScatterPlot(imageReference, 600, 400, &xs,
                    &ys);

    vector<double> *pngdata = ConvertToPNG(imageReference->image);
    WriteToFile(pngdata, "example1.png");
    DeleteImage(imageReference->image);

The s.totalpopulation is in vector<int>

The exception:
image

How can i fix this, thanks.

Env:
win10 x64
MSVC
I add the cpp file into my cmake file

terminate called after throwing an instance of 'std::bad_alloc' what(): std::bad_alloc Aborted (core dumped)

Hello,

I am using pbplots as per the tutorial:
https://github.com/InductiveComputerScience/pbPlots/blob/master/Cpp/example1.cpp
For this new version.

The first error I get is :

error: ‘FreeAllocations’ was not declared in this scope
     FreeAllocations();

If I comment it out, I get the error:

terminate called after throwing an instance of 'std::bad_alloc'
  what():  std::bad_alloc
Aborted (core dumped)

This is my CMake file:

cmake_minimum_required(VERSION 3.0.2)
project(Canoo)

set(CMAKE_BUILD_TYPE Debug)
set(CMAKE_CXX_FLAGS "${CMAKE_CXX_FLAGS} -std=c++17")

#SET( EIGEN3_INCLUDE_DIR "$ENV{EIGEN3_INCLUDE_DIR}" )
#SET( CMAKE_MODULE_PATH "$ENV{EIGEN3_DIR}" )

find_package(Eigen3 REQUIRED )

link_directories(${Eigen_INCLUDE_DIRS})

# include_directories is needed for the compiler to know where looking for Eigen3 header files to be included 
include_directories( "${CMAKE_CURRENT_SOURCE_DIR}/pbplots" )

add_executable(solution main.cpp pbplots/pbPlots.cpp pbplots/supportLib.cpp)

#target_link_libraries(solution eigen)

I kept all the pbplots cpp and hpp in pbplots folder in my current directory. I have no trouble in completion. But execution is trouble.

Whats the problem? though I am following exactly in the tutorial.

Issue with the plotting

The library is working correctly however how to insert a border, grid-on/off and auto marker? Can you please include documentation with respect to C++.

ScatterPlot Series color issue

When using color in scatterplot series half the image gets covered by grey coincidentally where the data points start.
as shown in the below example, The language used is C
image

std::out_of_range: DrawScatterPlot

#include "pbPlots.hpp"
#include "supportLib.hpp"

using namespace std;

int main(){
bool success;
StringReference *errorMessage = new StringReference();
RGBABitmapImageReference *imageReference = CreateRGBABitmapImageReference();

vector<double> xs{-2, -1, 0, 1, 2};
vector<double> ys{2, -1, -2, -1, 2};
cout<<"only here";
success = DrawScatterPlot(imageReference, 600, 400, &xs, &ys, errorMessage);
cout<<"only here";
if(success){
    vector<double> *pngdata = ConvertToPNG(imageReference->image);
  cout<< "Working here";
    WriteToFile(pngdata, "example1.png");
    DeleteImage(imageReference->image);
}else{
    cerr << "Error: ";
    for(wchar_t c : *errorMessage->string){
        wcerr << c;
    }
    cerr << endl;
}

return success ? 0 : 1;

}

ERROR: terminate called after throwing an instance of 'std::out_of_range'
what(): vector::_M_range_check: __n (which is 4294967295) >= this->size() (which is 36)

Are legends supported?

Hi guys, I'm trying the c++ version, I was wondering if legends are supported. I can't find any reference in the source code, so I think that they are not supported.

Corrupted .png file

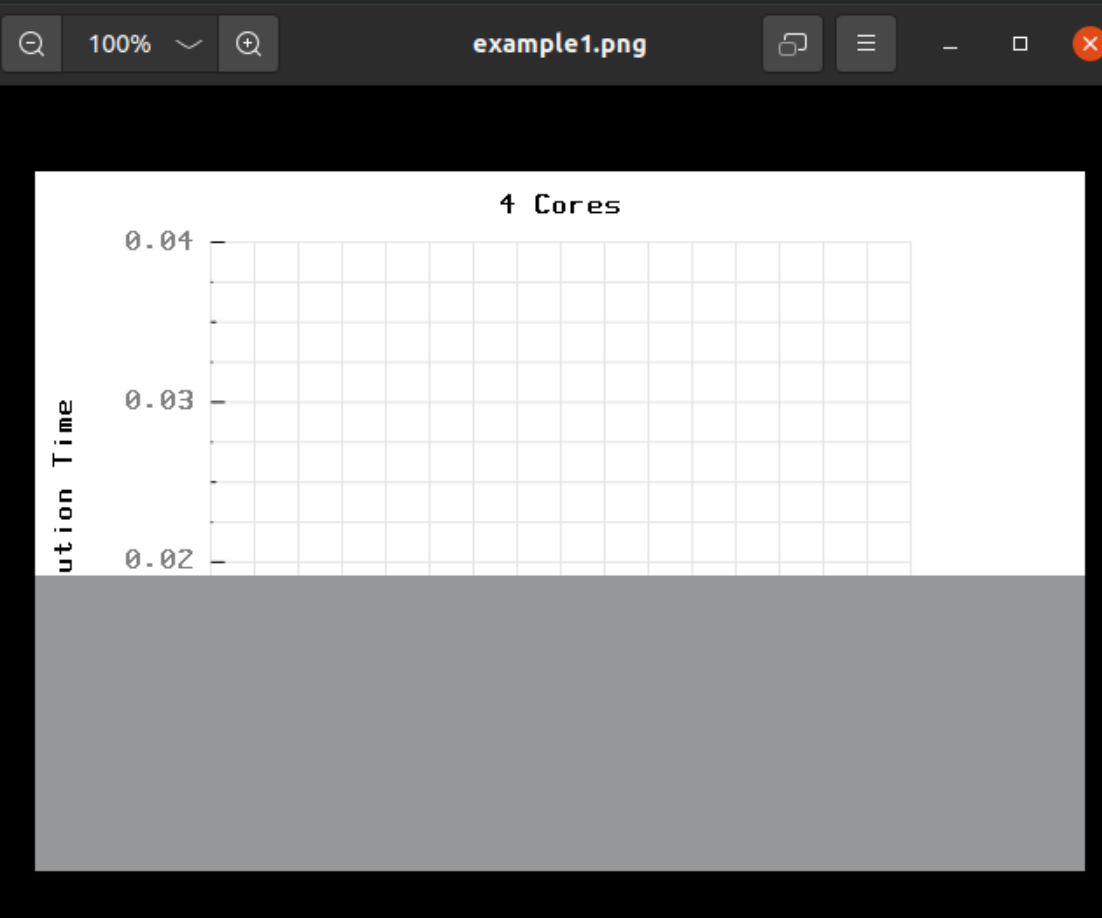
Hello, I have recently been working on a simple SIR Epidemic Simulation, and wanted to use pbPlots to visualize the data. Unfortunately, I can't get it to work correctly. Every time I run my code and go to open the png file, it just says that the file is unreadable or corrupted. I also noticed that the file size is only 65 bytes, which is smaller than the usual 180KB.

Here's my code:

/*
	Brandon Pyle
	SIR Epidemic Simulation

	This program is a simple customizable epidemic simulation that uses the SIR model
*/

//Include statements
#include <string>
#include <iostream>
#include <iomanip>
#include <vector>
#include "pbPlots.hpp"
#include "supportLib.hpp"

using namespace std;

//Function prototypes

int main()
{
	//The following block of code creates the title box in the command line
	for (int i = 0; i < 50; i++)
		cout << "*";
	cout << endl << setw(49) << left << "*" << right << "*" << endl;
	cout << "*                  Brandon Pyle                  *" << endl;
	cout << "*            SIR Epidemic Simulation             *";
	cout << endl << setw(49) << left << "*" << right << "*" << endl;
	for (int i = 0; i < 50; i++)
		cout << "*";

	cout << endl << endl;

	//Variable Declarations
	int numDays;
	int population;
	double infectionRate = 0.0002; //Percent of other people a person can infect
	double recoveryRate = 10; //In days

	cout << "Enter the length of the simulation in days: ";
	cin >> numDays;

	cout << endl << "Enter the population number for the simulation: ";
	cin >> population;

	if (population > 5000)
		cout << "WARNING: Numbers greater than 5000 may result in incorrect or inaccurate results." << endl;
	else
		cout << endl;

	vector<double> S(population, 0.0); //Number of Susceptible People
	vector<double> I(population, 0.0); //Number of Infected People
	vector<double> R(population, 0.0); //Number of Removed People

	vector<double> xPos;
	for (double i = 0.0; i < numDays; i++)
		xPos.push_back(i);

	I[0] = 1; //Starts the simulation with 6 infected people
	S[0] = population - I[0]; //Initial number of susceptible people
	R[0] = 0; //Initial number of removed people

	RGBABitmapImageReference* imageReference = CreateRGBABitmapImageReference();

	cout << setw(5) << right << "Day";
	cout << setw(13) << right << "Susceptible";
	cout << setw(10) << right << "Infected";
	cout << setw(9) << right << "Removed" << endl;

	for (int i = 0; i < numDays; i++)
	{
		cout << setw(5) << right << i + 1;
		cout << setw(13) << right << fixed << setprecision(0) << S[i];
		cout << setw(10) << right << fixed << setprecision(0) << I[i];
		cout << setw(9) << right << fixed << setprecision(0) << R[i] << endl << endl;

		S[i + 1] = S[i] - infectionRate * S[i] * I[i];
		I[i + 1] = I[i] + infectionRate * S[i] * I[i] - I[i] / recoveryRate;
		R[i + 1] = R[i] + I[i] / recoveryRate;
	}

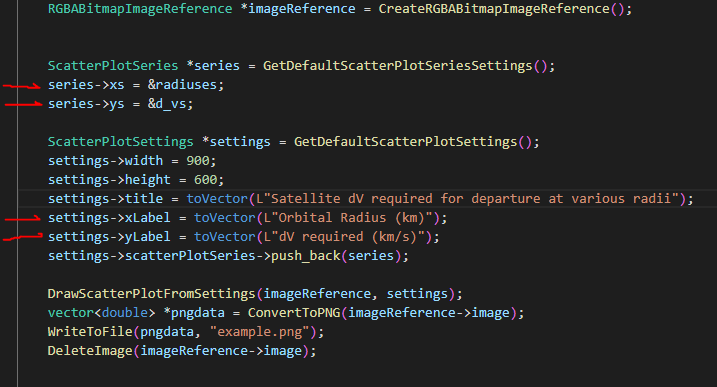
	ScatterPlotSeries* series = GetDefaultScatterPlotSeriesSettings();
	series->xs = &xPos;
	series->ys = &S;
	series->linearInterpolation = false;
	series->lineType = toVector(L"solid");
	series->color = CreateRGBColor(0, 0, 1);
	
	ScatterPlotSeries* series2 = GetDefaultScatterPlotSeriesSettings();
	series->xs = &xPos;
	series->ys = &I;
	series->linearInterpolation = false;
	series->lineType = toVector(L"solid");
	series->color = CreateRGBColor(0, 1, 0);

	ScatterPlotSeries* series3 = GetDefaultScatterPlotSeriesSettings();
	series->xs = &xPos;
	series->ys = &R;
	series->linearInterpolation = false;
	series->lineType = toVector(L"solid");
	series->color = CreateRGBColor(0, 0, 0);

	ScatterPlotSettings *settings = GetDefaultScatterPlotSettings();
	settings->width = 800;
	settings->height = 480;
	settings->autoBoundaries = true;
	settings->autoPadding = true;
	settings->title = toVector(L"SIR Epidemic Simulation");
	settings->xLabel = toVector(L"Days");
	settings->yLabel = toVector(L"Population");
	settings->scatterPlotSeries->push_back(series);
	settings->scatterPlotSeries->push_back(series2);
	settings->scatterPlotSeries->push_back(series3);

	DrawScatterPlotFromSettings(imageReference, settings);

	//DrawScatterPlot(imageReference, 800, 480, &I, &S);
	
	vector<double>* pngData = ConvertToPNG(imageReference->image);
	WriteToFile(pngData, "SIR_Graph_Test.png");
	DeleteImage(imageReference->image);

	return 0;
}

I have narrowed down the issue to be something with the xPos vector, but I can't figure out why it isn't working. Also, the program does work if you comment out all of the ScatterPlotSeries stuff and uncomment the DrawScatterPlot(...); line. This method works because it uses the I vector for the X axis instead of my xPos vector.

Any suggestions?

Recommend Projects

  • React photo React

    A declarative, efficient, and flexible JavaScript library for building user interfaces.

  • Vue.js photo Vue.js

    🖖 Vue.js is a progressive, incrementally-adoptable JavaScript framework for building UI on the web.

  • Typescript photo Typescript

    TypeScript is a superset of JavaScript that compiles to clean JavaScript output.

  • TensorFlow photo TensorFlow

    An Open Source Machine Learning Framework for Everyone

  • Django photo Django

    The Web framework for perfectionists with deadlines.

  • D3 photo D3

    Bring data to life with SVG, Canvas and HTML. 📊📈🎉

Recommend Topics

  • javascript

    JavaScript (JS) is a lightweight interpreted programming language with first-class functions.

  • web

    Some thing interesting about web. New door for the world.

  • server

    A server is a program made to process requests and deliver data to clients.

  • Machine learning

    Machine learning is a way of modeling and interpreting data that allows a piece of software to respond intelligently.

  • Game

    Some thing interesting about game, make everyone happy.

Recommend Org

  • Facebook photo Facebook

    We are working to build community through open source technology. NB: members must have two-factor auth.

  • Microsoft photo Microsoft

    Open source projects and samples from Microsoft.

  • Google photo Google

    Google ❤️ Open Source for everyone.

  • D3 photo D3

    Data-Driven Documents codes.