Giter Site home page Giter Site logo

isaozler / grafana-shift-selector Goto Github PK

View Code? Open in Web Editor NEW
5.0 2.0 6.0 3.66 MB

The shift selector allows you to adjust the time range of your grafana dashboard to one specific shift or a range of shifts.

License: Apache License 2.0

JavaScript 6.87% TypeScript 90.80% CSS 1.43% Dockerfile 0.89%
grafana grafana-panel grafana-plugin shift production-lines

grafana-shift-selector's Introduction

Grafana Shift Selector Plugin

license

The shift selector allows you to adjust the time range of your grafana dashboard to one specific shift or a range of shifts. On this page we'll show you how it works and how you can adjust the displayed shifts to a specific season or production line.

Shift selector

Realtime Shift Track feature (new feature*)

With this new feature, you can enable the shift selector to track shifts automatically based on the local time. So you don't need to change shifts manually. To use this new feature, you need to enable it through the panel options.

  • Enable the "Real-time shift auto-select"
  • Determine a refresh interval (these should be according to the time interval pattern of Grafana. Eg. for 5 seconds -> 5s, 1 hour -> 1h)
  • Optionally, if you have multiple groups, determine a group to auto-select from. It uses the group_uuid

Be aware that enabling real-time will hide the date and range selectors

Shift selector Realtime

New panel options

  • Data Mapper replaces the variables var_query_map
  • Simple quick start flow (without need the need of variables)
  • Icon mapper added to match the icons
  • Customize day selection label. Useful if you like to localize or specify a different label.
  • Display options for the shift buttons.
    • With this new option you are able to show the buttons in;
      • only text
      • only icons
      • or with icons and text, which is the default option
  • Change the range "Start-End", "Start" and, "End" labels.

Quick Start (static shifts)

With this plugin you are able to choose between dynamic (from a datasource) and static.

To start quickly, set shifts (groups) in the Data Mapper panel:

  • Set Shifts from a data source to false
  • Copy-paste the json shown below as an example
{
  "static": {
    "shifts": [
      {
        "group": "Group 1",
        "group_uuid": "group_uuid_1",
        "uuid": "shift_uuid_1",
        "label": "Morning Custom",
        "startTime": "06:00:00",
        "endTime": "14:00:00",
        "order": 1
      },
      {
        "group": "Group 2",
        "group_uuid": "group_uuid_2",
        "uuid": "shift_uuid_2",
        "label": "Afternoon Custom",
        "startTime": "14:00:00",
        "endTime": "22:00:00",
        "order": 1
      },
      {
        "group": "Group 2",
        "group_uuid": "group_uuid_2",
        "uuid": "shift_uuid_3",
        "label": "Night Custom",
        "startTime": "22:00:00",
        "endTime": "06:00:00",
        "order": 2
      }
    ]
  }
}

Now you are able to see the shifts in two groups. Group 1 and Group 2. This could for example be summer or winter time.

In order to set you shifts from a datasource please continue to read.

Shifts from datasources

Functionalities

The options you can choose are: (from left to right)

  • Date selection: select a date for which you want to set a shift.
  • Select which time you want to change. The dots at the end of the line shows whether you will change the start time, end time or both:
  • Shift (two dots): change the time selection of the dashboard to the selected shift. This will set both start and end time of your dashboard. Both start and end time of the shift are displayed in the button. Shift selector
  • Start time (dot on left): only change the start time of the time selection to the start time of the selected shift. The times displayed are the start times of the shifts. Shift start time
  • End time (dot on right): only change the end time of the time selection to the end time of the selected shift. The times displayed are the end times of the shifts. Shift end time

Multiple shift groups

The shift selector can also handle multiple shift groups, to distinguish between them, the names of these groups are added in front of the buttons. However, if there is only one shift group available, that name will disappear, as in the example above. Multiple shift groups

Changes to time selection in Grafana

When you click a button, the selected time will change to the selected shift time. In this example we have chosen two seasonal shift groups: one for the summer and one for the winter.

Group name Shift name Shift order Start time End time
Summer Morning 1 8:00 14:00
Summer Afternoon 2 14:00 22:00
Summer Night 3 22:00 8:00
Winter Night 1 22:30 10:30
Winter Day 2 10:30 22:30

In this example we have selected the day May 17th 2021 which leads to the following shift times:

Group name Shift name Updated start time Updated end time
Summer 1. Morning May 17th 8:00 May 17th 14:00
Summer 2. Afternoon May 17th 14:00 May 17th 22:00
Summer 3. Night May 17th 22:00 May 18th 8:00
Winter 1. Night May 16th 22:30 May 17th 10:30
Winter 2. Day May 17th 10:30 May 17th 22:30

The dates in bold are the dates that belong to a shift that passes midnight. The dates are updated accordingly.

Warning: the shift selector only works well when your computer is in the right timezone. Changing the timezone in Grafana does not affect the behavior of the shift selector.

How to add it?

In order to add the shift selector, you'll have to do two things:

  1. Create a ShiftSelector panel

  2. Create a hidden variable with the names of the shifts you want to display. To do so, go to 'dashboard settings' -> 'variables' -> 'add new variable'. Then use the following settings to create the variable:

    1. Database

      • Name: var_shifts_dataModel
      • Type: Data source
      • Hide: Variable
      • Data source
        • Type: Database type
        • Instance name filter: Name of your data source containing the shifts data

      This will result in:

      • The data source will be listed in the 'Preview of values' above the submit button.
    2. Shifts data model mapper

      • Name: var_query_map
      • Type: Constant
      • Constant options
        • Value: here you can paste the mapper object. You can find an example in the
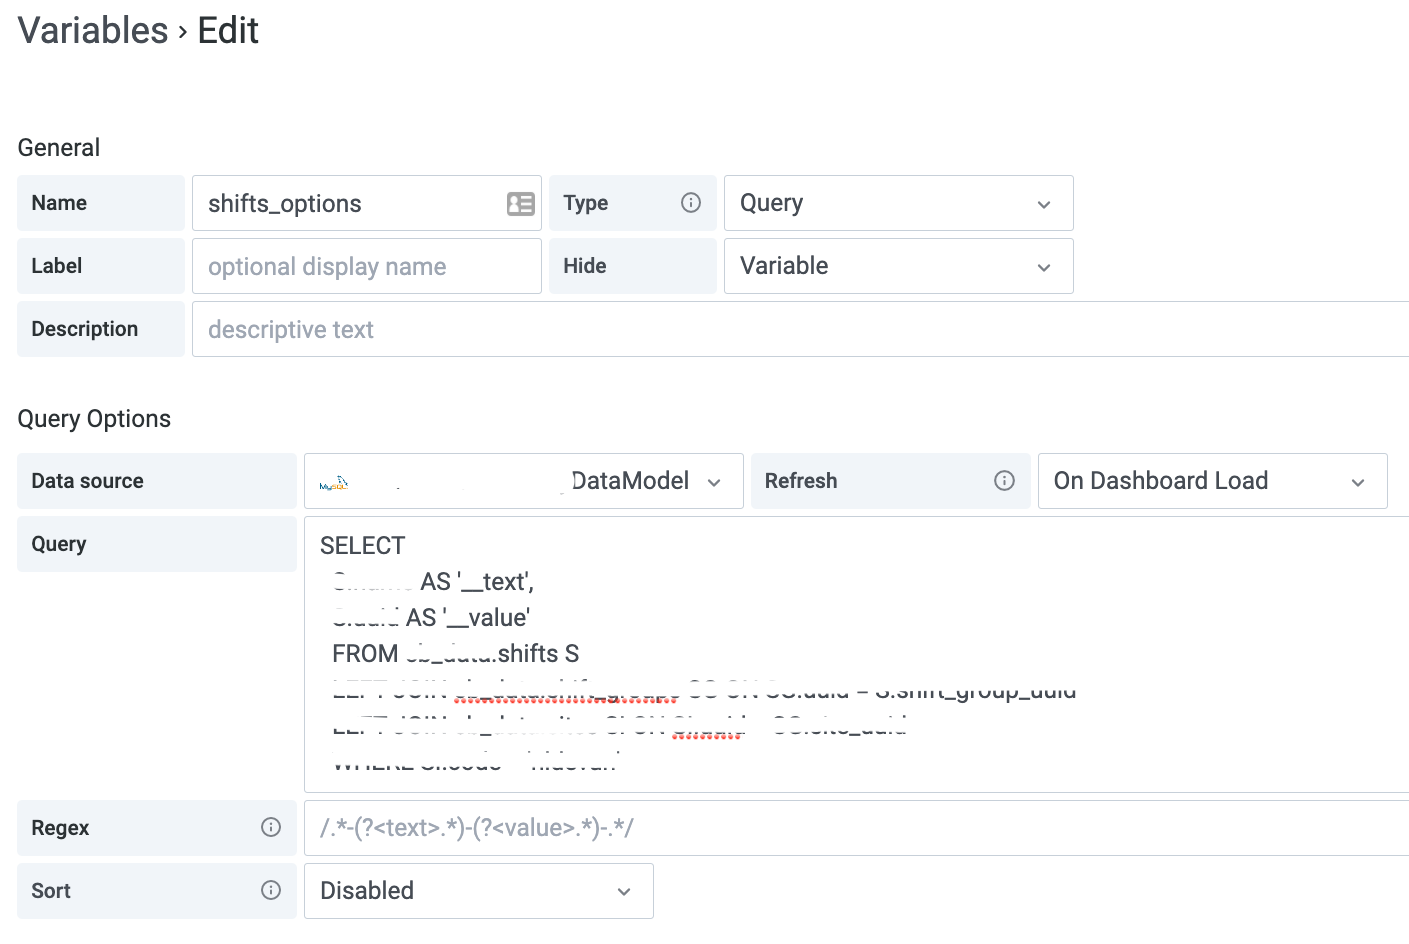
 var_query_map.example.js file. You can remove the static values because you will be fetching them from your datasource.
          • Options JSON object
            • project
              • shift_groups: contains the shift_groups table fields. You can change the name, uuid, site_uuid fields according to your database scheme.
              • shifts: contains the shifts table fields. Change the uuid, start_time, end_time, order, group_uuid according to your databse scheme.
            • lookup
              • shifts: the name of your shifts table
              • shift_groups: the name of your shift groups table
            • schema
              • shifts (optional): the namespace of your shifts table database
              • shift_groups (optional): the namespace of your shift groups table database
            • values
              • site_uuid (optional): in case you want to select a specific site
    3. Options

      • Name: var_shifts_options
      • Type: Query
      • Hide: Variable
      • Data source: {{Your Database containing the shifts and shift-groups}}
      • Refresh: On Dashboard Load
      • Query: a query to select the shifts associated with your factory. You can also expand the query by filtering on for instance shift group or production line (examples).
      SELECT
         S.name AS '__text',
         S.uuid AS '__value'
      FROM shifts S

      This will result in: variable settings

*Note that when you have multiple shift groups with shifts with the same name, the names of the shifts should be unique. If both shift groups have a shift named 'morning', it is easiest to make the name of the shift unique by adding the shift order or the shift group name to the AS '__text' in the query, two examples:

CONCAT(S.shift_order, '. ', S.name) AS '__text', -- to add the number of the order of the shift
CONCAT(SG.name, ' - ', S.name) AS '__text',  -- to add the shift group name

Database: example

  • sites
CREATE TABLE `sites` (
  `uuid` varchar(22) NOT NULL,
  `name` varchar(255) NOT NULL,
  PRIMARY KEY (`uuid`),
  UNIQUE KEY `name_UNIQUE` (`name`),
) ENGINE=InnoDB DEFAULT CHARSET=utf8mb4 COLLATE=utf8mb4_0900_ai_ci;
  • shift_groups
CREATE TABLE `shift_groups` (
  `uuid` varchar(22) NOT NULL,
  `name` varchar(255) NOT NULL,
  `site_uuid` varchar(22) NOT NULL,
  PRIMARY KEY (`uuid`),
  UNIQUE KEY `site_uuid_name_UNIQUE` (`site_uuid`,`name`),
  KEY `shift_group_site_uuid_idx` (`site_uuid`),
  CONSTRAINT `shift_group_site_uuid` FOREIGN KEY (`site_uuid`) REFERENCES `sites` (`uuid`) ON DELETE CASCADE
) ENGINE=InnoDB DEFAULT CHARSET=utf8mb4 COLLATE=utf8mb4_0900_ai_ci;
  • shifts
CREATE TABLE `shifts` (
  `uuid` varchar(22) NOT NULL,
  `name` varchar(255) NOT NULL COMMENT 'Name or description of shift',
  `shift_order` int NOT NULL COMMENT 'Order of the shifts on a operational day for the shift_group_uuid as referenced by shift_group_uuid',
  `start_time` time NOT NULL COMMENT 'The time that the shift starts (local timezone)',
  `end_time` time NOT NULL COMMENT 'The time that the shift ends (local timezone)',
  `shift_group_uuid` varchar(22) NOT NULL COMMENT 'Uuid of the shift group',
  PRIMARY KEY (`uuid`),
  UNIQUE KEY `name_group_uuid_UNIQUE` (`shift_group_uuid`,`name`),
  UNIQUE KEY `order_group_uuid_UNIQUE` (`shift_group_uuid`,`shift_order`),
  UNIQUE KEY `start_time_group_uuid_UNIQUE` (`shift_group_uuid`,`start_time`),
  UNIQUE KEY `end_time_group_uuid_UNIQUE` (`shift_group_uuid`,`end_time`),
  KEY `shifts_group_uuid_idx` (`shift_group_uuid`),
  CONSTRAINT `shifts_shift_group_uuid_fk` FOREIGN KEY (`shift_group_uuid`) REFERENCES `shift_groups` (`uuid`) ON DELETE CASCADE
) ENGINE=InnoDB DEFAULT CHARSET=utf8mb4 COLLATE=utf8mb4_0900_ai_ci;

Appendix: filtering queries

If you want to filter the shifts that are displayed to for instance a certain shift group or belonging to a production line, you can add extra variables to your dashboard and implement them in the variable shifts_options. Two examples are described below, of which the production line example has been implemented in a couple of global dashboards.

Filter on production line

Create a variable to select the production line (or work center):

  • Variable name: work center

  • Query: (update example01 to your factory code)

    SELECT
        WC.name AS '__text',
        WC.uuid AS '__value'
    FROM work_centers WC
    LEFT JOIN sites SI ON SI.uuid = WC.site_uuid
    WHERE SI.code = 'example01'
  • Update the query for the shifts_options to:

    SELECT
        S.name AS '__text',
        S.uuid AS '__value'
    FROM shifts S
    LEFT JOIN shift_groups SG ON SG.uuid = S.shift_group_uuid
    LEFT JOIN work_center_has_shift_groups WCHSG ON WCHSG.work_center_uuid = ${work_center}

Filter on shift group

Create a variable to select the shift group:

  • Variable name: shifts_group

  • Query: (update example01 to your factory site code)

    SELECT
        SG.name AS '__text',
        SG.uuid AS '__value'
    FROM shift_groups SG
    LEFT JOIN sites SI ON SI.uuid = SG.site_uuid
    WHERE SI.code = 'example01'
  • Update the query for the shifts_options to:

    SELECT
        S.name AS '__text',
        S.uuid AS '__value'
    FROM shifts S
    LEFT JOIN shift_groups SG ON SG.uuid = S.shift_group_uuid
    WHERE SG.uuid = ${shift_group}

grafana-shift-selector's People

Contributors

isaozler avatar

Stargazers

 avatar  avatar  avatar  avatar  avatar

Watchers

 avatar  avatar

grafana-shift-selector's Issues

Real Time mode not updating date (but time yes)

Hi,
I'm using latest release of plugin and it's successfully working on non real time dashboard.
But on real time mode, day date is not updated automatically (but time shift yes ! :-) ).

For example below screenshot:
Actual date is 12/07/22 and shift plugin with real time activated still display previous day date 11/07/22.

image

Shift plugin setup:
image

To change current day date, i have to update manually date in panel edit mode and save dashboard afterwards:
image

Feature request: add options to change base colors of the components

Issue:
The colors don't always esthetically match rest of the dashboard and it can create rather unpleasant user experience (for the eyes).

Solution:
Add options to customize styles / colors of the shift picker plugin.

Keep up the amazing work with this amazing plugin! :)

Add an option to allow change "to" param to 'now' instead of the end time of a shift

There is a problem that when I enabled the Real-time shift auto-select option, the "to" parameter on url was sought to the end time of a shift. That was not really helpful while I was querying PromQL that calculated a sum of data point in a time range like from the start time of the shift till now. To solve this problem, I have modified your code to add a new option like below.

image

So my query is able to calculate the sum of data points from the start time of a shift till present.
image
image

I hope you would approve this feature and guide me how to contribute my work to your plugin.
By the way, I would suggest another feature that is adding a shift countdown. It would appear below the shift selector on the same panel.

Some ideas for improvements and some question regarding refresh

A very nice plugin that helps to solve a problem with setting the time ranges more easily!

I have some suggestions for improvement both of the plugin and the description text.

  1. Add text in description text that it is under "Panel Options, Repeat options, Repeat by variable" is where the var_query_map needs to be set.
  2. It would be nice also to be able to set a number of days or hour for a "shift" as span for a group.
  3. For me at least I can not change month in the day selection, other than typing in the new date. Is it possible to add an arrow to shift month in the calendar.

I do not know if this is an unwanted feature of grafana or if I have missed something in the installation. In order to get my dashboard to update after pressing a button in the plugin panel I need to press refresh in order refresh the dashboard.
Any ideas on this?

Service error:

Hi all,
I try to implement the data base example from the documentation. But I get always the error message "Service error: " in the shift selector configuration.

In the Grafana log I get the log message:
'logger=context userId=1 orgId=1 uname=admin t=2023-10-19T09:27:19.275427842Z level=info msg="Request Completed" method=POST path=/api/ds/query status=400 remote_addr=10.142.206.203 time_ms=26 duration=26.400261ms size=481 referer="https://my-address.com/d/fd8616db-16c5-499d-a9da-8aa1879b7650/playground?editPanel=1&orgId=1&var-var_shifts_dataModel=FDCD_Connectivity&var-var_shifts_options=test" handler=/api/ds/query'

Does somebody know what could be the reason?

var_shifts_dataModel variable query

Hi all,
I do not understand what I need to query in the 'var_shifts_dataModel' variable? I read multiple times the documentation. Could somebody post an example? May be it would be also nice to add it an the documentation.

Thank you in advance!

Loss of autorefresh configuration with Real-time shift auto-select enabled

Hi there,

I wanted to report a bug regarding a component after updating Grafana to version 10.4.0 and utilizing the Real-time shift auto-select functionality. It seems that the board is losing its autorefresh configuration when the shift changes occur.

Steps to reproduce

  1. Update Grafana to version 10.4.0.
  2. Add grafana-shift-selector component and configure 2 or more shifts
  3. Enabled the Real-time shift auto-select functionality.
  4. Observe the component's behavior during shift changes.

Expected behavior
The autorefresh configuration should persist during shift changes.

Actual behavior
The autorefresh configuration seems to be lost when the shift changes occur. On shift change, board is not refreshing.

This issue seems related to one mentioned here.
This issue impacts our workflow significantly, as it disrupts the continuous monitoring process during shift changes. Please let me know if further information or clarification is needed.

Thank you for your attention to this matter.

Best regards,
Matteo

Plugin not working

Hi,

I've been trying to use your plugin wich seems so usefull.
However when i try to enable the feature in the panel option it doesn't appear.
timeoption

Grafan recognize the plugin and I even can add the panel wich shows me that i need to configure the pannel option.
panel

Have you ever seen this issues?
I'm using the latest version of Grafana 9.4.3 on a self managed type.

plugin_install

Thanks !

How to use your plugin

Hello i don't have much experience with mysql can you explain how to use your plugin i have prepare datasource with values but what too do next ? meybe you can prepare some short movie about configuration in grafana ?

image

image

Best Regard Luke

Shift selector constantly overrides the timerange of a dashboard

Info:
Version of Grafana: v9.0.3
License: Grafana Cloud Pro
Version of Plugin: 0.0.3

Issue:
When I use the shiftselector inside a dashboard I am unable to change the timerange with any other means. I can't change it via time picker, via dragging the graph ... nothing.

This plugin is amazing and great job but unfortunately it is unusable if this issue will persist for me (and maybe some other users). I would be more then happy to help fix this unfortunately my skills in this topic are limited ... :c

Attaching a little video showcasing what I mean:

bandicam.2022-07-04.18-05-25-275.mp4

This is the plugin options:
image

This is the var_query_map value:
{ "static": { "shifts": [ { "group": "Směna", "group_uuid": "group_uuid_1", "uuid": "shift_uuid_1", "label": "Ranní směna", "startTime": "06:00:00", "endTime": "14:00:00", "order": 1 }, { "group": "Směna", "group_uuid": "group_uuid_1", "uuid": "shift_uuid_2", "label": "Odpolední směna", "startTime": "14:00:00", "endTime": "22:00:00", "order": 1 }, { "group": "Směna", "group_uuid": "group_uuid_1", "uuid": "shift_uuid_3", "label": "Večerní směna", "startTime": "22:00:00", "endTime": "06:00:00", "order": 2 } ] } }

Any help would be highly appreciated!

suggestion for improvement after use v0.0.3

hi

nice your plug-in ,it's easier to define a specific timerange .

but i have a suggestion for improvement :
now :
when we want zoom on panel timeseries (or other) to see a specific période ,nothing change in grafana right corner 'time range' .
futur :
that will be possible to define with parameter that your plugin change time range only by action/clic ?

best regards

frenchy76

Immediately apply some shift by default (on load)

Hi,
It would be nice if immediately apply some shift by default (on load)

Mode1:
Set default shift (constant)

Mode2:
Apply shift which matches with system hour:

For example
s1 > 00:00 - 08:00
s2 > 08:00 - 16:00
s3 > 16:00 - 24:00

System time is 07:00 -> apply s1
System time is 15:55 -> apply s2
System time is 22:15 -> apply s3

Am I misunderstanding something ?

Hi everyone,

I'm trying to achieve something but I may be misunderstanding the plugin or else.
All my Table in my Database have a date column. They are formatted like this : 2024-04-15 19:38:31

I thought the plugin would allow me to select a time range (Start - End) for a short period (like 5secs) and then with the functionality "Realtime Shift Track feature" set to 5 seconds and dashboard refresh also 5 seconds, make my visuals "alive" 5secs by 5secs.

There maybe is something I didn't understand, like how am I supposed to filter the time range in my table query or why the time range doesn't move after the first refresh ?

Can you help me understand why I'm not able to do what I describe above ?

Custom refresh interval only refreshes the Shift Selector panel, not the entire dashboard

Hi @isaozler,

Thank you for your efforts and the latest version!

There is an issue with the custom refresh interval under the panel options though. The custom refresh interval is only refreshing the Shift Selector panel, not the entire dashboard. So the shift selector will always select the correct shift even if the dashboard is not refreshed. And after auto-selecting the correct shift and changing the absolute time range the dashboard refreshes once due to the change in time range...but that is where it ends. No more dashboard refreshes after that until the shift changes again.

Trigger for one of the warnings seems to be misconfigured

Hi,
One of the warnings in the latest Shift Selector version seems to be too sensitive.
Here is the code fragment that I'm talking about:

useEffect(() => {
    if (shiftValues.length && shiftOptions?.options && !closedAlerts.includes(1)) {
      const shiftGroupUUIDs: { [key: string]: number } = shiftValues.reduce((res: any, { text }: { text: string }) => {
        const [, shiftGroupUUID] = text.split('|');
        return {
          ...res,
          [shiftGroupUUID]: res[shiftGroupUUID] ? ++res[shiftGroupUUID] : 1,
        };
      }, {});
      const shiftOptionsCount = Object.values(shiftGroupUUIDs).reduce((acc: number, d: number): number => acc + d, 0);

      if (shiftOptionsCount !== shiftOptions.options.length) {
        if (shiftOptions.options.length > 1) {
          return setAlertHandler({
            id: 1,
            type: 'brandWarning',
            text:
              'Warning! You are missing shifts because some shiftnames are not unique. Please make sure all shifts have unique names!',
          });
        } else {
          return setAlertHandler({
            id: 1,
            type: 'brandWarning',
            text: 'Warning! No shifts available. Please check your shift options variable.',
          });
        }
      }

      if (alerts.find(({ id }) => id === 1)) {
        resetAlert(1);
      }
    }
  }, [closedAlerts, alerts, shiftOptions, shiftValues, resetAlert, setAlertHandler]);

Let's focus on the first "if" condition. In case of more than one shift group configured in the database, this warning triggers all the time. For example, I have more than one instance of Grafana with completely different shiftGroupUUID's. For each shiftGroupUUID I have 3 shifts configured with the name e.g. "morning", "afternoon", "night". Of course, there should be something that will secure us from duplicating shift names in the same shiftGroupUUID (that's important), but for me there is a big discrepancy between the description of this warning and the condition that must be met.

There should be some function/effect that will check whether shift names are unique in the same shiftGroupUUID. For now, this "if" condition checks if there is more than one shiftGroupUUID (if I understand this code fragment correctly) and then if it meets the condition in which there is more than one - warning is triggered with a description, which for me doesn't indicate the checked condition.

FR: custom "active range" color

Can you please add a feature custom "active range" color?

image

maybe via a standard Grafana color picker

image

because in our dashboards yellow color means "warning"

thanks!

Feature request: Full day selection (other hours)

Hello,

I would like to request the possibility to create a shift that takes 24hrs, but other than 00:00 to 00:00.
For example using:
"startTime": "06:30:00",
"endTime": "06:30:00",
the plugin could detect that the time period contains passing from one day to another.
Selecting 00:00 as startTime and endTime should also select one full day.
This can be achieved using a workaround by selecting 00:00 for startTime and 23:59:59 as endTime.
This workaround does not work for other times, for example selecting 06:30 as startTime and 06:29 as endTime results in interpreting them the other way around (same day, from 06:29 to 06:30).
image
image

Dynamic disable of Real-time shift auto-select

Hi community,

it would be nice to have the possibility to enable / disable the Real-time shift auto-select function by a variable or a shift selector ui element. Sometimes I would see my data for the current shift. But sometimes I would you the same dashboard with a specific time range from my data. Or is there may be already the possibility for the function?

BR
Simon

Suggestion: Add german labels for icon mapping

Hi Isa,

I realy appreciate this plugin. It is a wounderfull addition.

I was trying to debug issue #8 and came across another problem.
We named our shifts Früh, Spät and Nacht. Unfortunately, just one icon was displayed on the night shift button.
The reason for this is that in ShiftSelector.tsx on line 174 the function buttonTypes returns "undefined".

Suggestion:
Add the german labels to utils.ts like this:

const mapping: any = {
'sunset-down': ['afternoon', 'middag', 'früh'],
sunny: ['morning', 'morgen', 'day', 'spät'],
night: ['night', 'nacht'],
}

Looking forward for an update

Datepicker navigation icon not visible

The date picker navigation icons, used to move between months, are present but not visible (you can click on them and the month will change as expected). See attached screen:

image

Shift selector with shift that should go into the next day defaults to the day before.

For example:

I have data from 2024-04-14 00:00:00 to 2024-04-16 12:00:00

2 shift selectors, 05:00:00-17:00:00 and 17:00:00-05:00:00

On day 2024-04-15 I select shift 05-17 and it gives me the data from 2024-04-15 05:00:00 - 17:00:00
When I select shift 17-05 it automatically adjusts the timerange to 2024-04-14 05:00:00 to 2024-04-15 17:00:00 when it should show me 2024-04-15 17:00:00 to 2024-04-16 05:00:00

{ "static": { "shifts": [ { "group": "Group 2", "group_uuid": "group_uuid_2", "uuid": "shift_uuid_1", "label": "Ochtend", "startTime": "05:00:00", "endTime": "17:00:00", "order": 1 }, { "group": "Group 2", "group_uuid": "group_uuid_2", "uuid": "shift_uuid_2", "label": "Avond", "startTime": "17:00:00", "endTime": "05:00:00", "order": 2 } ] } }

Auto shift selector not working

Hey,

We wanted to start using the auto shift plugin, hoping it would help with automatically selecting the right shift. It doesn't seem to do that and I have no clue if thats due to us not using it correctly or something else being wrong. It also doesn't seem to change the timeframe even when having the auto refresh set to 5s.

We are still using Grafana 8.5.20. Any help would be appreciated.

image

Date selection options

Would be very nice if add the next options to Date selection

Optional text (localization)

image

  • Set default value
  • Show and hide option (hide the whole section and apply default value (if not null) else first value two dots).

image

Recommend Projects

  • React photo React

    A declarative, efficient, and flexible JavaScript library for building user interfaces.

  • Vue.js photo Vue.js

    🖖 Vue.js is a progressive, incrementally-adoptable JavaScript framework for building UI on the web.

  • Typescript photo Typescript

    TypeScript is a superset of JavaScript that compiles to clean JavaScript output.

  • TensorFlow photo TensorFlow

    An Open Source Machine Learning Framework for Everyone

  • Django photo Django

    The Web framework for perfectionists with deadlines.

  • D3 photo D3

    Bring data to life with SVG, Canvas and HTML. 📊📈🎉

Recommend Topics

  • javascript

    JavaScript (JS) is a lightweight interpreted programming language with first-class functions.

  • web

    Some thing interesting about web. New door for the world.

  • server

    A server is a program made to process requests and deliver data to clients.

  • Machine learning

    Machine learning is a way of modeling and interpreting data that allows a piece of software to respond intelligently.

  • Game

    Some thing interesting about game, make everyone happy.

Recommend Org

  • Facebook photo Facebook

    We are working to build community through open source technology. NB: members must have two-factor auth.

  • Microsoft photo Microsoft

    Open source projects and samples from Microsoft.

  • Google photo Google

    Google ❤️ Open Source for everyone.

  • D3 photo D3

    Data-Driven Documents codes.