

Amit Sharma, Emre Kiciman, Heyang Gong 编译和解读
<img src="http://imgcdn.atyun.com/2019/06/3-7.png" width=400 /></a>
随着计算系统越来越频繁地,更加积极地介入社会关键领域,例如医疗保健,教育和治理,正确预测和理解这些干预措施的因果效应至关重要。 Without an A/B test, 常规机器学习方法 built on pattern recognition and correlational analyses 不足以进行因果推理。
"DoWhy" is a Python library that aims to spark causal thinking and analysis. DoWhy为因果推断方法提供了统一的界面,并自动测试了许多假设,从而使非专家可以进行因果推断。 快速介绍因果推理见 causalinference.gitlab.io/kdd-tutorial. Documentation for DoWhy is available at microsoft.github.io/dowhy.
Contents
这是 DoWhy 官方教程的编译版本 by Heyang Gong。相对官方版本,该教程
- 在保证意思准确的情况下,尽量翻译英文,调整好文章的组织和目录结构,
- 部分地方加入了一些中文个人理解和解读。
预测模型揭示了将观察数据中的 patterns that connect the inputs and outcome。To intervene, however, we need to estimate the effect of changing an input from its current value, for which no data exists. 这些问题涉及估计“反事实”,在决策场景中很常见。
- Will it work?
- Does a proposed change to a system improve people's outcomes?
- Why did it work?
- What led to a change in a system's outcome?
- What should we do?
- What changes to a system are likely to improve outcomes for people?
- What are the overall effects?
- How does the system interact with human behavior?
- What is the effect of a system's recommendations on people's activity?
回答这些问题需要因果推理。虽然存在许多方法 for causal inference,it is hard to compare their assumptions and robustness of results. DoWhy 做了三点贡献,
- (所有模型假设都显示给出) Provides a principled way of modeling a given problem as a causal graph so that all assumptions are explicit.
- (实现了一个因果推断统一框架) Provides a unified interface for many popular causal inference methods, combining the two major frameworks of graphical models and potential outcomes.
- (可以进行稳健型分析) Automatically tests for the validity of assumptions if possible and assesses the robustness of the estimate to violations.
Requirements
DoWhy support Python 3+. It requires the following packages:
- numpy
- scipy
- scikit-learn
- pandas
- networkx (for analyzing causal graphs)
- matplotlib (for general plotting)
- sympy (for rendering symbolic expressions)
Install the latest release using pip.
pip install dowhyIf you prefer the latest dev version, clone this repository and run the following command from the top-most folder of the repository.
pip install -e .If you face any problems, try installing dependencies manually.
pip install -r requirements.txtOptionally, if you wish to input graphs in the dot format, then install pydot (or pygraphviz).
For better-looking graphs, you can optionally install pygraphviz. To proceed, first install graphviz and then pygraphviz (on Ubuntu and Ubuntu WSL).
sudo apt install graphviz libgraphviz-dev graphviz-dev pkg-config
## from https://github.com/pygraphviz/pygraphviz/issues/71
pip install pygraphviz --install-option="--include-path=/usr/include/graphviz" \
--install-option="--library-path=/usr/lib/graphviz/"
Keep in mind that pygraphviz installation can be problematic on the latest versions of Python3. Tested to work with Python 3.5.
Most DoWhy analyses for causal inference take 4 lines to write, assuming a pandas dataframe df that contains the data:
from dowhy import CausalModel
import dowhy.datasets

# Load some sample data
data = dowhy.datasets.linear_dataset(
    beta=10,
    num_common_causes=5,
    num_instruments=2,
    num_samples=10000,
    treatment_is_binary=True)
DoWhy supports two formats for providing the causal graph: gml (preferred) and dot. After loading in the data, we use the four main operations in DoWhy: model, estimate, identify and refute:
# Create a causal model from the data and given graph.
model = CausalModel(
data=data["df"],
treatment=data["treatment_name"],
outcome=data["outcome_name"],
graph=data["gml_graph"])
# Identify causal effect and return target estimands
identified_estimand = model.identify_effect()
# Estimate the target estimand using a statistical method.
estimate = model.estimate_effect(identified_estimand,
method_name="backdoor.propensity_score_matching")
# Refute the obtained estimate using multiple robustness checks.
refute_results = model.refute_estimate(identified_estimand, estimate,
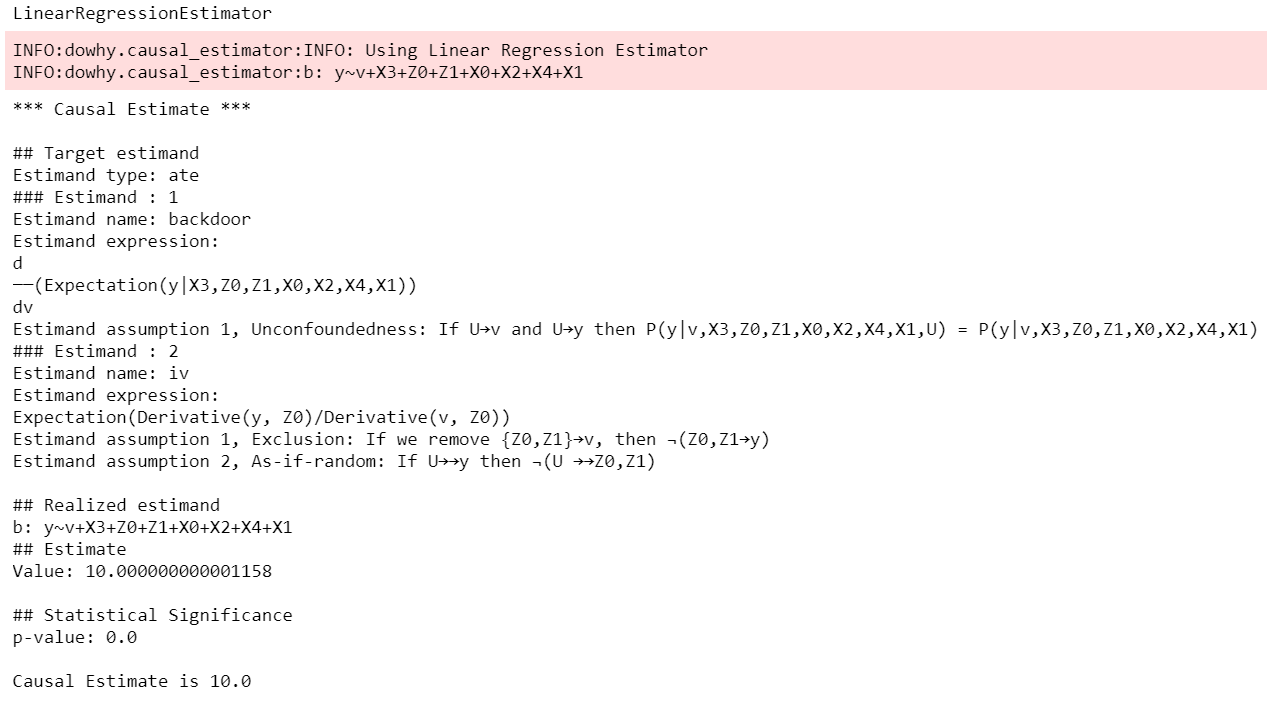
method_name="random_common_cause")DoWhy stresses on the interpretability of its output. At any point in the analysis, you can inspect the untested assumptions, identified estimands (if any) and the estimate (if any). Here's a sample output of the linear regression estimator.
For detailed code examples, check out the Jupyter notebooks in docs/source/example_notebooks, or try them online at Binder.
我们使用该 API 和内置数据集合生成函数,生成用于研究的模拟干预数据。
We've made an even simpler API for dowhy which is a light layer on top of the standard one. The goal
was to make causal analysis much more like regular exploratory analysis. To use this API, simply
import dowhy.api. This will magically add the causal namespace to your
pandas.DataFrame s. Then, you can use the namespace as follows.
import dowhy.api
import dowhy.datasets

data = dowhy.datasets.linear_dataset(beta=5,
    num_common_causes=1,
    num_instruments = 0,
    num_samples=1000,
    treatment_is_binary=True)

# data['df'] is just a regular pandas.DataFrame
data['df'].causal.do(x='v0', # name of treatment variable
                     variable_types={'v0': 'b', 'y': 'c', 'W0': 'c'},
                     outcome='y',
                     common_causes=['W0']).groupby('v0').mean().plot(y='y', kind='bar')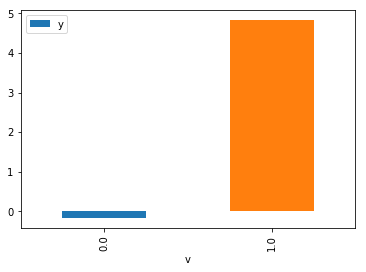
For some methods, the variable_types field must be specified. It should be a dict, where the keys are
variable names, and values are 'o' for ordered discrete, 'u' for un-ordered discrete, 'd' for discrete, or 'c'
for continuous.
Note:If the variable_types is not specified we make use of the following implicit conversions:
int -> 'c'
float -> 'c'
binary -> 'b'
category -> 'd'
Currently we have not added support for time.
The do method in the causal namespace generates a random sample from DataFrame. You can continue to perform the usual DataFrame operations with this sample, and so you can compute statistics and create plots for causal outcomes!
The do method is built on top of the lower-level dowhy objects, so can still take a graph and perform
identification automatically when you provide a graph instead of common_causes.
DoWhy builds on two of the most powerful frameworks for causal inference: graphical models and potential outcomes. It uses graph-based criteria and do-calculus for modeling assumptions and identifying a non-parametric causal effect. For estimation, it switches to methods based primarily on potential outcomes.
DoWhy基于简单的统一语言进行因果推断。因果推断似乎有些棘手,但几乎所有方法都遵循四个关键步骤:
- Model a causal inference problem using assumptions.
- Identify an expression for the causal effect under these assumptions ("causal estimand").
- Estimate the expression using statistical methods such as matching or instrumental variables.
- Finally, verify the validity of the estimate using a variety of robustness checks.
该工作流可以通过DoWhy中的四个关键动词来捕获:
- model
- identify
- estimate
- refute
Using these verbs, DoWhy implements a causal inference engine that can support a variety of methods. model encodes prior knowledge as a formal causal graph, identify uses graph-based methods to identify the causal effect, estimate uses statistical methods for estimating the identified estimand, and finally refute tries to refute the obtained estimate by testing robustness to assumptions.
与其他因果推理的可用软件相比,DoWhy有三个关键不同之处:
- Explicit identifying assumptions
因果假设是DoWhy中的一等公民。
Each analysis starts with a building a causal model. The assumptions can be viewed graphically or in terms of conditional independence statements. Wherever possible, DoWhy can also automatically test for stated assumptions using observed data.
- Separation between identification and estimation
Identification 是因果问题, 而 Estimation 统计问题.
DoWhy respects this boundary and treats them separately. This focuses the causal inference effort on identification, and frees up estimation using any available statistical estimator for a target estimand. In addition, multiple estimation methods can be used for a single identified_estimand and vice-versa.
- Automated robustness checks
What happens when key identifying assumptions may not be satisfied?
因果分析中最关键且经常被跳过的部分 is checking the robustness of an estimate to unverified assumptions, 也就是敏感性分析. DoWhy makes it easy to automatically run sensitivity and robustness checks on the obtained estimate.
最后,DoWhy易于扩展, allowing other implementations of the four verbs to co-exist (we hope to integrate with external implementations in the future). The four verbs are mutually independent, so their implementations can be combined in any way.
下面是有关每个动词的当前实现的更多详细信息。
- Model a causal problem
DoWhy为每个问题创建潜在的因果图模型。这个用于使每个因果假设明确。此图不必是完整---您可以提供部分图形,表示先验有关某些变量的知识。DoWhy自动考虑其余部分变量作为潜在的混杂因素。
Currently, DoWhy supports two formats for graph input: gml (preferred) and dot. We strongly suggest to use gml as the input format, as it works well with networkx. You can provide the graph either as a .gml file or as a string. If you prefer to use dot format, you will need to install additional packages (pydot or pygraphviz, see the installation section above). Both .dot files and string format are supported.
虽然不建议使用,但您也可以 specify common causes and/or instruments directly 而不必指定因果图.
- Identify a target estimand under the model
Based on the causal graph, DoWhy finds all possible ways of identifying a desired causal effect based on the graphical model. It uses graph-based criteria and do-calculus to find potential ways find expressions that can identify the causal effect.
- Estimate causal effect based on the identified estimand
DoWhy supports methods based on both back-door criterion and instrumental variables. It also provides a non-parametric permutation test for testing the statistical significance of obtained estimate.
Currently supported back-door criterion methods.
- Methods based on estimating the treatment assignment
- Propensity-based Stratification
- Propensity Score Matching
- Inverse Propensity Weighting
- Methods based on estimating the response surface
- Regression
Currently supported methods based on instrumental variables.
- Binary Instrument/Wald Estimator
- Regression discontinuity
- Refute the obtained estimate
可以使用多种 refutation methods to verify a causal inference 是使用DoWhy的主要好处。DoWhy supports the following refutation methods.
- Placebo Treatment
- Irrelevant Additional Confounder
- Subset validation
If you find DoWhy useful for your research work, please cite us as follows:
Amit Sharma, Emre Kiciman, et al. DoWhy: A Python package for causal inference. 2019. https://github.com/microsoft/dowhy
Bibtex:
@misc{dowhy,
authors={Sharma, Amit and Kiciman, Emre and others},
title={Do{W}hy: {A Python package for causal inference}},
howpublished={https://github.com/microsoft/dowhy}
year={2019}
}
The projects page lists the next steps for DoWhy. If you would like to contribute, have a look at the current projects. If you have a specific request for DoWhy, please raise an issue here.
This project welcomes contributions and suggestions. Most contributions require you to agree to a Contributor License Agreement (CLA) declaring that you have the right to, and actually do, grant us the rights to use your contribution. For details, visit https://cla.microsoft.com.
When you submit a pull request, a CLA-bot will automatically determine whether you need to provide a CLA and decorate the PR appropriately (e.g., label, comment). Simply follow the instructions provided by the bot. You will only need to do this once across all repos using our CLA.
This project has adopted the Microsoft Open Source Code of Conduct. For more information see the Code of Conduct FAQ or contact [email protected] with any additional questions or comments.