Giter Site home page Giter Site logo

jasonish / evebox Goto Github PK

View Code? Open in Web Editor NEW
416.0 43.0 67.0 8.96 MB

Web Based Event Viewer (GUI) for Suricata EVE Events in Elastic Search

Home Page: https://evebox.org/

License: MIT License

Makefile 0.35% HTML 0.08% Shell 1.82% TypeScript 33.87% PLpgSQL 0.55% Dockerfile 0.05% Rust 62.57% SCSS 0.71%
security netsec suricata ids ips nsm

evebox's Introduction

EveBox

EveBox is a web based Suricata "EVE" event viewer for Elastic Search.

EveBox

Features

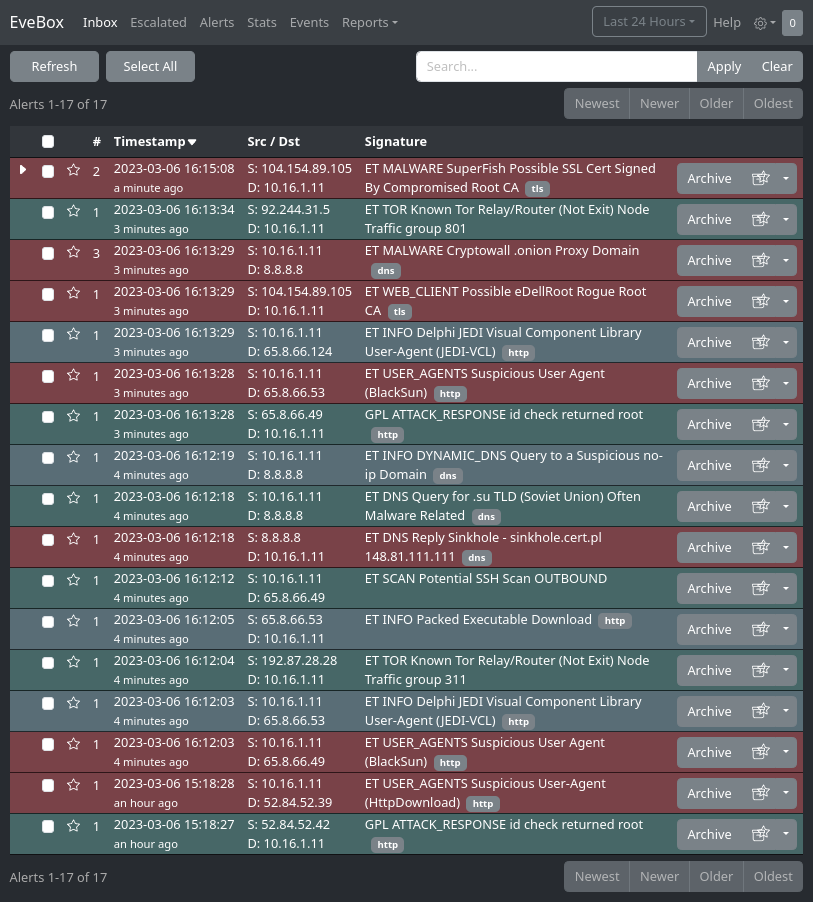
  • A web based event viewer with an "Inbox" approach to alert management.
  • Event search.
  • An agent for sending Suricata events to the EveBox server (but you can use Filebeat/Logstash instead).
  • Embedded SQLite for self-contained installations.

Requirements

  • Suricata - to generate alerts and events.

And one of...

  • An existing ElasticSearch/Logstash (version 7 or greater) setup already handling Suricata events (EveBox has issues with Filebeat indices at this time).
  • Just Elastic Search, using EveBox or the EveBox agent to add events.
  • Nothing - EveBox can use an embedded SQLite database suitable for lower load installations (note: not all features supported yet).
  • A modern web browser.

Installation.

Download a package and run the evebox application against your existing Elastic Search server.

Example:

./evebox server -e http://localhost:9200

Then visit http://localhost:5636 with your browser.

Available downloads including RPM and Debian package repositories can be found at https://evebox.org/#downloads.

SELKS

EveBox is also included in SELKS which provides Suricata and an ELK stack configured and ready to go.

Docker

If you wish to install EveBox with Docker an up to date image is hosted on Docker hub.

Example:

docker pull jasonish/evebox:latest
docker run -it -p 5636:5636 jasonish/evebox:latest -e http://elasticsearch:9200

replacing your http://elasticsearch:9200 with that of your Elastic Search URL. You most likely do not want to use localhost here as that will be the localhost of the container, not of the host.

OR if you want to link to an already running Elastic Search container:

docker run -it -p 5636:5636 --link elasticsearch jasonish/evebox:latest

Then visit http://localhost:5636 with your browser.

Usage

EveBox runs as a server exposing a web interface on port 5636 by default.

With an Existing Elastic Search Server With Events

The basic mode where eve events are being sent to Elastic Search with Logstash and or Filebeat.

evebox server -e http://elasticsearch:9200

With the Embedded SQLite Database

This is useful if you don't have Elastic Search and running EveBox on the same machine as Suricata. It uses an embedded SQLite database for events and is suitable for ligher loads. Currently SQLite does not support reporting.

evebox server -D . --datastore sqlite --input /var/log/suricata/eve.json

More documentation can be found at http://evebox.readthedocs.io/en/latest/.

Building EveBox

EveBox consists of a JavaScript frontend, and a backend written in Rust. To build Evebox the following requirements must first be satisfied:

  • Node.js v18 or newer installed.
  • Latest Rust stable.

First checkout EveBox:

git clone https://github.com/jasonish/evebox.git ~/projects/evebox

Then to build the binary:

make

Or to build a release package:

make dist

Possible Issues

JavaScript heap out of memory

If you get a JavaScript out of memory issue while building, try setting the following environment variable and rebuild:

export NODE_OPTIONS="--max-old-space-size=4096"

Run in Development Mode

./dev.sh -e http://elasticsearch:9200

to run in development mode using an Elastic Search datastore at http://elasticsearch:9200.

The connect your browser to http://localhost:4200. Note this port is different than the EveBox port, as the Angular CLI/Webpack development server is used to serve up the web application with backend requests being proxied to the Go application.

In development mode changes to Go files will trigger a recompile/restart, and changes to the web app will trigger a recompile of the javascript and a browser refresh.

Change Log

See https://github.com/jasonish/evebox/blob/master/CHANGELOG.md .

License

MIT.

evebox's People

Contributors

dependabot[bot] avatar jasonish avatar nicksherron avatar razuz avatar regit avatar

Stargazers

 avatar  avatar  avatar  avatar  avatar  avatar  avatar  avatar  avatar  avatar  avatar  avatar  avatar  avatar  avatar  avatar  avatar  avatar  avatar  avatar  avatar  avatar  avatar  avatar  avatar  avatar  avatar  avatar  avatar  avatar  avatar  avatar  avatar  avatar  avatar  avatar  avatar  avatar  avatar  avatar  avatar  avatar  avatar  avatar  avatar  avatar  avatar  avatar  avatar  avatar  avatar  avatar  avatar  avatar  avatar  avatar  avatar  avatar  avatar  avatar  avatar  avatar  avatar  avatar  avatar  avatar  avatar  avatar  avatar  avatar  avatar  avatar  avatar  avatar  avatar  avatar  avatar  avatar  avatar  avatar  avatar  avatar  avatar  avatar  avatar  avatar  avatar  avatar  avatar  avatar  avatar  avatar  avatar  avatar  avatar  avatar  avatar  avatar  avatar  avatar

Watchers

 avatar  avatar  avatar  avatar  avatar  avatar  avatar  avatar  avatar  avatar  avatar  avatar  avatar  avatar  avatar  avatar  avatar  avatar  avatar  avatar  avatar  avatar  avatar  avatar  avatar  avatar  avatar  avatar  avatar  avatar  avatar  avatar  avatar  avatar  avatar  avatar  avatar  avatar  avatar  avatar  avatar  avatar  avatar

evebox's Issues

Feature: Auto-archive after specific age.

I think it might be useful to have an option to auto-archive events after a certain amount of time (unit of days). Off by default, but can be enabled in the configuration file.

Can't get it to work with Elastic 2.1

Hello, I used to run evebox on top of elastic v1.7.1.
I recently updated to elastic 2.1 and it seems not to work anymore.

I have tried with the following options in the elasticsearch.yml file, without success.
http.cors.enabled: true
#script.disable_dynamic: false
script.inline: on
script.indexed: on

script.disable_dynamic is not supported anymore in elastic 2.1 (elastic/elasticsearch#10274)
It should be replaced by script.inline & script.indexed, but it does not seem to solve the issue when enabled.

I have tried this with with evebox v0.4.0dev without luck...
any idea ?

one click 'show all events for this flow' button

Most of the time we'll have more than one event for a flow, e.g.a http event, fileinfo event and one or more alerts. Or various ssh scan alerts combined with a reputation alert.

I would love to see something that allows me to click on any event and then shows a view of all events related to this flow.

Periodic ping to Elastic Search to determine raw/keyword.

As @regit points out in issue #29, when Evebox starts it connects to Elastic Search to determine if it should do "keyword" or "raw" queries. If ES is not running, it defaults to "keyword".

Instead Evebox should do a periodic ping to ES and update the keyword once it gets a valid response.

per ip address report

I think it could be interesting to have a per IP address report that collects all records for that IP.

e.g.
user agents it used in outgoing http
tls versions it used for outgoing connections

number of flows to and from the ip
bytes/packets from netflows
top alerts/http/tls/dns

dns name(s) that returned this IP
tls sni in incoming to this ip
http hostname incoming to this ip

per subnet report

Pretty much the same report as in #19, but then applied to a subnet. For me it would be fine if it's not exactly a subnet, but something like "192.168.1.*" or simply "192.168.1"

Failed to archive event.

Evebox worked without a hitch until we updated our elasticsearch cluster. Now when I try to archive I get a "Failed to archive event." message. We have updated our elasticsearch.yml to allow CORS and Dynamic Scripting. I'm happy to help troubleshoot this if you can point me to any debug logs that I can turn on (or view).

We do not run ELK on the same box as evebox. We have a dedicated cluster set up. I'm using the latest release of evebox from master.

view all in inbox not remembered across actions

By default inbox shows 100 events. At the top it says 'Showing 1-100 of 173.' I use the Drop down on the left to show all: 'view all'. Now I see 'Showing 1-173 of 173'.

When I archive an event, it jumps back to 'Showing 1-100 of 172.'.

Expected behavior: remember 'view all'.

Not sure how the user should be able to revert the option though. Perhaps replace the 'view all' by 'view 100' or something similar when viewing all.

Auto-archive events matching filter

Related comment:
#51 (comment)

Provide a way to auto-archive (mute) alerts probably matching a filter. Most likely SID, SID/src-ip, or SID/src-ip/dest-ip as thats the aggregation that EveBox uses.

Events matching this filter will never show up in the evebox and be archived immediately.

Easier done if the EveBox agent is used as events go through the server. Will have to be done periodically or on the fly for logstash/elasticsearch setups.

colorization of payload display

At least for HTTP, it would be nice if there could be some kind of colorization: highlight things generally interesting such as URL, User-Agent, etc.

by source view for alerts

I would be interested in having a 'by source' tab in alerts. Then somehow in a compressed way show the alerts that apply to the source.

Color should indicate alert with highest severity. Highest severity event should be listed first.

I often see multiple events for a single host. E.g. ssh scan detected, weird ssh banner, host with bad rep, etc.

inbox time filter not applied

When in 'escalated' and clicking 'inbox' from there, the time filter is lost. It says 24h, but older events are shown as well. 'Refresh' applies the filter again.

pfSense Suricata logs to Eve

I might have a unique use case but here it is.

I have a pfSense router that runs suricata, I'm moving the eve.json logs to logstash using filebeats.
How can I get the Flow, Payload and Packet data to show on the Eve website with the [PCAP] link to pull pcap.

alerts report should show full range

If I ask an alert report for 1 hour and I only have 2 alerts in the interval, I have something which is displayed like the following screenshot:

screenshot from 2016-09-02 22-44-12

It would be better to display the full 1h range.

Reports archive success when it actually fails

From the log:

Mar 27 23:15:07 evebox.codemonkey.net evebox[11681]: 2017-03-27 23:15:07 (alertgrouphandlers.go:63) <Error> -- : Post http://localhost:9200/evebox-*/_search?scroll=1m: dial tcp: lookup localhost: too many open files
Mar 27 23:15:07 evebox.codemonkey.net evebox[11681]: 2017-03-27 23:15:07 (eventservice.go:246) <Error> -- Failed to initialize scroll: : Post http://localhost:9200/evebox-*/_search?scroll=1m: dial tcp: lookup localhost: too many open files
Mar 27 23:15:07 evebox.codemonkey.net evebox[11681]: 2017-03-27 23:15:07 (alertgrouphandlers.go:63) <Error> -- : Post http://localhost:9200/evebox-*/_search?scroll=1m: dial tcp: lookup localhost: too many open files

From the UI it looks successful, but it failed.

de-escalate issue

Go to escalated view. Click on an escalated event. Click 'de-escalate'. Click 'back'. We are again in the escalated view. The 'un-escalated' event is still visible. It's star isn't solid though, and after a refresh the event is gone.

can't archive/escalate events after upgrade to ES5

Just upgraded to ES5 from ES2. I can view and search events, but when I archive/escalate them it doesn't work. On archive they disappear from the view initially, but reappear after a refresh.

Console output looks a bit strange with the nil events:

2017-04-30 11:41:02 (evebox.go:112) <Info> -- No command provided, defaulting to server.
2017-04-30 11:41:02 (server.go:156) <Info> -- This is EveBox Server version 0.7.1dev (rev: f9cde6b)
2017-04-30 11:41:03 (geoip-service.go:44) <Warning> -- Failed to initialize geoip database: no database files found
2017-04-30 11:41:03 (configdb.go:52) <Info> -- Using in-memory configuration DB.
2017-04-30 11:41:03 (sqlmigrator.go:79) <Info> -- Updating database to version 0.
2017-04-30 11:41:03 (sqlmigrator.go:79) <Info> -- Updating database to version 1.
2017-04-30 11:41:03 (server.go:271) <Info> -- Configuring ElasticSearch datastore
2017-04-30 11:41:03 (server.go:273) <Info> -- Using ElasticSearch URL http://localhost:9200
2017-04-30 11:41:03 (server.go:275) <Info> -- Using ElasticSearch Index logstash.
2017-04-30 11:41:03 (elasticsearch.go:100) <Info> -- Event base index: logstash
2017-04-30 11:41:03 (elasticsearch.go:101) <Info> -- Event search index: logstash-*
2017-04-30 11:41:03 (elasticsearch.go:227) <Info> -- Elastic Search keyword initialized to "keyword"
2017-04-30 11:41:03 (server.go:294) <Info> -- Connected to Elastic Search (version: 5.3.2)
2017-04-30 11:41:03 (server.go:133) <Info> -- Session reaper started
2017-04-30 11:41:03 (server.go:167) <Info> -- Authentication disabled.
2017-04-30 11:41:03 (server.go:278) <Info> -- Listening on 0.0.0.0:5636
2017-04-30 11:41:16 (anonymous.go:64) <Info> -- Logging in anonymous user from 192.168.1.6:57812
2017-04-30 11:57:43 (eventservice.go:358) <Info> -- Updated <nil> events, failures = false
2017-04-30 11:57:44 (eventservice.go:358) <Info> -- Updated <nil> events, failures = false

Debian package upgrade failure

I'm using packages on bintray on Debian, and upgrade is failing since recently:

# apt-get upgrade evebox
[...]
Preparing to unpack .../evebox_1%3a0.6.2~dev1492493921_amd64.deb ...
Unpacking evebox (1:0.6.2~dev1492493921) over (1:0.6.1~dev20170401053041) ...
Setting up evebox (1:0.6.2~dev1492493921) ...
Warning: The home dir /var/lib/evebox you specified already exists.
adduser: The user `evebox' already exists. Exiting.
dpkg: error processing package evebox (--configure):
 subprocess installed post-installation script returned error exit status 1
Errors were encountered while processing:
 evebox
E: Sub-process /usr/bin/dpkg returned an error code (1)

Thanks

handle missing signature message

If the signature has no message (msg), the alert record won't have it either. Evebox currently shows an empty 'signature' in the inbox and "ALERT: " as the title in the alert view.

I think in such cases it would be good to have something like "ALERT: sid XXXX" perhaps with gid and rev included.

Lookup sources

Hi,

Thanks for your nice job, evebox is efficient and useful for us.
Would you think it possible to add, as it exist in Snorby, a lookup source feature.
You already have an "ip report" link in the drop down menu near an ip address, you might add a customizable field to point to any site one prefer to have info about an ip address, like https://www.robtex.com/?dns=${ip}.

Thanks !

Index and show rules

If evebox is running on the same host as suricata it would be possible to parse the rule directory and show the matched rules in the webinterface.

No alert showing in Inbox nor Alert

Hi,

I've used evebox for a few weeks with ease and since this morning, I have no more alerts rising in Inbox nor Alert tabs.

If I choose "Event type:alert" in Events tab I can see some alerts, I also can find alert in kibana if filtering on event_type:alert

I've updated evebox to last version (This is EveBox version 0.6.0dev (Rev: dc36c6a). )

I think it might be linked to the fact that I've changed the elasticsearch server to a new computer today, but as there's no configuration file, I don't know where to look at.

Thanks for your help.

show wrong Timestamp

Hi,
have here EveBox version 0.6.0dev (Rev: 1ab8606) and ES 2.4.
EveBox show always the current time but not the alert creation time.
evebox_timestamp-01

When i look at the details of the alarm, timestamp is missing.
However, in the Json file, this is displayed correctly.
evebox_timestamp-02

thx for any help here.
Stefan

Spinning wheel for inbox with current docker image.

After following the directions for starting up the container, I get the giant spinning wheel of gray balls. I'm using build bauhyagtfhhiu5mqks35vvr, from 2016-07-28T15:13:59.828Z.

I've tried to get more details but do not see anywhere that logs are being generated. When I log into the running container with sh, I can perform a wget on our elasticsearch server at port 9200, and netstat shows an active connection.

Is there another location inside the container where I might be able to get additional logs to help troubleshoot?

when expanding aggregated event from inbox, limit to events in inbox

When I click on the number indicating the number of events that are aggregated, I'm expecting to see only those events. In practice the search is based on sid+srcip+dstip, so it will contain archived events as well.

Perhaps only displaying events that are in the inbox would be better. Alternatively, maybe use a different color for the archived events.

Archive function does not work

On EveBox version 0.6.0dev (Rev: 1ab8606) and ES 2.4, Archive function does not work.
If i archive a single event, this is displayed again in the Inbox / Alerts after the refresh.

Perhaps a problem with the time stamp:
show wrong Timestamp

If i want to archive all events, i get an exception in ES.
RemoteTransportException[[Numinus][192.168.1.67:9300][indices:data/read/search[phase/query]]]; nested: EsRejectedExecutionException[rejected execution of org.elasticsearch .transport.TransportService$4@72c534b5 on EsThreadPoolExecutor[search, queue capacity = 4000, org.elasticsearch.common.util.concurrent.EsThreadPoolExecutor@1ebae248[Runnin g, pool size = 10, active threads = 10, queued tasks = 4000, completed tasks = 13493621]]]; Caused by: EsRejectedExecutionException[rejected execution of org.elasticsearch.transport.TransportService$4@72c534b5 on EsThreadPoolExecutor[search, queue capacity = 4000 , org.elasticsearch.common.util.concurrent.EsThreadPoolExecutor@1ebae248[Running, pool size = 10, active threads = 10, queued tasks = 4000, completed tasks = 13493621]]]

thx for any help here.
Stefan

Getting HTTP/1.1 404 Not Found while archiving event

I sent a request to archive an event to the url: /api/1/event/AVyWHzgsJ-3JxxYdx60x/archive and in return I am getting 404 not found. I am trying to implement Evebox web app on my application by calling api's. Stuck into archiving and escalating events.

This issue is not specifically with Evebox web app. More like a query. Thank you for the awesome work on Evebox.

should escalate remove an event from the inbox?

When going through the inbox I tend to either 'archive' (event isn't interesting), or 'escalate' (lets look at it later). I wonder if it makes sense if the latter would also remove it from the inbox.

Or perhaps an 'escalate and archive' button would do. Archived events that are escalated are still accessible in the 'escalated' pane.

Alert commenting functionality

We very much like the direction evebox is taking, thanks Jason!
One feature we're missing is a possibility to leave small comments/notes to alerts (or groups thereof). I'm thinking of something like the tags you're already using, but with user definable content. Something like:

    "comments": [
      "Tue, 15 Nov 2016 11:41:27 GMT: Comment 1",
      "Tue, 15 Nov 2016 11:42:36 GMT: Comment 2"
    ]

They don't need to be editable after saving them, another comment to the same alert would just be appended to the array.
Do you think this is feasible?

should "Archive" work? ... coexist with other indices?

(1)
When I click "Archive" nothing seems to happen ... is there some setup I'm missing?
"Delete" does work, and sometimes "Star".
What should happen after clicking "Archive" ?
... are the events archived into elasticsearch or a file ?
UPDATE: I see now, it just removes "inbox" from "tags" ... please ignore the above.
What is the difference between Inbox and Alerts ?
UPDATE: Alerts show everything, but Inbox only shows "tags" with inbox ... ignore, again.

(2)
I think the following affected and lead to my confusion about (1) above.
Evebox doesn't seem to co-exist with other indices, this is from the ES log file:

[2014-11-16 06:31:21,850][DEBUG][action.search.type       ] [node_es_134]
 [music_application-development][0], 
node[RiLDW_xpQOWm93OnyNZbBw], [P], s[STARTED]: Failed to execute [org.elasticsearch.action.search.SearchRequest@64bd49f0] lastShard [true]
org.elasticsearch.search.SearchParseException: [music_application-development][0]: query[filtered(+ConstantScore(*:*))->+*:* +cache(event_type:alert) +cache(tags:starred)],from[0],size[200]: Parse Failure [Failed to parse source [{"query":{"filtered":{"query":{"bool":{"must":{"query_string":{"query":"*"}}}},"filter":{"and":[{"match_all":{}},{"term":{"event_type":"alert"}},{"term":{"tags":"starred"}}]}}},"size":"200","from":0,"sort":[{"@timestamp":{"order":"desc"}}]}]]

... notice the reference to the "music_application-development" index, whereas it should use only:

"_index": "logstash-2014.08.19",
"_type": "eve-json",

... or any other "logstash-*" indices, but ignore all other indices.
In a cluster or even just a node there probably will be other indices unrelated to evebox.

No mapping found for [flow.age] in order to sort on

Im getting a lot of ES errors like this while loading reports/flow page:

RemoteTransportException[[Kid Colt][127.0.0.1:9300][indices:data/read/search[phase/query]]]; nested: SearchParseException[failed to parse search source [{"aggs":{"topFlowsByAge":{"top_hits":{"size":10,"sort":[{"flow.age":{"order":"desc"}}]}}},"query":{"bool":{"filter":[{"exists":{"field":"event_type"}},{"term":{"event_type":"flow"}},{"range":{"@timestamp":{"gte":"2016-12-27T15:22:16+01:00"}}}]}},"size":0,"sort":[{"@timestamp":{"order":"desc"}}]}]]; nested: SearchParseException[No mapping found for [flow.age] in order to sort on];

wrong / old DNS records read from suricata DNS logs

Hi,
thank you for your nice tool evebox.
But it is not the best solution, the DNS Records from Suricata (DNS type) to read.
Here there are often old, false or expired DNS data and thereby
displays this incorrect DNS records in evebox which can be quite confusing to.

improved dumpy integration

It would be nice to have a direct link to a dumpy generated pcap, instead of first opening the dumpy web page. Perhaps some sane defaults about the timerange can be used.

Additionally, if flow/netflow records are enabled perhaps it's possible to correlate them with the alert record, and pass the (net)flow start/end times to dumpy as the duration.

escalate issues

When clicking on 'escalate' from an alert view nothing happens.

Additionally, when I click on 'Escalated' from the alert view, I get the results for 'Inbox' even though 'Escalated' on top is highlighted.

elasticsearch 5

Hi,
It seems that elasticsearch 5 breaks evebox.
Any plans about supporting latest ES ?
If it can help here is the error message:
no [query] registered for [filtered]
Thanks !

Cannot Escalate Standard Events

When I click "Escalate" on standard events, they do not show in Escalated. Only alerts show. Would like to be able to Escalate standard events as well.

size parameter from config file ist not applied correct.

If you change the number of elements to see on a page, the calculation of the start address of the next junk is calculated wrong.
With size= 200 I would expect start addresses 1, 201, 401. But I get 1, 101,201,301 ...
The number of columns is always correct.

auto reloading temporary makes archived events reappear

My server is slow, and when archiving a lot of events Evebox works on it for a while. Think about 30 to 60 seconds. During this time the auto refresh shows my recently archived events again. When Evebox processed all events the next refresh hides them again.

Pager not working

We don't get the pager to work (next / prev buttons). E.g. says it's on events 101 to 200, but in fact still shows first page (i.e latest events).

display blocked/allowed

When Suricata is in IPS mode, it may log that some traffic is blocked:

    "alert": {
      "action": "blocked",
      "gid": 1,
      "signature_id": 2500032,
      "rev": 4072,
      "signature": "ET COMPROMISED Known Compromised or Hostile Host Traffic group 17",
      "category": "Misc Attack",
      "severity": 2
    },

Other than in the JSON view, this is not displayed. I would like to get a clear indication of this both in the inbox view and the detailed event view.

try to find relevant DNS data for transaction

If we have a http event, we generally know a host name, source and destination ip.

I think it could be very useful if evebox can show the most likely dns tx that resulted in the 'dest_ip'.

I guess in the common case you could search for src_ip, dest_ip as the answer in dns, the hostname as the A/AAAA/CNAME record... in a timeframe of a couple of seconds before the start of the flow.

Recommend Projects

  • React photo React

    A declarative, efficient, and flexible JavaScript library for building user interfaces.

  • Vue.js photo Vue.js

    ๐Ÿ–– Vue.js is a progressive, incrementally-adoptable JavaScript framework for building UI on the web.

  • Typescript photo Typescript

    TypeScript is a superset of JavaScript that compiles to clean JavaScript output.

  • TensorFlow photo TensorFlow

    An Open Source Machine Learning Framework for Everyone

  • Django photo Django

    The Web framework for perfectionists with deadlines.

  • D3 photo D3

    Bring data to life with SVG, Canvas and HTML. ๐Ÿ“Š๐Ÿ“ˆ๐ŸŽ‰

Recommend Topics

  • javascript

    JavaScript (JS) is a lightweight interpreted programming language with first-class functions.

  • web

    Some thing interesting about web. New door for the world.

  • server

    A server is a program made to process requests and deliver data to clients.

  • Machine learning

    Machine learning is a way of modeling and interpreting data that allows a piece of software to respond intelligently.

  • Game

    Some thing interesting about game, make everyone happy.

Recommend Org

  • Facebook photo Facebook

    We are working to build community through open source technology. NB: members must have two-factor auth.

  • Microsoft photo Microsoft

    Open source projects and samples from Microsoft.

  • Google photo Google

    Google โค๏ธ Open Source for everyone.

  • D3 photo D3

    Data-Driven Documents codes.