© Javier Serna, Jesús Hernández and ARYSO group.
Please cite:
This is a semi-automatic tool designed to estimate the rotational velocity (vsini), using spectral lines of high-resolution spectra. The code was developed in Python 3.7 and the GUI in Qt 5.
- Add a new column with the relative error into Fourier.out
- Pop-up notifying error in line fitting. Suggest choosing another line or report as a non-detection line.
-
Gaussian Fitting is done for the spectral line of interest (Automatic selection of the center and width of the line).
-
Automatic saving at the event file "Fourier.out". The output file contains (1) The name of the input file, (2) date, (3) time, (4) line mid-wave, (5) line width, (6) Spectral resolution, (7) Limb-Darkening coefficient, (8) vsini in km/s, (9) vsini uncertainty in km/s.
-
Plot the histogram of vsini measures.
This tool is compatible with Python>2.7 on Linux, Mac, and Windows. Some packages are necessary for their proper operation.
- git
- Pandas
- Matplotlib.
- Tk
- Scipy
- PyQt5
- LMFIT
In case of not having any dependency, we suggest to install it in this way:
$ sudo apt install git
$ sudo apt install python-pandas
$ sudo apt install python-matplotlib
$ sudo apt install python-tk
$ sudo apt install python-scipy
$ sudo apt install python-pyqt5
$ sudo apt install python-lmfit
If you have an environment for Python> 2.7 (e.g., anaconda). The installation could be done in this way:
~(env)$ pip install pandas
~(env)$ pip install matplotlib
~(env)$ pip install tk
~(env)$ pip install scipy
~(env)$ pip install pyqt5
~(env)$ pip install lmfitFirst of all, we are going to create a folder where we will download the package:
$ mkdir Fourier
$ cd Fourier
$ git clone https://github.com/javiserna/vsini
$ cd vsini
and Execute:
$ python vsini.pyThe graphical interface of the program will appear
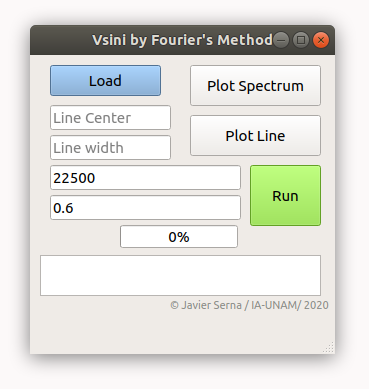
By default, the spectral resolution (R=22500) and limb darkening coefficient (0.6). These can be changed as the user requires.
Please press the "Load" button to get the spectra. CSV format for the input file is required, two columns of information, "col1": Wavelength and "col2": Flux. (e.g., load our test spectra "spec_to_test.csv").
Press the "Plot Spectrum" button to plot the input spectra.
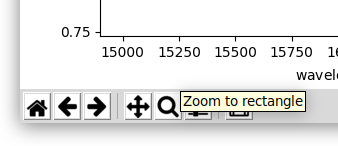
Use the “o” key and left-click to zoom in on the line of interest, or press the "zoom to rectangle" icon.
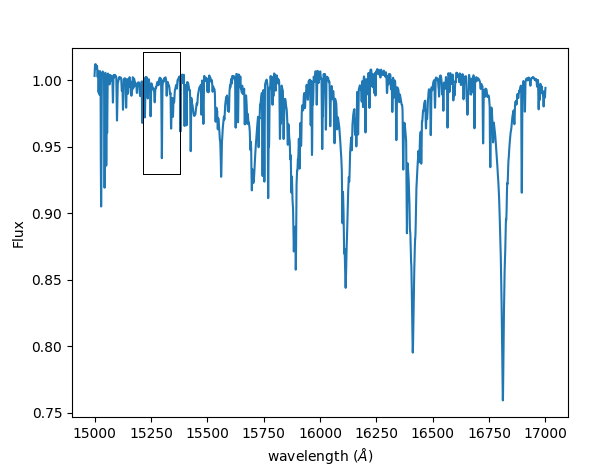
On each side of the line, press double click (A double click displays a vertical red line). When it is done, the program performs a Gaussian fit to the spectra within the defined window. It computes the midwave of the line and width as 3 sigma level. These parameters are updated to the text boxes "Line Center" and "Line Width" in the main window, once the user presses the "q" key.
Once the spectral line is selected, a visual inspection is necessary to check any issue (e.g., mixed lines, bad normalization, bad pixels, telluric lines, etc.). Press the "Plot Line" button, to plot the spectral line that will be used to measure vsini.
Once it is certain that the line does not present any problem. Let's continue to the next step (look at recommendations).
By pressing the "Run" button, vsini estimation is made. In the end, the tool plots a histogram with all random estimations of vsini. by pressing the "q" key, vsini and their uncertainty are loaded at the main window. Finally, all the information is saved in the event file "Fourier.out".
Once we have finished our measurements, then close the window and execute:
$ python results.pyThis script will organize the historical measurements located in the file "Fourier.out" For the set of spectra imported and the set of lines processed by the user. Finally, the user will have a file called "results.csv" with the spectra name, vsini, and vsini uncertainty.
© Instituto de Astronomía / UNAM (Ensenada, B.C, Mexico)
15 September 2020


