Giter Site home page Giter Site logo

5.4-lab-powerbi's Introduction

Ironhack logo

Lab | Power BI

Power BI logo

Introduction

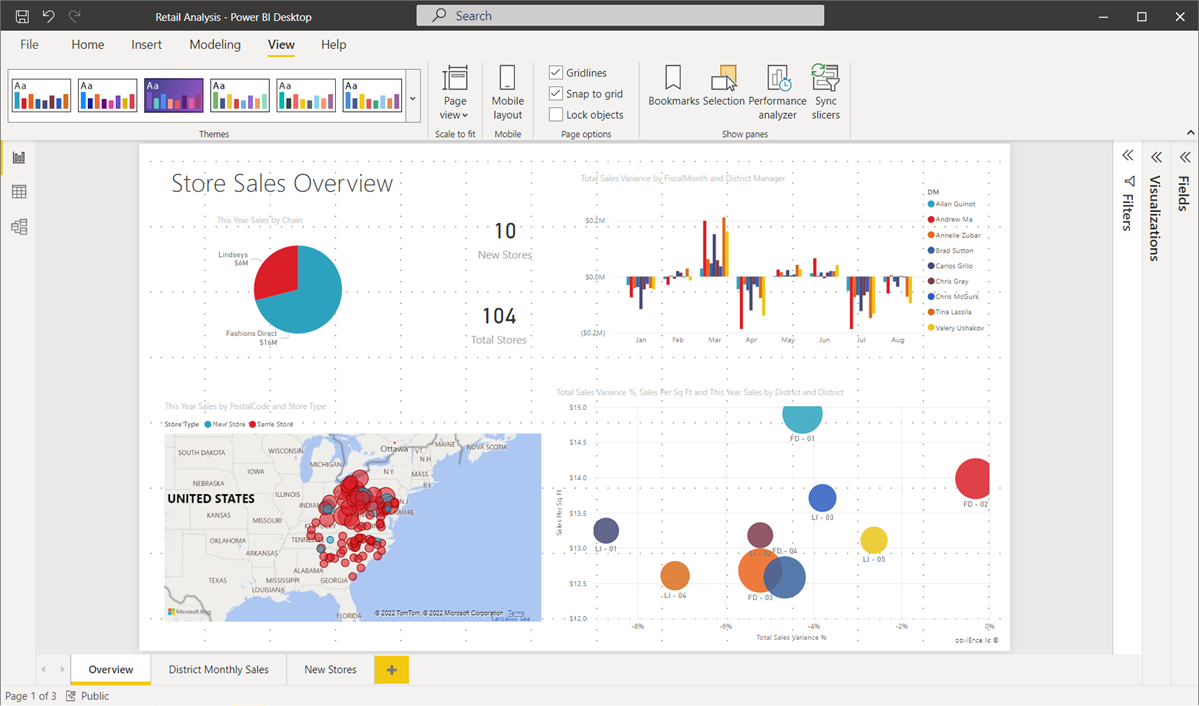
Power BI as Tableau is a data visualization tool which provides pictorial and graphical representations of data.

Your goal in this lab is to create a Power BI dashboard that shows the insights you find useful from de given data.

Your data

In the data folder you will find the following files:

1. classicmodels.sql : the classicmodels database (you can import it directly if you are using tableau desktop)

2. ERD.png : the ERD of the classicmodels database

3. .xlsx file : This excel file contains the data displayed in several sheets inside the file. You'll have to build the relationships between tables on your own.

Getting Started

Challenge 1

Open Power BI in your laptop and import the data.

Create at least 5 different figures explaining different insights, pay attention to the details, choose the proper figures and/or tables, build the figures coherently with each other (example: if china is red in a graph it shoul be associated to red everywhere).

Challenge 2

Create a dashboard where you structure the info in the sheets in a way that everything make sense, it's easily readable and self explanatory. It must have at least two pages.

Deliverables

Export the dashboard to a .pbix file and upload it to your Github repository.

πŸ”₯ In case Github canΒ΄t handle your huge dashboard... πŸ”₯ Export your dashboard to pdf or screenshot each page and paste it in a Power Point presentation.

Add this file to your repository.

Submission

Add your deliverables to git. Then commit, add and push your branch to the remote.

Don't forget to create a pull request!

πŸ’€(In case you have doubts about the pull request click here)

Resources

πŸš€Power BI official learning

πŸš€Power BI in Youtube

πŸš€Power BI templates

πŸš€Markdown format cheatsheet

5.4-lab-powerbi's People

Contributors

fominayasg avatar jgchaparro avatar

Recommend Projects

  • React photo React

    A declarative, efficient, and flexible JavaScript library for building user interfaces.

  • Vue.js photo Vue.js

    πŸ–– Vue.js is a progressive, incrementally-adoptable JavaScript framework for building UI on the web.

  • Typescript photo Typescript

    TypeScript is a superset of JavaScript that compiles to clean JavaScript output.

  • TensorFlow photo TensorFlow

    An Open Source Machine Learning Framework for Everyone

  • Django photo Django

    The Web framework for perfectionists with deadlines.

  • D3 photo D3

    Bring data to life with SVG, Canvas and HTML. πŸ“ŠπŸ“ˆπŸŽ‰

Recommend Topics

  • javascript

    JavaScript (JS) is a lightweight interpreted programming language with first-class functions.

  • web

    Some thing interesting about web. New door for the world.

  • server

    A server is a program made to process requests and deliver data to clients.

  • Machine learning

    Machine learning is a way of modeling and interpreting data that allows a piece of software to respond intelligently.

  • Game

    Some thing interesting about game, make everyone happy.

Recommend Org

  • Facebook photo Facebook

    We are working to build community through open source technology. NB: members must have two-factor auth.

  • Microsoft photo Microsoft

    Open source projects and samples from Microsoft.

  • Google photo Google

    Google ❀️ Open Source for everyone.

  • D3 photo D3

    Data-Driven Documents codes.