Project list:
- Python: Hackathon Winner (Banana Map)
- Python: Machine Learning Regression
- R and Shiny: Analytics, Visualization, and Web Application
- SQL: Database Design and Management
- R and Wordpress: Analytics and Urban Informatics
Carbon Emission and Energy calculator of various transportation routes
The Banana Map is a web application that was created for the Northeastern University 2023 Hackathon within 24 hours. The theme for the Hackathon was "Tools of the Future" and our focus was climate change and environmental sustainability. The objective of our product is to provide incentives and day-to-day comparison for the user on their transportation choice. Transportation is the greatest contributor (~27%) of greenhouse gases emission in the United States. Hence, the first step of heading towards more sustainable life is to wisely choose our transportation option. For this project, we are comparing 4 transportation modes: driving, busing, walking, and cycling.
Screenshot of web interface
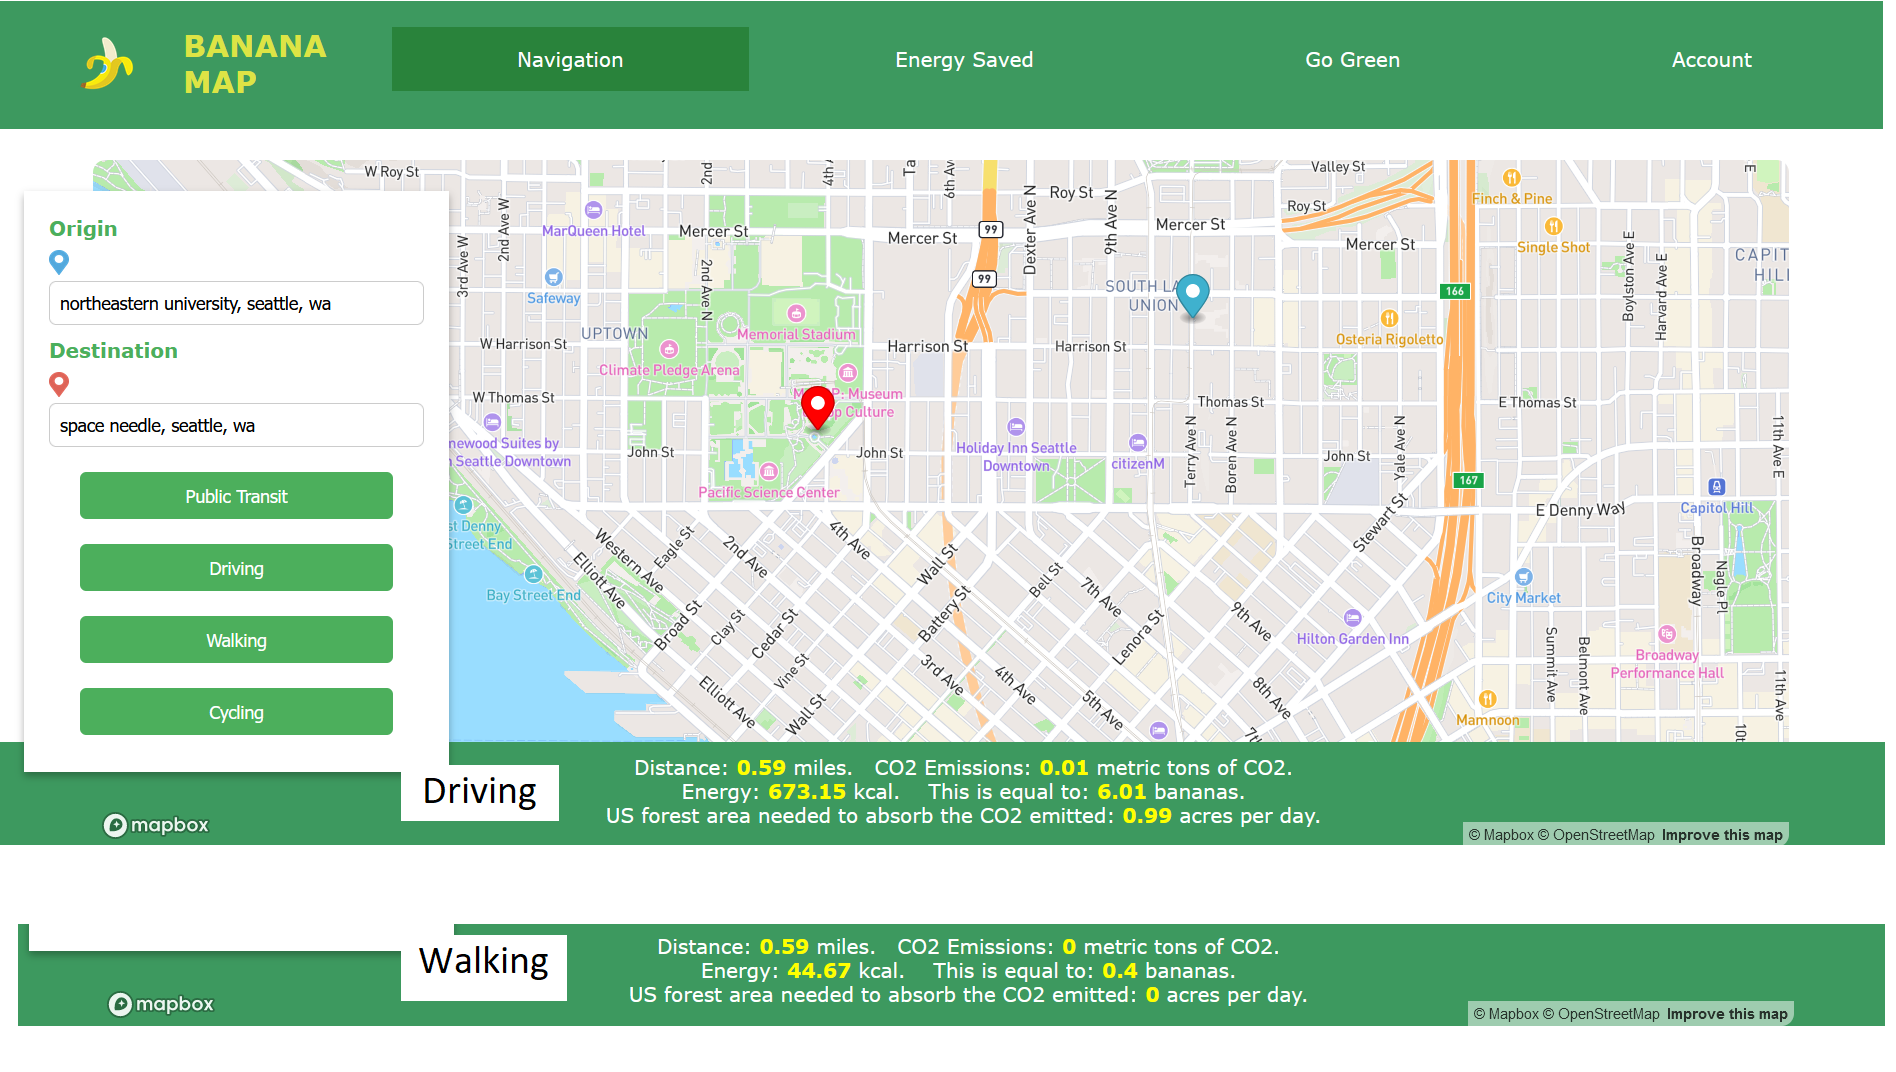
The programming languages used are Python and JavaScript. Future development of this project includes cross-platform application, user rewards system (getting banana points!), and tracking other carbon saving choices such as household electricity and waste management.
Team Banana: Jake Van Meter, Jessica Tanumihardja, Shreya Goyal, Randy Ramli, Zhiwei Zhou, Chunyun Zhang
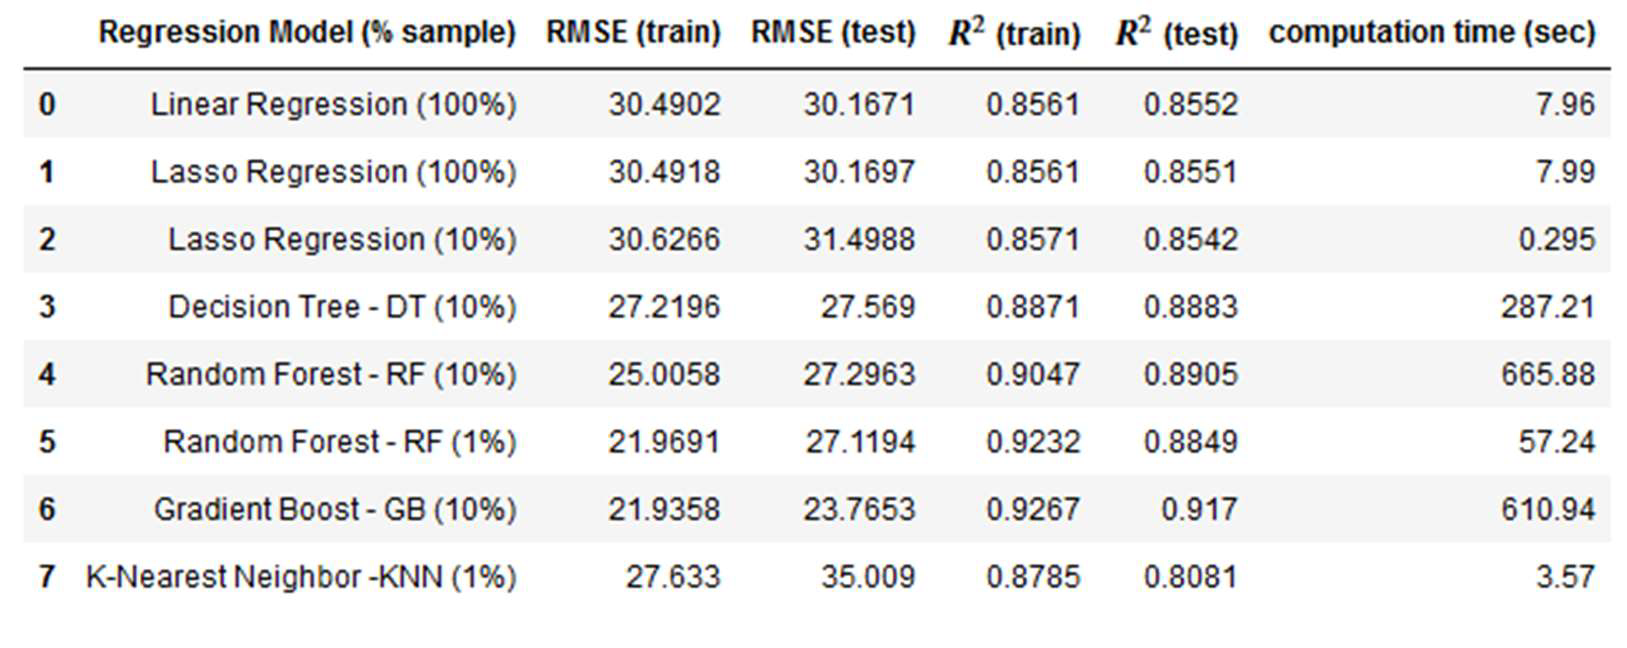
This project is an individual semester-long project for IE 7300 Statistical Learning for Engineering class. The project objective is to design, implement, evaluate, and validate machine learning models using Python programming custom functions (from scratch). The dataset is The Beijing Air Quality Data from the UCI Machine Learning Repository. The business problem to be addressed is training the custom regression models and predicting the target variable values (PM2.5). The objective of this project is to perform statistical analysis on this dataset to find a regression equation to predict the fit and and conclude which regression equation is the best fit for each parameter.
The summary of the performance metrics for each model tested is listed below. The best model is gradient boosting as it has the lowest RSME and highest R-squared values. If computational power and time are restricted, lasso regression is also comparable regression model.
Click here to go to the Shiny App
Co-Winner of the Spring 2023 Class Projects
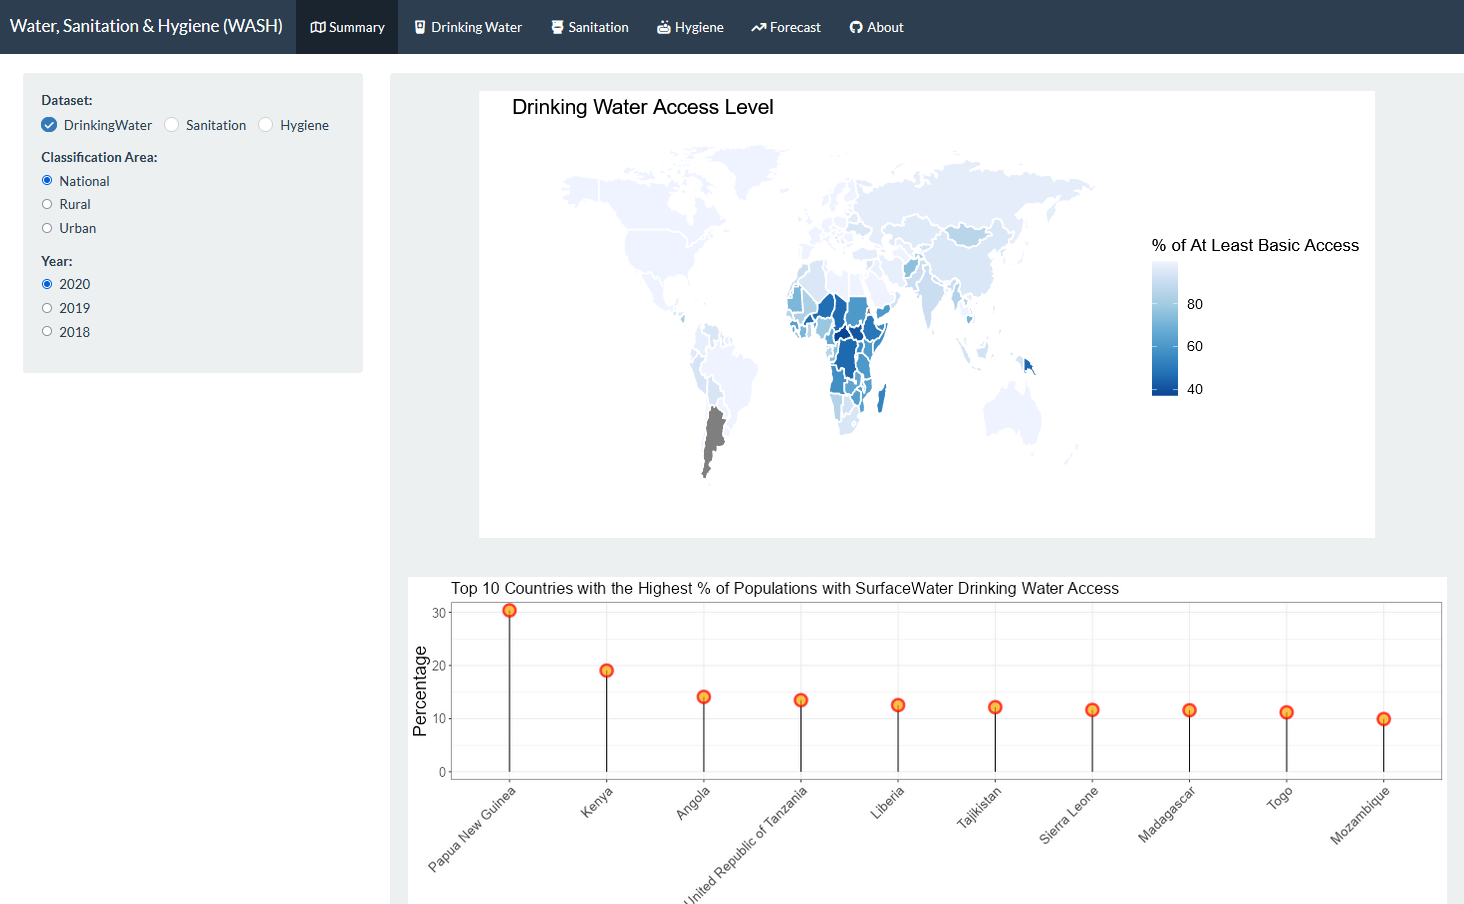
This project proposes a comprehensive analysis of world household drinking water, sanitation, and hygiene. The findings will inform evidence-based recommendations and prioritization for worldwide household safe drinking water, sanitation, and hygiene services, to achieve sustainable development goals.
This is a group project consisting of 4 people for IE6600 Computation and Visualization in R. All the data preprocessing and visualization are conducted in RStudio and the web application is pushed from RShiny. The chosen dataset is WASH data, originated from and managed by WHO/UNICEF Joint Monitoring Programme. The datasets contain information on each country’s population, facilities, sewer systems, etc. The values are classified into three areas: national, urban, and rural.
Various R analytical skills are utilized in this project including data cleaning, tidying, dealing with missing values, parsing and merging, visualization, forecasting, and deploying the finished work in R Shiny Web Application. The visualization includes choropleth world maps, lollipop plots, bar charts, line plots, and donut charts. R Shiny interactive widgets include a tab inset, drop-down menu, and checkbox so the user can filter desired plots. Time series forecasting to predict 2030 "At Least Basic" variable value is also provided.
Screenshot of R Shiny web application
Team Shabu Shabu: Tomoki Kyotani, Jessica Tanumihardja, Xinan Wang, Jiayue Han
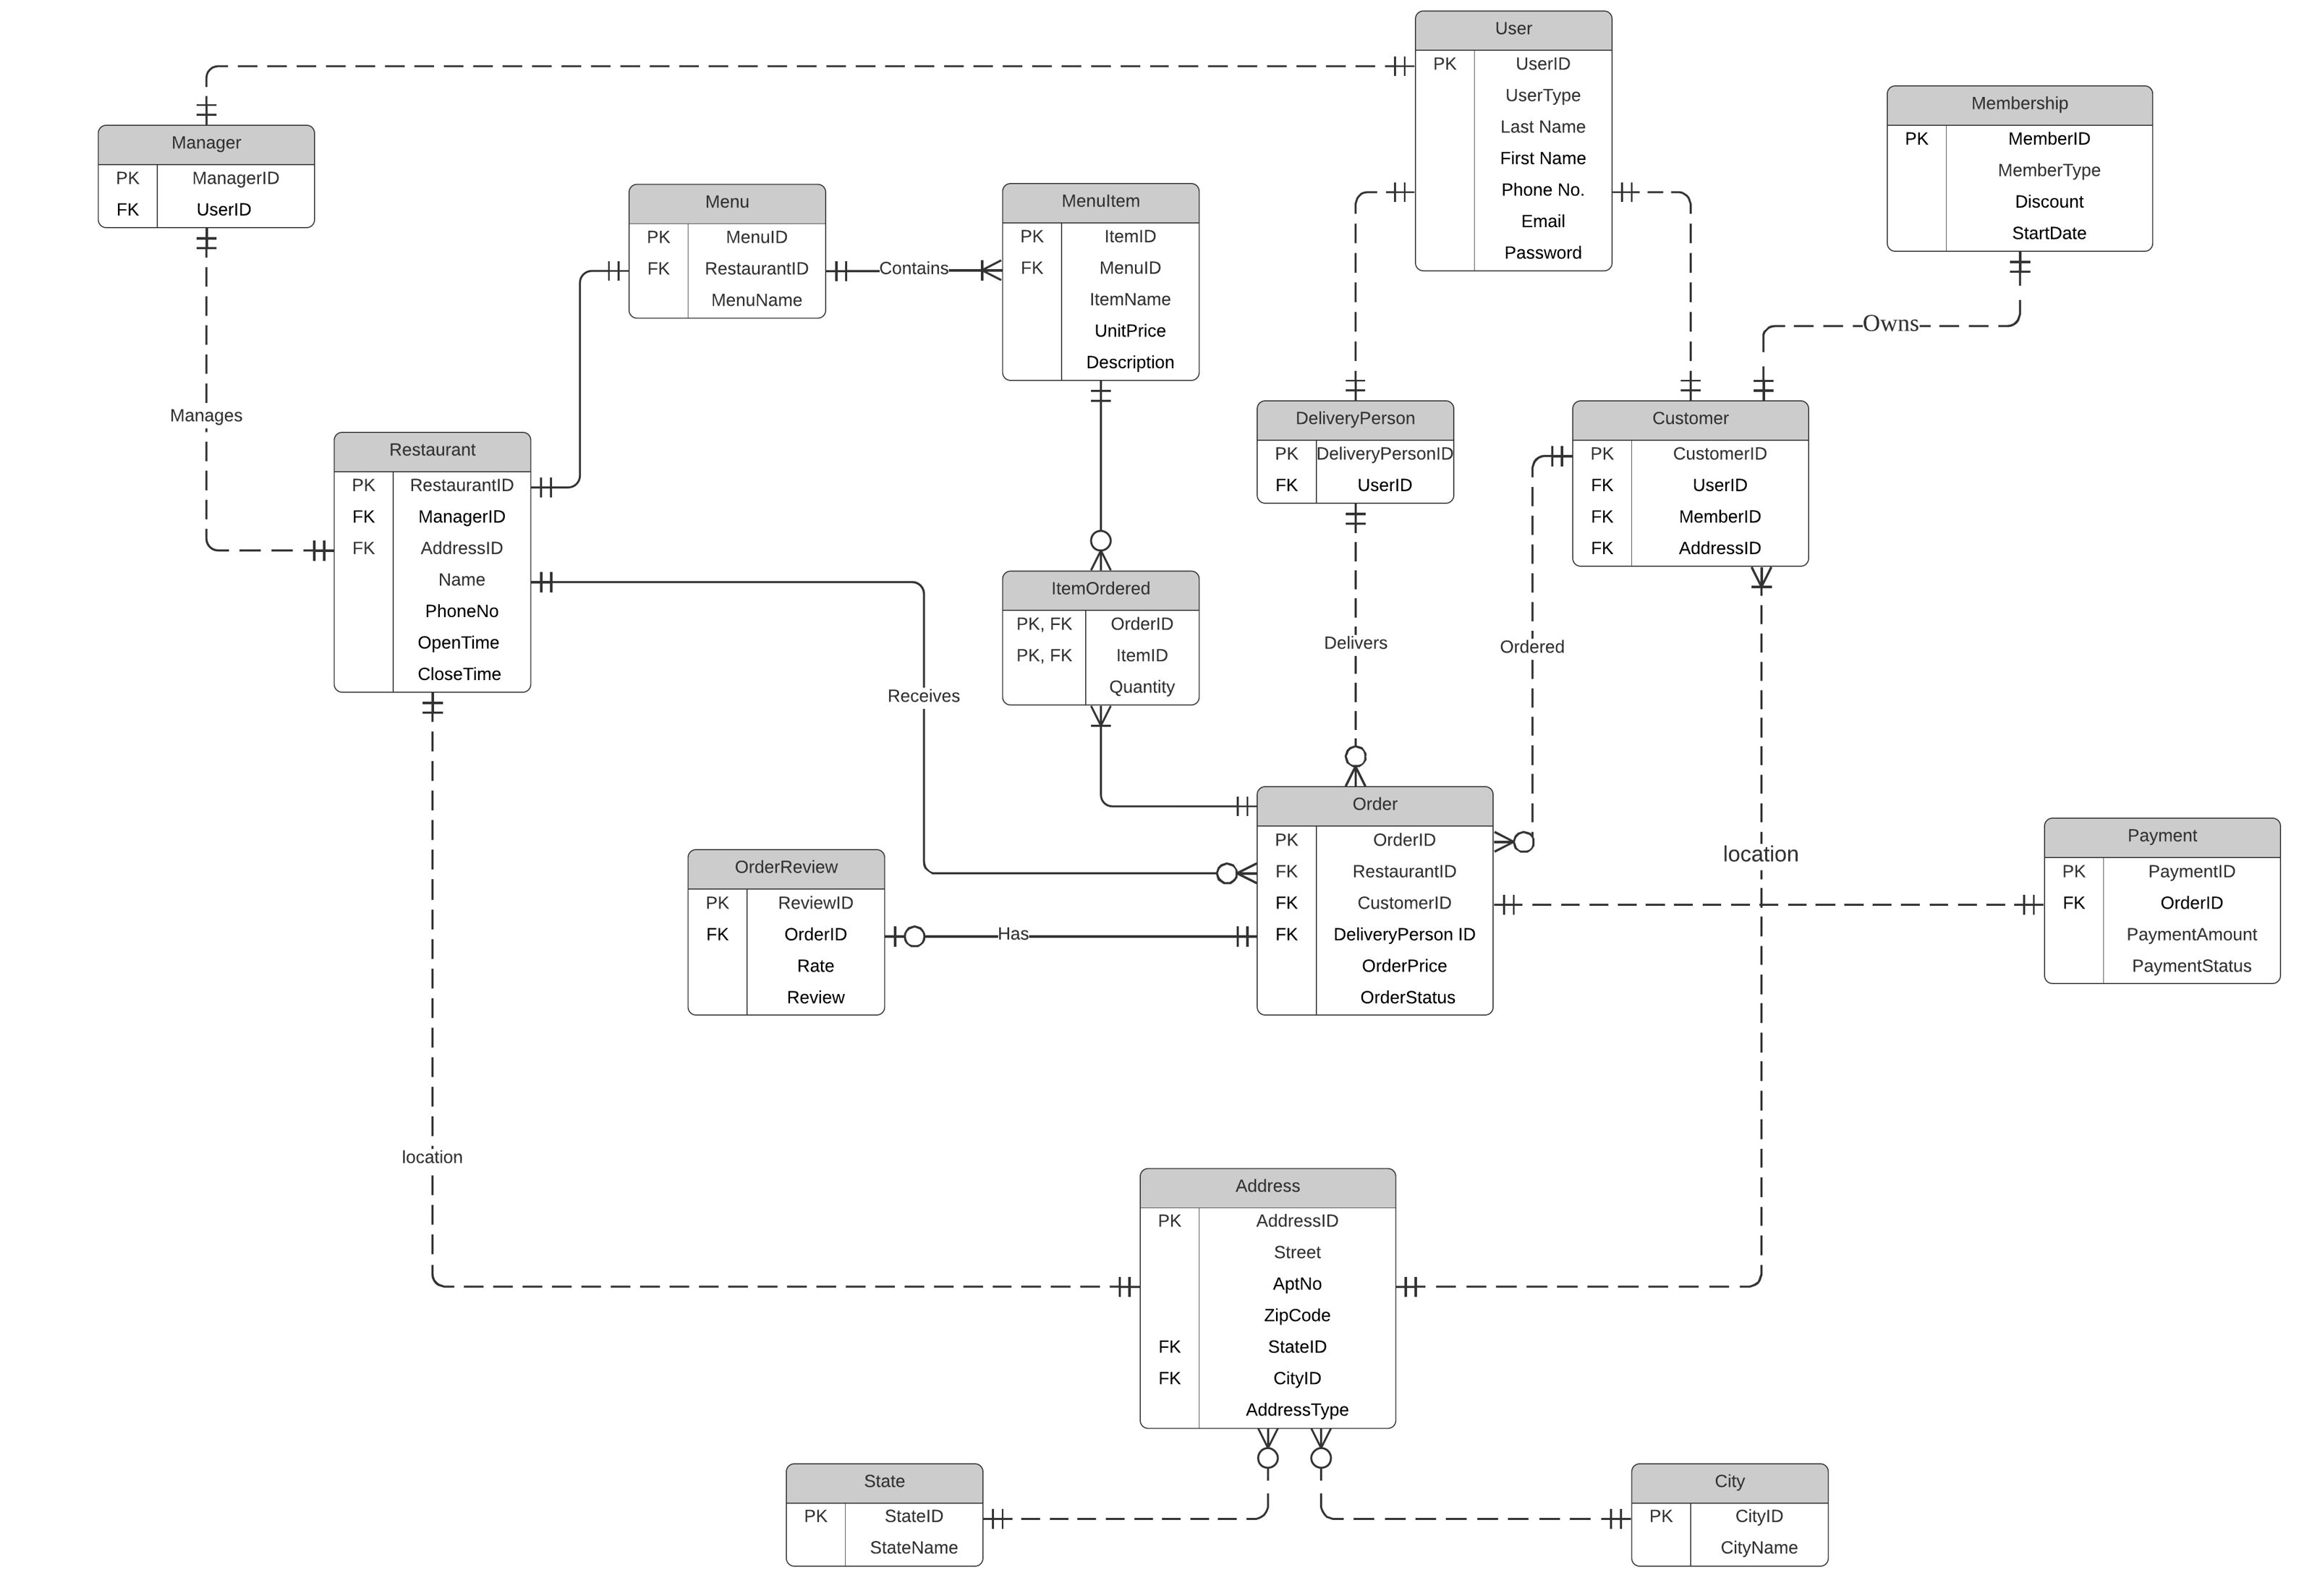
This is a group project consisting of 5 people to create a food delivery database using SQL. The purpose of this database is to maintain the data used to support online food ordering and delivery services. The database can be used by the restaurant manager (obtain and track orders), delivery person (obtain delivery information), and customer (order and provide ratings). This database serves as a platform to perform contactless business, track orders, and perform order analytics.
The database contains 4 schemas and 15 entities. The Entity Relationship Diagram (ERD) for the database is shown below.
Food Database ERD
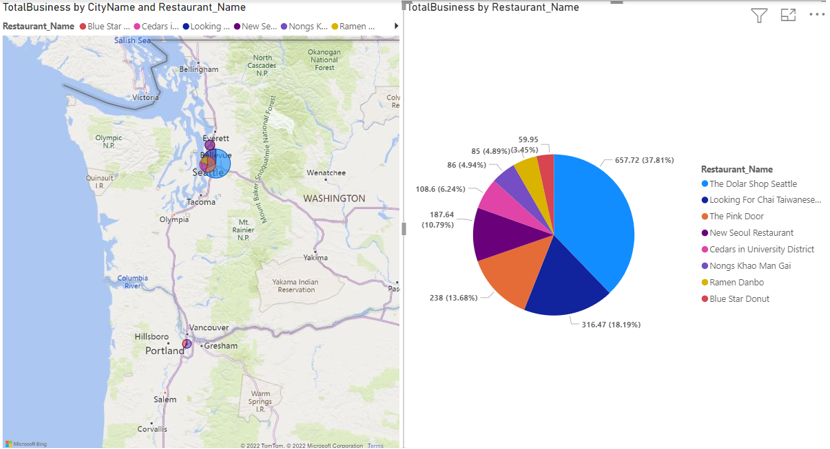
Triggers were used to update the user, order, and payment automatically. Column data encryption was used on passwords to increase security. Computed column procedure was used to calculate payment according to membership level discount automatically. The custom database was tested using 20 restaurants from 4 different US states with at least 3 menu items from each restaurants. SQL Views query were set up for common analytics such as average restaurants rating, top 3 restaurants, and restaurant menus. Vizualizations with PowerBI for those views were also set as shown below.
Visualization from PowerBI
Team members: Chang Xu, Gauri Damle, Jessica Tanumihardja, Shruthi Ananthapadmanabha, Zhening Feng
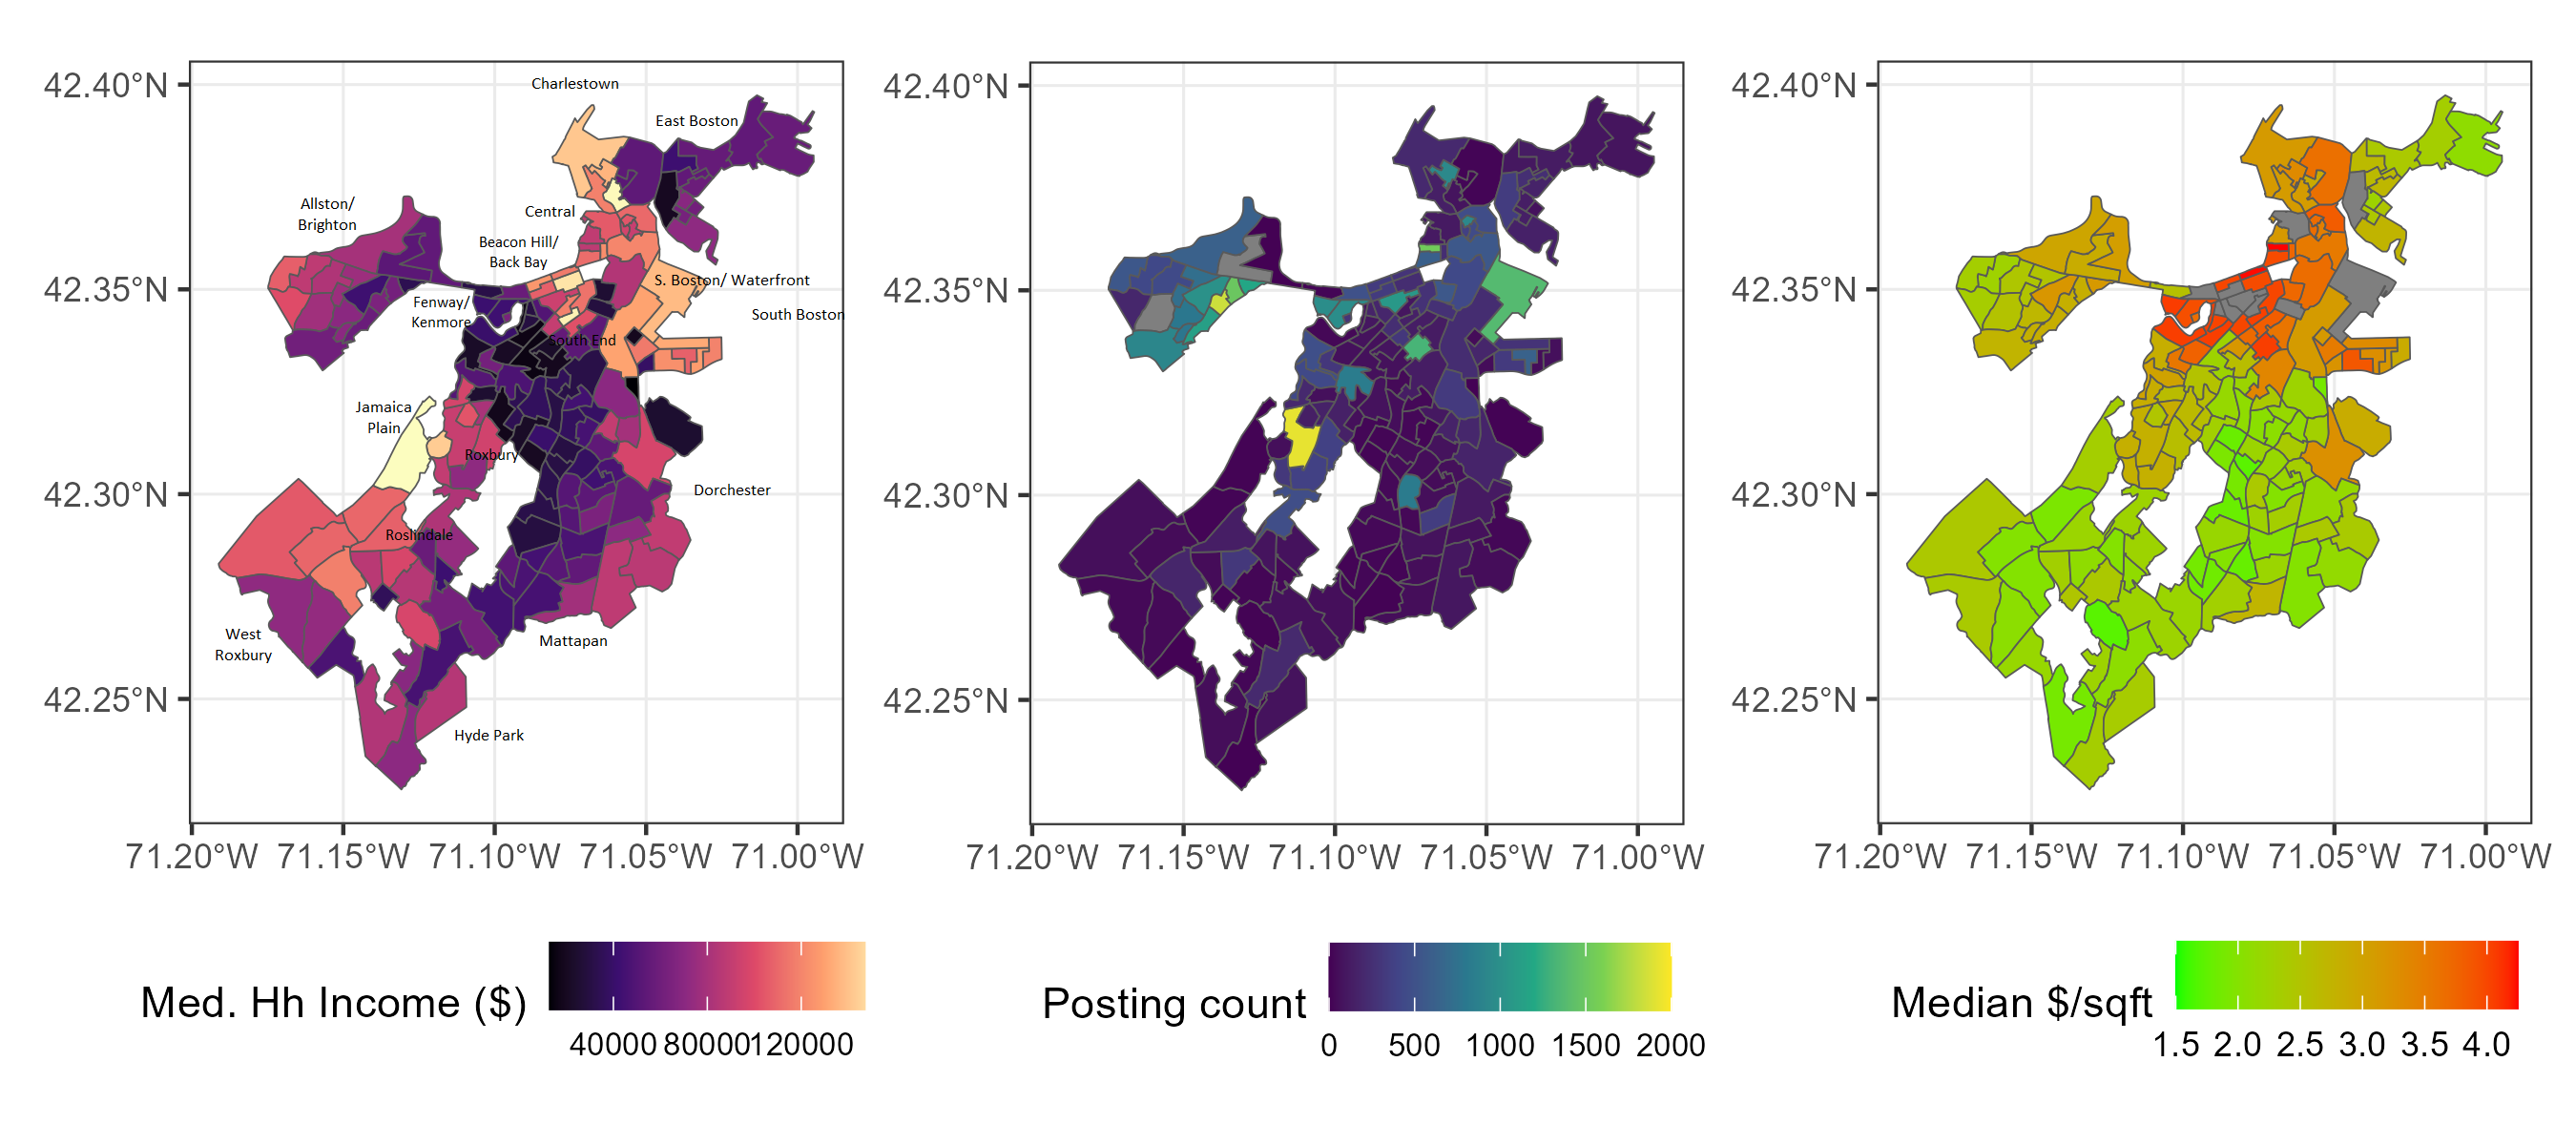
This is an individual semester-long project for PPUA 5262 Big Data for Cities class using R Studio. The project objective is to process, analyze, visualize, and model Craigslist's Housing data in Massachusets and other supporting administrative datasets (census tracts, points of interest, etc.). The geographical area of focus is the City of Boston, turning the big data into products that might benefit communities. The analysis involves property pricing trends against nearby amenities, ease of commute, and demographic variables (age, median income, etc.) to see the trend of equity across Boston’s neighborhoods.
The WordPress articles created from the weekly data exploration can be found here.
GitHub repository contains the city exploration and final reports.
Visualization sample: Map of Median Household Income, Craigslist Posting Count, and Median Listing Price/ sq.ft. for the City of Boston (2020-2021 data) per census tract ID.
LinkedIn: Jessica Tanumihardja
