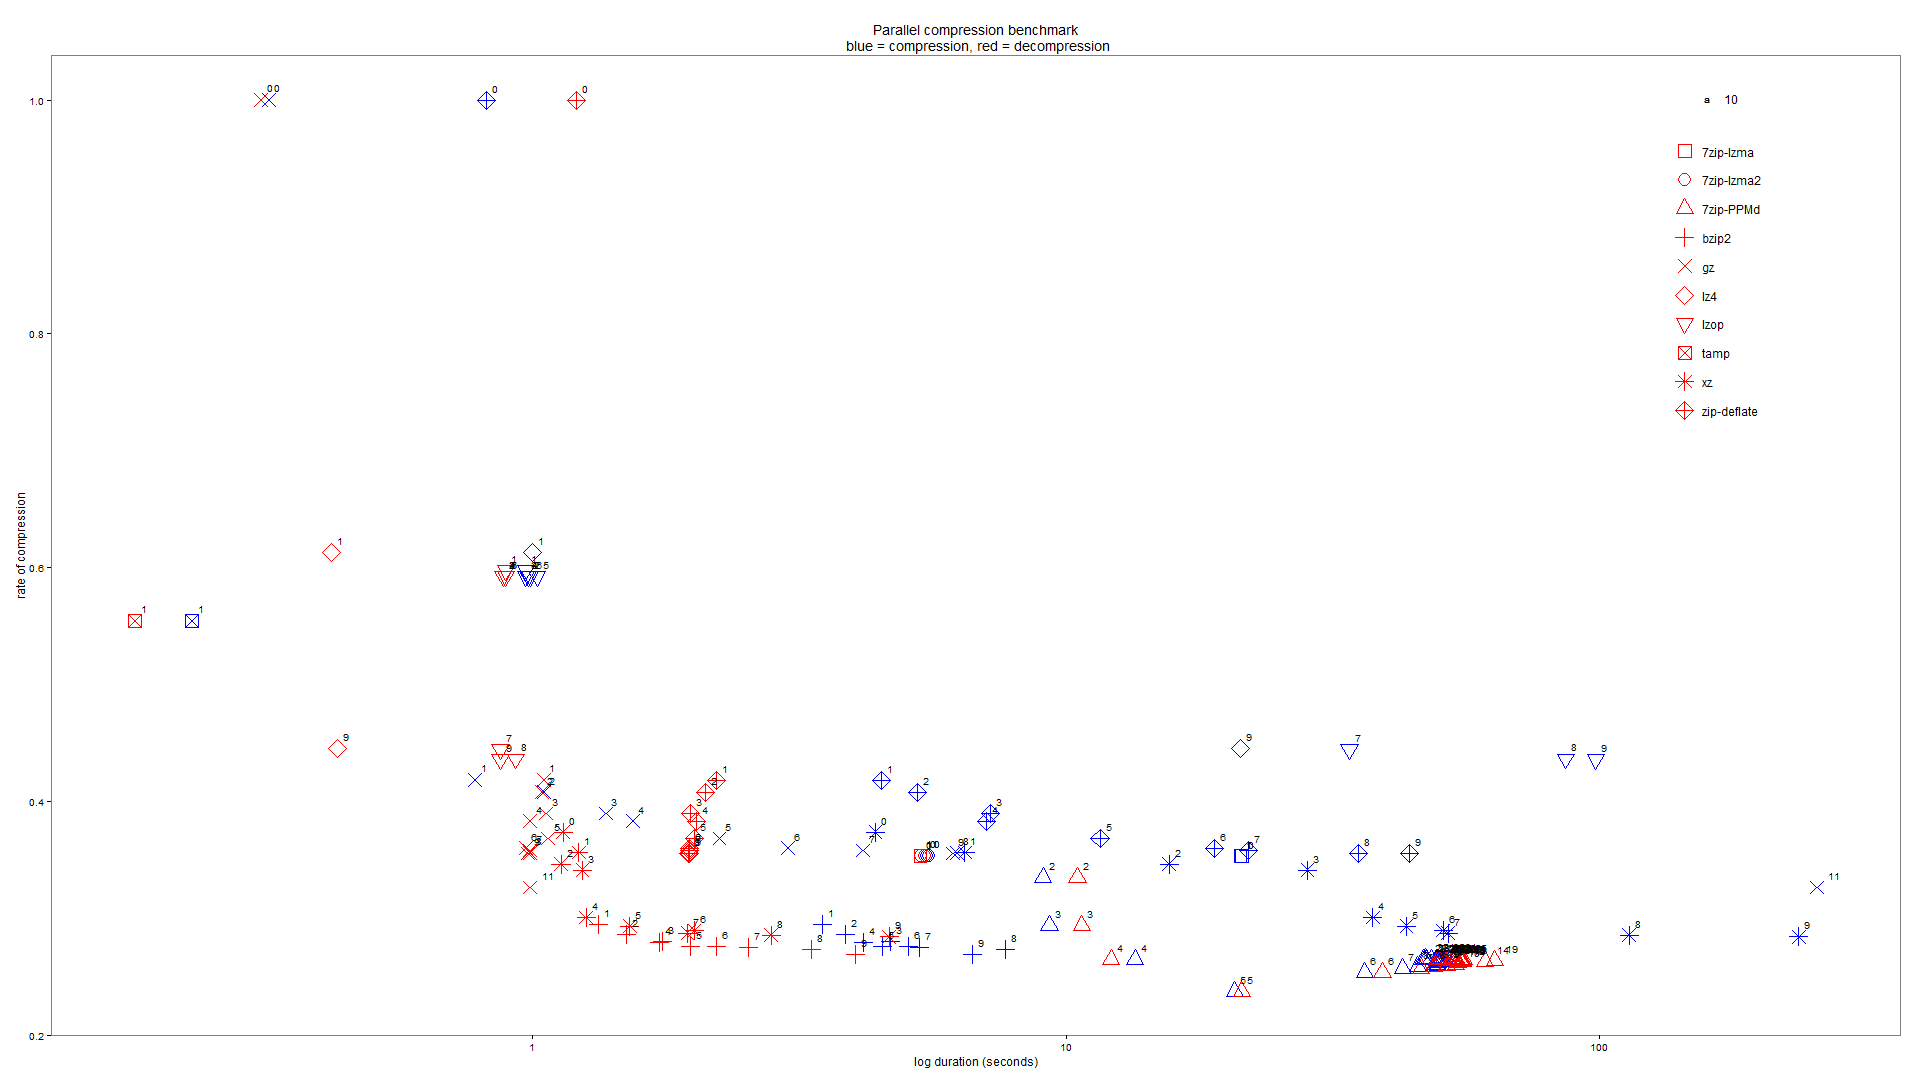
This set of scripts can be used to test the advantages of using parallel versions of compression programs on your own dataset.
We have written a bash script to perform the compressions, and a R script to create a graph of the data.
The bash script is called like this :
./compresstest.sh file_to_compress 2>&1 | tee `hostname`_`date +%Y%m%d_%H%M%S`.csv
After it has finished, the data needs to be filtered and formatted for use in the R script, like this:
cat dev1_20141220_095316.csv | grep -E -f matches.grep | grep -v Pavlov | sed ':a;N;$!ba;s/%\n/\t/g' > compressionResults.csv
Then use the R script to generate a graph of the result :
R CMD BATCH --no-save --no-restore "--args compressionResults.csv blah.pdf pdf" compressionResults.R
Most of the programs are part of your Linux distribution, so for e.g. Ubuntu do this :
sudo aptitude install lzop p7zip pbzip2 pigz pixz zip liblz4-tool
TAMP has to be created from source, and added to your PATH.
First install the necessary libraries, as TAMP is a 32 bit program:
sudo aptitude install libc6-dev-i386
Then fetch TAMP and QuickLZ 1.41, and build:
wget https://blogs.oracle.com/timc/resource/tamp-2.5-source.zip && \
unzip tamp-2.5-source.zip && cd tamp-2.5 && \
wget http://www.quicklz.com/quicklz141.zip && unzip quicklz141.zip && \
make -f Makefile.linux && \
export PATH=`readlink -f .`:$PATH