Comments (4)
 PeteCondliffe
commented on May 18, 2024
1
PeteCondliffe
commented on May 18, 2024
1
Thank you so much.
Love the other things you guys have done with it too. Its allowed me to do this;
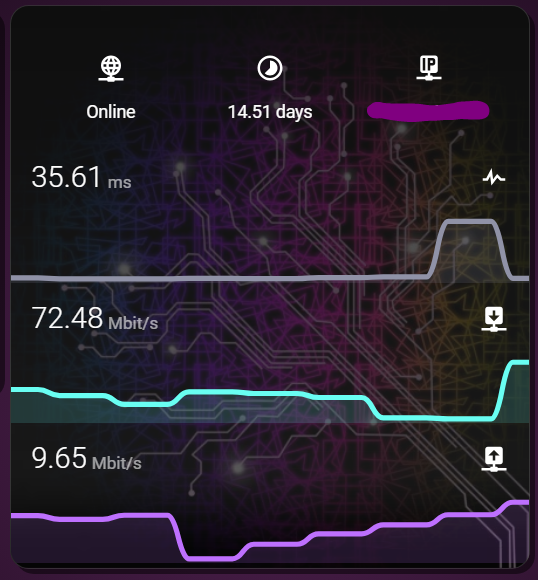
from mini-graph-card.
 kalkih
commented on May 18, 2024
kalkih
commented on May 18, 2024
Nice setup!
That's indeed a great idea for saving space.
i'm thinking about what we should name that option,
icon_position maybe? What do you think?
from mini-graph-card.
PeteCondliffe
commented on May 18, 2024
Thanks.
Wish I could help with the code but I would have to learn how to first. :(
Yeah I thing icon_position works with string values something like;
title - For the position its in now (Default)
state-left - Positioned before the state
state-right - Aligned right inline with the state. About where I have it on my screenshot
I really don't know how much work is involved so I guess if its a lot just have state instead of state-left and state-right
from mini-graph-card.
kalkih
commented on May 18, 2024
Now available with the latest release v0.2.0
Can be achieved by setting name: false under the show option and align_icon: state. See example below
# Example compact
- type: custom:mini-graph-card
  name: COMPACT CARD
  entities: sensor.example_sensor
  align_icon: state
  show:
    name: false
Thanks for the suggestion!
from mini-graph-card.
Related Issues (20)
- Using same tile with 2 graphs but different max/min HOT 3
- Incorrect report in bars vs history-graph HOT 5
- Non existing data shown on group_by date with aggregate_fuct max or last HOT 6
- Sporadic data showed wrong from origin HOT 2
- Extrema option doesn't account for unit changes HOT 4
- The display of numerical values does not support the format set in HA HOT 2
- Possibility to map string values to binary values HOT 2
- Improve showing a date for a selected point HOT 2
- Feature request - Option to show vertical markers for specific time periods HOT 1
- align_icon to right is not applied HOT 1
- Fill color problem when line is flat HOT 3
- Show state next to a legend's label HOT 1
- show_points: false HOT 4
- Graph doesn't fully render outside local network HOT 5
- 12am or 12pm in a 24 hour format shown as 0am or 0pm when using extrema HOT 1
- Yaml code does not work on HAOS but works on docker container version HOT 2
- Unable to set range correctly HOT 1
- mini-graph-card not showing actual value HOT 2
- Mini graph
- Question: Average between two entities? HOT 5
Recommend Projects
-
 React
React
A declarative, efficient, and flexible JavaScript library for building user interfaces.
-
Vue.js
🖖 Vue.js is a progressive, incrementally-adoptable JavaScript framework for building UI on the web.
-
 Typescript
TypeScript is a superset of JavaScript that compiles to clean JavaScript output.
-
TensorFlow
An Open Source Machine Learning Framework for Everyone
-
Django
The Web framework for perfectionists with deadlines.
-
 Laravel
A PHP framework for web artisans
-
D3
Bring data to life with SVG, Canvas and HTML. 📊📈🎉
-
Recommend Topics
-
javascript
JavaScript (JS) is a lightweight interpreted programming language with first-class functions.
-
web
Some thing interesting about web. New door for the world.
-
server
A server is a program made to process requests and deliver data to clients.
-
Machine learning
Machine learning is a way of modeling and interpreting data that allows a piece of software to respond intelligently.
-
Visualization
Some thing interesting about visualization, use data art
-
Game
Some thing interesting about game, make everyone happy.
Recommend Org
-
Facebook
We are working to build community through open source technology. NB: members must have two-factor auth.
-
Microsoft
Open source projects and samples from Microsoft.
-
Google
Google ❤️ Open Source for everyone.
-
Alibaba
Alibaba Open Source for everyone
-
D3
Data-Driven Documents codes.
-
Tencent
China tencent open source team.
from mini-graph-card.