kalkih / mini-graph-card Goto Github PK
View Code? Open in Web Editor NEWMinimalistic graph card for Home Assistant Lovelace UI
License: MIT License
Minimalistic graph card for Home Assistant Lovelace UI
License: MIT License


![dependabot[bot] avatar](https://avatars.githubusercontent.com/in/29110?v=4 "dependabot[bot]")


With one of my template sensors im getting a NaN message instead of the sensor value.
(left mini graph card and right the default sensor card)

Code :
          - type: custom:card-modder
            style: {border-radius: "20px", border: "solid 1px rgba(100,100,100,0.3)", overflow: hidden}
            card:
              type: custom:mini-graph-card
              icon: mdi:fire
              name: Gas
              height: 100
              align_header: default
              align_icon: right
              align_state: center
              show:
                graph: false
                fill: true
                points: false
                legend: false
              entities: sensor.gas

          - type: custom:card-modder
            style: {border-radius: "20px", border: "solid 1px rgba(100,100,100,0.3)", overflow: hidden}
            card:
              type: sensor
              entity: sensor.gas
              icon: mdi:fire
              name: Gas
              graph: none
Template sensor :
- platform: mqtt
  name: "Gas"
  state_topic: "dsmr/json"
  unit_of_measurement: 'm3'
  force_update: true
  value_template: "{{ (value_json.extra_device_delivered | float) | replace('.',',') }}"
Can now add UI Editors to custom cards. e.g. my Roku Card
Would you consider giving the option of displaying the icon next to the state in a future version?
The reason for this is space saving. For things like temperature & humidity an icon is enough to know what the graph is for. Unfortunately hiding the title doesn't give you the space back but having the option to display the icon next to the state would.
I've created a background with the icons on as a workaround and example of what I mean

Thanks for considering.
Pressing/clicking legend entries will trigger the popup for that entity
This happens on the latest version - just installed the custom bundle an hour ago. It happens for all cards as you can see in the screenshot.
If more details are needed please let me know.

cards:
  - entities:
      - entity: light.luz_bano
      - entity: binary_sensor.movimiento_bano
      - entity: binary_sensor.0x00158d0002d43d30_occupancy_3
      - entity: binary_sensor.presencia_bano
    type: entities
  - entities:
      - entity: sensor.0x00158d0002726443_temperature_2
      - entity: sensor.0x00158d0002726443_humidity_2
    type: 'custom:mini-graph-card'
    line_color: purple
    name: Temperatura / Humedad
    points: hover
    location_state: center
    hours_to_show: 72
type: vertical-stack
Hello, this is the code that I have for a part of my lovelace config..
As it is right now it will make the temperature graph in a purple color, but if I add more line_color: lines under the one I already have it doesnt work. How can I change the colors of all of my sensors?
Thanks
As per the forum:
(https://community.home-assistant.io/t/lovelace-mini-graph-card/71385/137)
It seems a bit churlish to ask for such a small (and maybe niche) change in such a great card but would it be possible to do something about the bottom left corner being cut off when using labels in a card with rounded corners using card-modder?
Maybe have the min. value optional? Or remove the - (which would help if the min. value was only one digit).
Or, my preferred option would be to shift the whole thing including the y-axis over to be where the left side of the graph is? I think this would be more aesthetically pleasing even without rounded corners.
Hi, i copied the 2 .js in the www folder, i put code in un-lovelace.js
but i get
https://xxxx.xxxx.xxx:8123/local/mini-graph-card.js?v=0.0.4:7:1 Uncaught SyntaxError: Unexpected token <
in the logfile
would be nice if mini-graph-cardcard would have a option for decimal places
exemple:
places: 0 --------> 19 °C
places: 1 --------> 19.6 °C
places: 2 --------> 19.65 °C
I'm getting the same old custom element doesn't exist.
Tried replacing module to js, updating, etc etc. Nothing works.
When opening Chrome Console - I'm getting this:
Uncaught SyntaxError: Unexpected token <
Trying to load the file manually (my-ip:8123/local/mini-graph-card-bundle.js?v=0.2.4) is showing me this:
<html><body>You are being <a href="https://github-production-release-asset-2e65be.s3.amazonaws.com/148520838/89f60d00-2fe9-11e9-97de-848df7135130?X-Amz-Algorithm=AWS4-HMAC-SHA256&X-Amz-Credential=AKIAIWNJYAX4CSVEH53A%2F20190214%2Fus-east-1%2Fs3%2Faws4_request&X-Amz-Date=20190214T092528Z&X-Amz-Expires=300&X-Amz-Signature=a010d980089d3a6f93b4717c9ce4e8b1e44292fb7d6ce281eea9cb3b388d28e8&X-Amz-SignedHeaders=host&actor_id=0&response-content-disposition=attachment%3B%20filename%3Dmini-media-player-bundle.js&response-content-type=application%2Foctet-stream">redirected</a>.</body></html>
In other words - a redirect to: https://github-production-release-asset-2e65be.s3.amazonaws.com/151280062/e21f1600-2fcd-11e9-8ae8-6cccf4dd1a48?X-Amz-Algorithm=AWS4-HMAC-SHA256&X-Amz-Credential=AKIAIWNJYAX4CSVEH53A%2F20190214%2Fus-east-1%2Fs3%2Faws4_request&X-Amz-Date=20190214T092927Z&X-Amz-Expires=300&X-Amz-Signature=2532623f53e4131d0a40c15be0a822c88ed05b8776747c336c569658eb55c71a&X-Amz-SignedHeaders=host&actor_id=0&response-content-disposition=attachment%3B%20filename%3Dmini-graph-card-bundle.js&response-content-type=application%2Foctet-stream
How do I get rid of this?
I'm getting the same problem with mini-media-player ( link ) -- but on the other hand, weather-card does work.
There is an issue with graph points color in case of use line_color_above. Graph points should have the color same as graph but they have same as line_color.

The time ranges, starting at the most recent point are increasing rather than decreasing when moving back in time

This card works perfectly fine except for the mouse-over of data points. When I move the mouse pointer to a data point, the correct value is shown, but the time span is not correct. It's always the same minutes with a random hour, no matter whether I choose 12h or 24h date format.
This screenshot I took at 12:09 and every data point in the graph shows "XX:07-XX:09" with a random hour. I use points_per_hour: 30.

Would love to see an option of X and Y labels so this beautiful graph could be more useful.
When I nest type: custom:mini-graph-card under the type: horizontal-stack I get an error:
Cannot read property 'states' of undefined
Is it a problem with this component or HA 0.81 version?
I have a few graphs where I'd like to plot sensor value against input_boolean. Would that be possible to convert on/off of those entities to 0/1 and plot them on the chart?
When I add the card, entity titles and states as well as icons are not properly formatted:

Unsure if this error is related to the vertical-card-stack custom card or this one or how they interact. Getting the following error when the view is refereshed.
https://duck.duckdns.org/local/custom_ui/vertical-stack-in-card.js?v=0.0.2:61:74 Uncaught TypeError: Cannot read property 'style' of null
The card also doesn't appear to integrate cleanly like other cards do into the vertical-card-stack. See imugr link. https://imgur.com/Vuer2xp (note the borders around the graph cards)
Relevant parts of my config:
resources:
  #https://github.com/thomasloven/lovelace-slider-entity-row
  - url: /local/custom_ui/slider-entity-row.js
    type: js
  #https://github.com/kalkih/mini-graph-card
  - url: /local/custom_ui/mini-graph-card.js?v=0.0.1
    type: module
  #https://github.com/custom-cards/vertical-stack-in-card
  - url: /local/custom_ui/vertical-stack-in-card.js?v=0.0.2
    type: js

title: Home
views:
  - title: Rooms
    icon: mdi:home
    cards:
      - type: custom:vertical-stack-in-card
        cards:
          - type: entities
            title: HVAC Status
            entities:
              - entity: climate.downstairs
                name: Nest Thermostat
          - type: glance
            entities:
              - entity: binary_sensor.downstairs_thermostat_fan
                name: Fan
              - entity: sensor.downstairs_thermostat_hvac_state
                name: State
                icon: mdi:thermostat
              - entity: sensor.downstairs_thermostat_operation_mode
                name: Mode
                icon: mdi:information-outline
              - entity: sensor.downstairs_thermostat_target
                name: Target
                icon: mdi:thermometer-lines
              - entity: sensor.downstairs_away_mode
                name: Away
                icon: mdi:home-outline
           - type: horizontal-stack
             title: Nest Graphs
             cards:
               - type: "custom:mini-graph-card"
                 entity: sensor.downstairs_thermostat_temperature
                 name: Temperature
                 line_color: '#e74c3c'
                 line_width: 8
                 more_info: false
                 accuracy: 25
               - type: "custom:mini-graph-card"
                 entity: sensor.downstairs_thermostat_humidity
                 name: Humidity
                 line_color: '#3498db'
                 line_width: 8
                 more_info: false
                 accuracy: 25
History graph shows this: 
mini graph card shows this: 
Console says this

and this

I'm trying to change line color on negative temperatures, so i set
line_value_below: 0
and it does not work for me. Color doesn't change when the value < 0. Looks like the card ignores this setting.
The temporary workaround is:
line_value_below: 0.1
It would be nice on the Extrema View to be able to see one line per entity so to keep track of all min-max of each entity of the graph.
It would also be nice, when there are multiple entities but you want to see only one min/max, to be able to define which entity provides you the min and which the max.
Hope is clear enough, if not let me know :)
Cheers
Andrea

starting to work on supplementing my pc-card with your min-graph-card and it is going great! will probably submit a PR soon to remove the box shadow, but beyond that, it is absolutely awesome for this!
Hi,
is it possible to use the value "current_temperature" from the climate entity?

Greetings
Daniel
Firstly - awesome work on this! It's so much neater than the builtin graphs in HA. So thanks for putting it out there for everyone 👍
Just wondering if there's a possibility of allowing multiple entities on the one graph? I use the built in graph to show a visual representation of inside/outside temp:

but something like this would like much nicer:

Thanks again!
Hi @kalkih.
Weird thing. Please take a look at this config:
          - type: vertical-stack
            cards:
              - type: horizontal-stack
                cards:
                  # wykres wilgotności
                  - type: custom:mini-graph-card
                    entities:
                      - sensor.mqtt_humidity_bedroom
                    font_size: 80
                    animate: true
                    hour24: true
                    points_per_hour: 1
                    hours_to_show: 12
                    show:
                      fill: false
                    line_color: '#ff0000'                                   # czerwony
                    color_thresholds:
                      - value: 40.00
                        color: '#55ff00'                                    # zielony
                      - value: 60.00
                        color: '#00aaff'                                    # niebieski
                  # wykres ciśnienia
                  - type: custom:mini-graph-card
                    entities:
                      - sensor.mqtt_pressure_bedroom
                    icon: mdi:gauge
                    font_size: 75
                    animate: true
                    hour24: true
                    points_per_hour: 1
                    hours_to_show: 12
                    show:
                      fill: false
                    line_color: '#55ff00'                                   # zielony
When I use custom:mini-graph-card nested in vertical-stack and then in horizontal-stack I have this error on my log:
https://XXX.org/frontend_latest/dcc7e8d8e861a5f2b17d.chunk.js:3203:365 Uncaught TypeError: Cannot read property 'replaceChild' of null. This error occurs when I refresh the page.
I have 2 request regarding the min-max values.
graph: false under show then min-max (extrema) is not shown anymore. Is it possible to still show these values even when the graph is not shown?Some more info here.
In v0.09 the decimals option is introduced.
Can the same decimals option also be applied to the displayed labels?
Is there a way to make the icon optional? When stacking them horizontally, horizontal space is constrained and the icons take up quite a bit. I would love it to make the icons optional to get more space for the name labels.
The docs state that the entities option can be string or list.
Using a string works in the UI, however it fails when using the "Unused entities page".
That script assumes that entities is a list, and not a string.
This will work in the ui, but not in the unused entities page
- type: custom:mini-graph-card
  entities: sensor.somesensor
This will work everywhere
- type: custom:mini-graph-card
  entities:
    - sensor.somesensor
If I have multiple entities and want to show all states, it looks like this:

IMHO there is room for improvement. I would suggest to add the value right next to the legend.
for some reason im not getting the decimals: option to work
type: 'custom:mini-graph-card'
name: Exterior Temperature
accuracy: 30
decimals: 0
entity: sensor.dark_sky_temperature
line_color: '#3498db'
line_width: 8
the output is always same ex: 18.3 wont matter if decimals is 0. 1. 2. 3. etc...
Really love this card. It's awesome.
Would you want to contribute it back to official repo at https://github.com/home-assistant/home-assistant-polymer ?
This line:
import { LitElement, html, svg } from 'https://unpkg.com/@polymer/lit-element@^0.6.2/lit-element.js?module';
Does not work anymore. If I remove the "^", the card works again in Home Assistant.
I also noticed that version 0.6.5 also seems to work with your card.
Currently the Y-axis lower-bound and upper-bound fluctuate constantly as the graph auto-scales itself every time it is updated. This is great for certain use cases.
Other use cases would benefit from static lower bound (e.g. leave the lower bound anchored in zero or some other value) and/or upper-bound - where it is important to visually spot the "big picture" rather than smaller variations.
For example, anchoring only lower-bound to zero would be great for a Humidifier or Temperature type use case, where minor variations of a fraction of a degree are not relevant, but one would normally like to spot bigger-picture trends - so it's important to leave the lower bound constant in zero, but the upper bound can be auto-scaled
Other user cases may benefit from anchoring both lower and upper bound, for example router throughput, where throughput is limited to a known upper bound set by the ISP/DSL/Cablemodem subscription speed. So in this case one would use e.g. 0Mbps for the lower bound and 25Mbps for the upper bound.
Ideally, either ‘auto’ or a specific lower bound would apply on a per-entity basis (if different y-axis scales are support, which I believe is not the case now)
Usage examples
lower_bound: auto  # (default)

lower_bound: 0
Currently I think only a single Y-axis scale is supported for all graphed entities, so lower_bound and upper_bound would be 'global' card configuration options. If in the future independent Y-axis scales are supported, then lower_bound/upper_bound would be best configured withing each entity
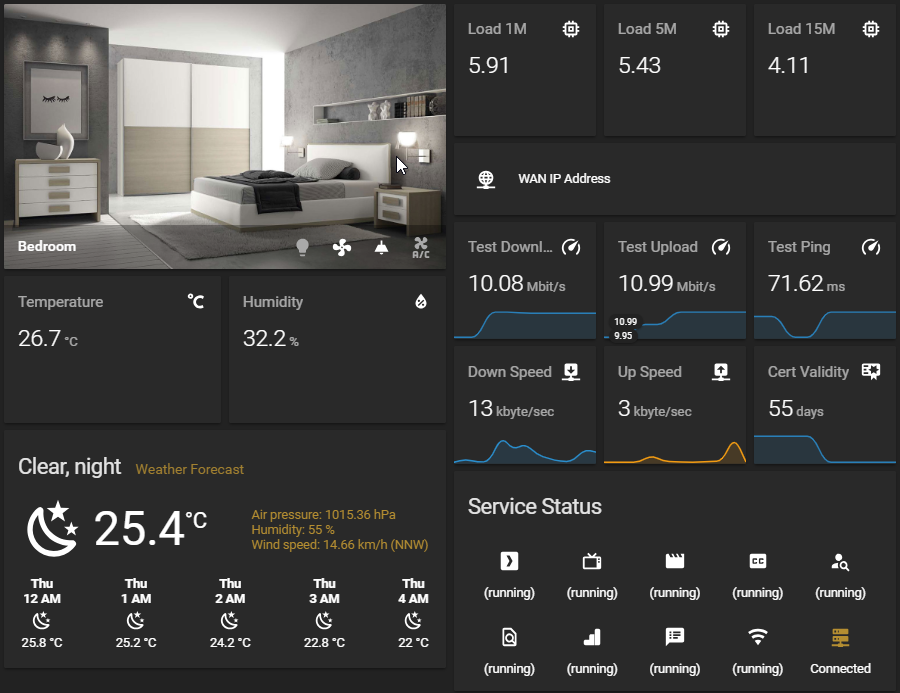
I am unable to see the graphs for the Load and the Temp / Humidity Sensor after upgrade to 0.2.3. My configurations are below:
- entities:
- light.ceiling_bulb
- fan.ceiling_fan
- light.ceiling_light
- switch.ac
image: /local/bedroom.jpg
title: Bedroom
type: picture-glance
- cards:
- cards:
- entities:
- sensor.temperature
font_size: 75
line_color_threshold:
- color: '#2a8fce'
value: 1
- color: '#33ce2b'
value: 10
- color: '#f39c12'
value: 24
- color: '#d35400'
value: 28
- color: '#c0392b'
value: 30
line_width: 5
location_icon: left
location_state: center
show:
extrema: true
points: false
type: 'custom:mini-graph-card'
- entities:
- sensor.humidity
font_size: 75
line_color_threshold:
- color: '#33ce2b'
value: 1
- color: '#f39c12'
value: 30
- color: '#d35400'
value: 35
- color: '#c0392b'
value: 40
line_width: 5
location_icon: left
location_state: center
show:
extrema: true
points: false
type: 'custom:mini-graph-card'
type: horizontal-stack
type: horizontal-stack
- entity: weather.weather_forecast
type: weather-forecast
- artwork: cover
entity: media_player.mokshs_tv
hide_power: true
icon: 'mdi:cast'
max_volume: 30
power_color: true
scroll_info: true
show_progress: true
show_source: true
type: 'custom:mini-media-player'
type: vertical-stack
`cards:
- cards:
- cards:
- cards:
- entities:
- sensor.load_1m
font_size: 75
line_color_threshold:
- color: '#2a8fce'
value: 0.01
- color: '#f39c12'
value: 2
- color: '#d35400'
value: 3
- color: '#c0392b'
value: 4
line_width: 5
name: Load 1M
show:
extrema: true
points: false
type: 'custom:mini-graph-card'
- entities:
- sensor.load_5m
font_size: 75
line_color_threshold:
- color: '#2a8fce'
value: 0.01
- color: '#f39c12'
value: 2
- color: '#d35400'
value: 3
- color: '#c0392b'
value: 4
line_width: 5
name: Load 5M
show:
extrema: true
points: false
type: 'custom:mini-graph-card'
- entities:
- sensor.load_15m
font_size: 75
line_color_threshold:
- color: '#2a8fce'
value: 0.01
- color: '#f39c12'
value: 2
- color: '#d35400'
value: 3
- color: '#c0392b'
value: 4
line_width: 5
name: Load 15M
show:
extrema: true
points: false
type: 'custom:mini-graph-card'
type: horizontal-stack
type: horizontal-stack
- entities:
- entity: sensor.wan_ip_address
icon: 'mdi:wan'
show_header_toggle: false
type: entities
- cards:
- entities:
- sensor.speedtest_download
font_size: 75
line_color_threshold:
- color: '#c0392b'
value: 0
- color: '#d35400'
value: 4
- color: '#f39c12'
value: 6
- color: '#2a8fce'
value: 8
line_width: 5
name: Test Download
show:
points: false
type: 'custom:mini-graph-card'
- entities:
- sensor.speedtest_upload
font_size: 75
line_color_threshold:
- color: '#c0392b'
value: 0
- color: '#d35400'
value: 4
- color: '#f39c12'
value: 6
- color: '#2a8fce'
value: 8
line_width: 5
name: Test Upload
show:
points: false
type: 'custom:mini-graph-card'
- entities:
- sensor.speedtest_ping
font_size: 75
line_color_threshold:
- color: '#2a8fce'
value: 0
- color: '#f39c12'
value: 60
- color: '#d35400'
value: 80
- color: '#c0392b'
value: 100
line_width: 5
name: Test Ping
show:
points: false
type: 'custom:mini-graph-card'
type: horizontal-stack
- cards:
- decimals: 0
entities:
- sensor.freebsd_router_kbytesec_received
font_size: 75
line_color: '#2a8fce'
line_width: 5
name: Down Speed
show:
points: false
type: 'custom:mini-graph-card'
- decimals: 0
entities:
- sensor.freebsd_router_kbytesec_sent
font_size: 75
line_color: '#f39c12'
line_width: 5
name: Up Speed
show:
points: false
type: 'custom:mini-graph-card'
- entities:
- sensor.moksh_s_webserver
font_size: 75
line_color_threshold:
- color: '#c0392b'
value: 30
- color: '#d35400'
value: 60
- color: '#2a8fce'
value: 90
line_width: 5
name: Cert Validity
show:
points: false
type: 'custom:mini-graph-card'
type: horizontal-stack
- entities:
- entity: sensor.plex_server
hold_action:
action: call-service
service: script.restart_pms
- entity: sensor.sonarr
hold_action:
action: call-service
service: script.restart_sonarr_service
- entity: sensor.radarr
hold_action:
action: call-service
service: script.restart_radarr_service
- entity: sensor.bazarr
hold_action:
action: call-service
service: script.restart_bazarr_service
- entity: sensor.jackett
hold_action:
action: call-service
service: script.restart_jackett_service
- entity: sensor.ombi
hold_action:
action: call-service
service: script.restart_ombi_service
- entity: sensor.tautulli
hold_action:
action: call-service
service: script.restart_tautulli_service
- entity: sensor.mosquitto
hold_action:
action: call-service
service: script.restart_mosquitto_service
- entity: sensor.unifi
hold_action:
action: call-service
service: script.restart_unifi_service
- entity: binary_sensor.home_server
show_name: false
show_state: true
title: Service Status
type: glance
type: vertical-stack
type: vertical-stack
Screenshot for reference
How hard is it to have the option of adding in the current value to the right of the screen? Like over here:
I suppose it can get tricky with more than 2 sensors
mini-graph-card-bundle.js?v=0.0.8:1 Error: attribute d: Expected number, "M 4,NaN 4,NaN Q4,NaN…".
just a super simple example with this config
- type: "custom:mini-graph-card"
entity: sensor.home_energy_sensor_current
height: 100
line_width: 4
font_size: 75
color: '#3498db'
hours_to_show: 168
it shows the number but not the graph .
1 . Could it be possible to have a limitation for max-min data displayed (example temperature from 0° to 35°)?
2 . In graph could it be possible to add axes (X-Y) and horizontal/vertical grid (with user spacing selctable)?
Thanks a lot
Sometimes graphs disappear when the set accuracy does not fit to the available history data. No matter which accury level I choose, graphs keep disappearing and reappearing.

Sometimes setting the accuracy to a higher level brings back the graph, sometimes I must set it to a lower value. After some time, the graph disappears again and reappears some time later.
The underlying sensors update every 2 minutes (temperature derived from a Hue motion sensor).
Version 0.2.1
Using these parameters:
          hours_to_show: 2
          points_per_hour: 3
produces this graph:

where there are actually 6 hours in display, with one point shown per hour.
Testing different value combinations is showing that the "real" number of hours that are shown is actually = hours_to_show * points_per_hour.
Increasing points_per_hour to 6, produces a graph that spans for 12 hours, even if it was supposed to be showing 2 hours. It's a very strange behavior :)
In addition, using a number < 1 for "hours to show" proudces a weird result (apparently showing an entire week or so of 'hours').
There is also a problem with the labels (too much to the left and also too tiny after reducing font_size to 60) but I think there is a merged patch that would fix that in master already
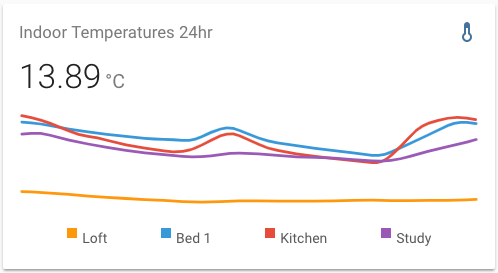
When hovering the mouse over a line with multiple entities, would it be possible to reveal the entity name in place of the card title (e.g. it would show ‘Loft’ instead of ‘Indoor Temperatures 24hr’) in the same way the entity state changes to match which line the mouse hovers over please? This would be useful if I decide to not show a legend to help with the minimalist look.
When setting the accuracy to 25, the last data point seems to be set to the max value of the graph. A lower value doesn't have this problem.
25:

24:

raw data:

Hi,
When you set up a custom name for the card and then you hover a point, it will show the entities name instead. Hopefully, you see what I'm talking about.
As suggeste on the Cmmunity site, it would be very usefl to be able to define icons based on status and threshold.
This makes sense for single entity, but might be adapted when multiple entities are present with the condition that a "main" one is defined (the one that define the bigger number, so I guess this can be another FR for that to be configurable :) )
This might require to change the newrly introduced color_threshold to become only threshold (just for clarity).
This way, you can specify a specific icon on a per state.
The original idea came to my mind because it would have been nice to have the thermometer icon to change based on the temperature (I tested with customizations without success, probably due to some darksky sensor limitations, there is an open issue for that, apparently was working in the past).
Cheers
Andrea
I'm using color_thresholds to display different colors based on values but I'm wondering if the fill color shouldn't be the same color ?

On my iPhone with the HA app, the threshold colors of the graph 1 get the colors of graph 2. Where on my desktop PC the colors are shown correctly.
This is the screenshot from my desktop:

And from my phone:

As you can see the dots show the correct colors, just the line isn't.
The card is now in a horizontal-stack, but when I remove them from that stack it still shows the same colors.
Graph 1 does show the correct colors when I remove graph 2 from the view.
Any ideas if this can be fixed?
It appears that whilst the line graph is correct, hovering over a zero value displays the current value.


It would be nice to have an option to setup the size of the header font (similar to the current option font_size that affects state font).
A declarative, efficient, and flexible JavaScript library for building user interfaces.
🖖 Vue.js is a progressive, incrementally-adoptable JavaScript framework for building UI on the web.
TypeScript is a superset of JavaScript that compiles to clean JavaScript output.
An Open Source Machine Learning Framework for Everyone
The Web framework for perfectionists with deadlines.
A PHP framework for web artisans
Bring data to life with SVG, Canvas and HTML. 📊📈🎉
JavaScript (JS) is a lightweight interpreted programming language with first-class functions.
Some thing interesting about web. New door for the world.
A server is a program made to process requests and deliver data to clients.
Machine learning is a way of modeling and interpreting data that allows a piece of software to respond intelligently.
Some thing interesting about visualization, use data art
Some thing interesting about game, make everyone happy.
We are working to build community through open source technology. NB: members must have two-factor auth.
Open source projects and samples from Microsoft.
Google ❤️ Open Source for everyone.
Alibaba Open Source for everyone
Data-Driven Documents codes.
China tencent open source team.