Giter Site home page Giter Site logo

keberwein / blscraper Goto Github PK

View Code? Open in Web Editor NEW
112.0 10.0 11.0 26.47 MB

A tool to gather, analyze and visualize data from the Bureau of Labor Statistics (BLS) API. Functions include segmentation, geographic analysis and visualization.

Home Page: https://github.com/keberwein/blscrapeR

License: Other

R 100.00%
bls labor-statistics unemployment bureau-of-labor-statistics api api-wrapper consumer-price-index cpi inflation inflation-calculator

blscraper's Introduction

blscrapeR

R build status CRAN_Status_Badge Project Status: Active - The project has reached a stable, usable state and is being actively developed.

Designed to be a tidy API wrapper for the Bureau of Labor Statistics (BLS.) The package has additional functions to help parse, analyze and visualize the data. The package utilizes "tidyverse" concepts for internal functionality and encourages the use of those concepts with the output data.

Install

  • Stable version from CRAN:
install.packages("blscrapeR")
  • The latest development version from GitHub:
devtools::install_github("keberwein/blscrapeR")

Before getting started, you’ll probably want to head over to the BLS and get set up with an API key. While an API key is not required to use the package, the query limits are much higher if you have a key and you’ll have access to more data. Plus, it’s free (as in beer), so why not?

Basic Usage

For “quick and dirty” type of analysis, the package has some quick functions that will pull metrics from the API without series numbers. These quick functions include unemployment, employment, and civilian labor force on a national level.

library(blscrapeR)
# Grab the Unemployment Rate (U-3) 
df <- quick_unemp_rate()
head(df, 5)
#> # A tibble: 5 x 6
#>    year    period periodName value footnotes  seriesID
#>   <dbl>    <list>     <list> <dbl>    <list>    <list>
#> 1  2017 <chr [1]>  <chr [1]>   4.1 <chr [1]> <chr [1]>
#> 2  2017 <chr [1]>  <chr [1]>   4.2 <chr [1]> <chr [1]>
#> 3  2017 <chr [1]>  <chr [1]>   4.4 <chr [1]> <chr [1]>
#> 4  2017 <chr [1]>  <chr [1]>   4.3 <chr [1]> <chr [1]>
#> 5  2017 <chr [1]>  <chr [1]>   4.4 <chr [1]> <chr [1]>

Search BLS IDs

Some knowledge of BLS ids are needed to query the API. The package includes a "fuzzy search" function to help find these ids. There are currently more than 75,000 series ids in the package's internal data set, series_ids. While these aren't all the series ids the BLS offers, it contains the most popular. The BLS Data Finder is another good resource for finding series ids, that may not be in the internal data set.

library(blscrapeR)
# Find series ids relating to the total labor force in LA.
ids <- search_ids(keyword = c("Labor Force", "Los Angeles"))
head(ids)
#> # A tibble: 6 x 4
#>                                                                  series_title
#>                                                                         <chr>
#> 1 Labor Force: Balance Of California, State Less Los Angeles-Long Beach-Glend
#> 2  Labor Force: Los Angeles-Long Beach-Glendale, Ca Metropolitan Division (S)
#> 3 Labor Force: Balance Of California, State Less Los Angeles-Long Beach-Glend
#> 4       Labor Force: Los Angeles-Long Beach, Ca Combined Statistical Area (U)
#> 5                                     Labor Force: Los Angeles County, Ca (U)
#> 6                                       Labor Force: Los Angeles City, Ca (U)
#> # ... with 3 more variables: series_id <chr>, seasonal <chr>,
#> #   periodicity_code <chr>
library(blscrapeR)
# Find series ids relating to median weekly earnings of women software developers.
ids <- search_ids(keyword = c("Earnings", "Software", "Women"))
head(ids)
#> # A tibble: 1 x 4
#>                                                                  series_title
#>                                                                         <chr>
#> 1 (Unadj)- Median Usual Weekly Earnings (Second Quartile), Employed Full Time
#> # ... with 3 more variables: series_id <chr>, seasonal <chr>,
#> #   periodicity_code <chr>

API Keys

You should consider getting an API key form the BLS. The package has a function to install your key in your .Renviron so you’ll only have to worry about it once. Plus, it will add extra security by not having your key hard-coded in your scripts for all the world to see.

From the BLS:

Service Version 2.0 (Registered) Version 1.0 (Unregistered)
Daily query limit 500 25
Series per query limit 50 25
Years per query limit 20 10
Net/Percent Changes Yes No
Optional annual averages Yes No
Series descriptions Yes No

Download Multiple BLS Series at Once

library(blscrapeR)

# Grab several data sets from the BLS at onece.
# NOTE on series IDs: 
# EMPLOYMENT LEVEL - Civilian labor force - LNS12000000
# UNEMPLOYMENT LEVEL - Civilian labor force - LNS13000000
# UNEMPLOYMENT RATE - Civilian labor force - LNS14000000
df <- bls_api(c("LNS12000000", "LNS13000000", "LNS14000000"),
              startyear = 2008, endyear = 2017, Sys.getenv("BLS_KEY")) %>%
    # Add time-series dates
    dateCast()
# Plot employment level
library(ggplot2)
gg1200 <- subset(df, seriesID=="LNS12000000")
library(ggplot2)
ggplot(gg1200, aes(x=date, y=value)) +
    geom_line() +
    labs(title = "Employment Level - Civ. Labor Force")
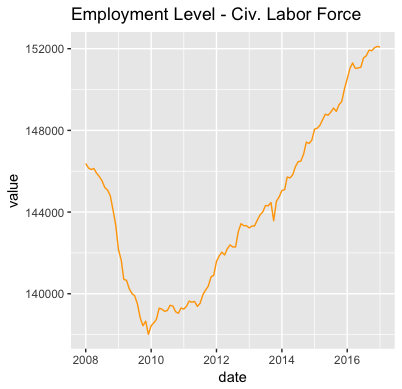
Median Weekly Earnings

library(blscrapeR)
library(tidyverse)
# Median Usual Weekly Earnings by Occupation, Unadjusted Second Quartile.
# In current dollars
df <- bls_api(c("LEU0254530800", "LEU0254530600"), startyear = 2000, endyear = 2016, registrationKey = Sys.getenv("BLS_KEY")) %>%
    spread(seriesID, value) %>% dateCast()
# A little help from ggplot2!
library(ggplot2)
ggplot(data = df, aes(x = date)) + 
    geom_line(aes(y = LEU0254530800, color = "Database Admins.")) +
    geom_line(aes(y = LEU0254530600, color = "Software Devs.")) + 
    labs(title = "Median Weekly Earnings by Occupation") + ylab("value") +
    theme(legend.position="top", plot.title = element_text(hjust = 0.5)) 

For more advanced usage, please see the package vignettes.

Inflation and Consumer Price Index (CPI)

Although there are many measures of inflation, the CPI's "Consumer Price Index for All Urban Consumers: All Items" is normally the headline inflation rate one would hear about on the news (see FRED).

Getting these data from the blscrapeR package is easy enough:

library(blscrapeR)
df <- bls_api("CUSR0000SA0")
head(df)

Due to the limitations of the API, we are only able to gather twenty years of data per request. However the formula for calculating inflation is based on the 1980 dollar, so the data from the API aren't sufficient.

The package includes a function that collects information form the CPI beginning at 1947 and calculates inflation.

To find out the value of a January 2015 dollar in January 2023, we just make a simple function call. Looking at the adj_dollar_value column. We can see that the value of a 2015 dollar in 2023 was approximately $1.32.

df <- inflation_adjust("2015-01-01") %>%
    arrange(desc(date))
head(df)

library(blscrapeR)
# A tibble: 6 × 7
  date       period year  value base_date  adj_dollar_value month_ovr_month_pct_change
  <date>     <chr>  <chr> <dbl> <chr>                 <dbl>                      <dbl>
1 2024-02-01 M02    2024   310. 2015-01-01             1.33                      0.619
2 2024-01-01 M01    2024   308. 2015-01-01             1.32                     -0.105
3 2023-12-01 M12    2023   307. 2015-01-01             1.31                     -0.415
4 2023-12-01 M12    2023   309. 2015-01-01             1.32                      0.651
5 2023-11-01 M11    2023   307. 2015-01-01             1.31                     -0.156
6 2023-11-01 M11    2023   308. 2015-01-01             1.32                      0.317


If we want to check our results, we can head over to the CPI Inflation Calculator on the BLS website.

Annual Inflation Percentage Increase

library(blscrapeR)
library(ggplot2)

ggplot(data = df, aes(x = date)) + 
    geom_line(aes(y = adj_dollar_value, color = "2015 Adjusted Dollar Value")) + 
    labs(title = "Inflation Since 2015") + ylab("2015 Adjusted Dollar Value") +
    theme(legend.position="top", plot.title = element_text(hjust = 0.5)) 


ggplot(data = df, aes(x = date)) + 
    geom_line(aes(y = month_ovr_month_pct_change, color = "MoM Pct Change")) + 
    labs(title = "Month over Month Inflation Pct Change") + ylab("MoM Pct Change") +
    theme(legend.position="top", plot.title = element_text(hjust = 0.5)) 


CPI: Tracking Escalation

Another typical use of the CPI is to determine price escalation. This is especially common in escalation contracts. While there are many different ways one could calculate escalation below is a simple example. Note: the BLS recommends using non-seasonally adjusted data for escalation calculations.

Suppose we want the price escalation of $100 investment we made in January 2014 to February 2015:

Disclaimer: Escalation is normally formulated by lawyers and bankers, the author(s) of this package are neither, so the above should only be considered a code example.

library(blscrapeR)
library(dplyr)
df <- bls_api("CUSR0000SA0",
              startyear = 2014, endyear = 2015)
head(df)

# A tibble: 6 × 6
   year period periodName value footnotes seriesID   
  <dbl> <chr>  <chr>      <dbl> <chr>     <chr>      
1  2015 M12    December    238. ""        CUSR0000SA0
2  2015 M11    November    238. ""        CUSR0000SA0
3  2015 M10    October     238. ""        CUSR0000SA0
4  2015 M09    September   237. ""        CUSR0000SA0
5  2015 M08    August      238. ""        CUSR0000SA0
6  2015 M07    July        238. ""        CUSR0000SA0

# Set base value.
base_value <- 100

# Get CPI from base period (January 2014).
base_cpi <- subset(df, year==2014 & periodName=="January", select = "value")

# Get the CPI for the new period (February 2015).
new_cpi <- subset(df, year==2015 & periodName=="February", select = "value")

# Calculate the updated value of our $100 investment.
round((base_value / base_cpi) * new_cpi, 2)
   value
1 100.02

# Huzzah! We made 2 cents on our $100 investment.

blscraper's People

Contributors

bwu62 avatar keberwein avatar

Stargazers

 avatar  avatar  avatar  avatar  avatar  avatar  avatar  avatar  avatar  avatar  avatar  avatar  avatar  avatar  avatar  avatar  avatar  avatar  avatar  avatar  avatar  avatar  avatar  avatar  avatar  avatar  avatar  avatar  avatar  avatar  avatar  avatar  avatar  avatar  avatar  avatar  avatar  avatar  avatar  avatar  avatar  avatar  avatar  avatar  avatar  avatar  avatar  avatar  avatar  avatar  avatar  avatar  avatar  avatar  avatar  avatar  avatar  avatar  avatar  avatar  avatar  avatar  avatar  avatar  avatar  avatar  avatar  avatar  avatar  avatar  avatar  avatar  avatar  avatar  avatar  avatar  avatar  avatar  avatar  avatar  avatar  avatar  avatar  avatar  avatar  avatar  avatar  avatar  avatar  avatar  avatar  avatar  avatar  avatar  avatar  avatar  avatar  avatar  avatar  avatar

Watchers

 avatar  avatar  avatar  avatar  avatar  avatar  avatar  avatar  avatar  avatar

blscraper's Issues

Pulling Annual QCEW Information

Hi, first time poster so please forgive any ignorance :). I'm taking a class on R now.

BLS provides annual averages for the QCEW information. This vignette is helpful for what I'm trying to get at. But I've only been able to pull down qrtly information. BLS also has annual averages (https://www.bls.gov/cew/datatoc.htm), is there a way to pull those with this package as well? Thanks.

Add tryCatch to get URLs

The get_bls_county.R and get_bls_state.R files both download from URL. I wrote and exported a new function called urlExists() in the utils file. This function needs to be applied to both the above mentioned scripts.

blscrapeR not on CRAN

Hey, first, wanted to say that I love your package. I work at BLS and recommend it to anyone looking to pull BLS data in R over the one we have on our website.

Second was wondering why it's not on CRAN? I forked the package and tried devtools::check() and pandoc is throwing errors (below) when trying to build the vignette. I was wondering if this is the reason its not published and if you have been having this experience.

E  creating vignettes (17.9s)OR
   
   Access violation in generated code when reading 0x8a07568
   
    Attempting to reconstruct a stack trace...
   
      Frame	Code address
    * 0x22daf0	0x4018450 C:\Users\GRIEVE~1\DOCUME~1\RSTUDI~1.120\bin\pandoc\pandoc.exe+0x3c18450
    * 0x22daf8	0x231790
   
   Error: processing vignette 'Mapping_BLS_Data.Rmd' failed with diagnostics:
   pandoc document conversion failed with error 11
   Execution halted
Error in processx::run(bin, args = real_cmdargs, stdout_line_callback = real_callback(stdout),  : 
  System command error

I saw something that might be related in an issue tracker having to do with the version of Pandoc being used rstudio/rstudio#3661

Internal Datasets for Series Codes

If there is an interest in continuing this package, I think it would be useful to have the series id code groups contained in internal datasets. Such as the super sector codes here. That said, at a bare minimum, have the documentation point to the BLS documentation for creating these codes here.

inflation_adjust cannot return values before 1947

> inflate = inflation_adjust(base_year = 1940)
trying URL 'https://download.bls.gov/pub/time.series/cu/cu.data.1.AllItems'
Content type 'text/plain' length unknown
downloaded 2.3 MB

Error in `$<-.data.frame`(`*tmp*`, "adj_value", value = numeric(0)) : 
  replacement has 0 rows, data has 73

Thanks for a wonderfully useful package.

Scale color argument for map functions.

Not a huge deal, but it would be nice to have an argument to allow users to select different colors and break-points for the bls_map_county and bls_map_state functions. I would recommend keeping the current state as the default, so we don't have to bump to a major release.

Add Custom Error Message When User Enters an Invalid BLS ID

Currently, if a user enters an invalid ID. The JSON call returns a blank dataframe, because there is nothing to return.

In this case, the BLS API returns a custom error message. For example, seriesid="SMU197802023800001", when put through the bls_api code will return with a "Success" status, but the jsondat list will contain the message "Series does not exist." Even though the API call was a "Success."

Implement a new part of the function that checks for that message and throws an error to alert the user if detected.

Adding CPI series to `series_ids`

Hi,

Can we get CPI series (e.g. CUSR0000SA0) added to the data frame?

Or, if you can just point me to where I can find a formatted spreadsheet with the id's and the names, I can do the work of adding a df for it and submit a PR. Maybe I'm dumb but I truly can't find a spreadsheet that has the CPI codes labeled nicely.

get_bls_state() assumes that the date_mth is null

I tried running this simple command:
states <- get_bls_state(date_mth=c("January 2016", "February 2016"), seasonality=FALSE)
Unfortunately, no matter what I write for the dates, I only get data from Dec 2016. It appears that the error is in get_bls_state.R - you assume that there is no date passed in rather than checking for NULL. The fix should be one line of code, thankfully.

Thanks for writing this package it's great!

startyear and endyear issues

It seems that when selecting years, the maximum range is 9 years.

For example,

bls_api("LAUCT360100000000003", startyear=2003, endyear=2016)

produces data from 2003.M1 to 2012.M12.

However, data for 2013.M1 to 2016.M12 exists, i.e.

bls_api("LAUCT360100000000003", startyear=2013, endyear=2016)

gives the required data from 2013-2016.

50 seriesID per pull limit?

Hi,

First of all, thanks for your excellent work on this package.

I have a relatively basic usecase where I want to pull 100 different series at once. I want to get the unemployment rate of all 50 states, both seasonally adjusted and unadjusted.

What I noticed though, is that bls_api() only uses the first 50 seriesid's I give it. It'd be fantastic if I could do all 100 at once.

Is this a limit of the BLS's API generally, or is there something in bls_api() that can be adjusted to make this work? Here's an example of what I'm trying to do:

# testing out blscrapeR 
library(blscrapeR)
library(tidyverse)
library(glue)

# getting bls tsv of state codes and sticking to the 50 states
bls_state_codes <- read_tsv("https://download.bls.gov/pub/time.series/sm/sm.state") %>% 
  filter(!str_detect(state_name, "(District of Columbia)|(Puerto Rico)|(Virgin Islands)"))

# idea here is to make a dataframe of the payload, then pull from it for bls_api()
# we then have the df as a table of information to join back in
us_id_df <- bls_state_codes %>% 
  mutate(seasonal_id = glue('LASST{state_code}0000000000003'),  # unemp seasonally adjusted
         unadjusted_id = glue('LAUST{state_code}0000000000003')) %>% # not adjusted
  gather(adjustment, seriesID, -state_code, -state_name) %>% 
  mutate(seriesID = as.character(seriesID))

length(us_id_df$seriesID) # 100 seriesID's

us_state_unemp <- bls_api(us_id_df$seriesID,
                                     startyear = 2019, endyear = 2019,
                                     Sys.getenv("BLS_KEY")) %>%
  # Add time-series dates
  dateCast() %>% 
  select(date, seriesID, value)

glimpse(us_state_unemp) # only 150 rows - should be 300. only the first 50 seriesid's used

us_state_unemp %>% 
  left_join(us_id_df, by = "seriesID")

End year for bls_api function

The BLS API needs an end date argument if a start date is specified. Would be nice to include some logic that would take sys.Date and calculate the current year to use as the end date, rather than the user. The only time this would fail would be in the month of January because there wouldn't be any data for that year. Will have to do some testing there.

This works
df <- bls_api('CES0000000001', startyear = 2008, endyear = 2016, registrationKey = "BLS_KEY")

This doesn't
df <- bls_api('CES0000000001', startyear = 2008, registrationKey = "BLS_KEY")

How to ensure that you're on the higher API limit?

I often hit the API limit using this package. Supposedly I should be able to query the API 500 times a day but my suspicion is that I'm on the lower limit of 25. How can I make sure I'm on the higher limit?

Using for latest data

Running a query to get data through 2023, but the pull only brings back data up through 2017. Is this due to the package not being updated? Or is there an error?

Pass json error message on to user if API fails

The bls_api() function needs to pass the error message found in jsondat$message as an output if the request fails. This will help the end-users and developers to more quickly diagnose connection problems.

Data discrepency, maybe

Hi, I'm seeing a discrepancy in CPI numbers. The series I am using is CUSR0000SA0. I sometimes fetch this data using the "Series Report" page at

https://data.bls.gov/cgi-bin/srgate

I also use the API as follows, for this example:

df1 <- bls_api("CUUR0000SA0",
startyear = 2020,
endyear = 2039,
registrationKey = bls_key)

Using the API call, for 2022-09-01, I get 296.808. Using the Series Report, I get 296.761.

For 2021-01-01, API returns 261.582. Series report returns 262.2.

Add date format argument to datecast() function

This is a pretty simple add for the next release. Currently, the dateCast() function returns a date in ISO 8601 format, which I think most people prefer, however, I'd like to make the date format an argument of the function so end-users can select which format they want. The current line is below. I think it could be cleaned up.

api_df$date <- as.Date(paste(api_df$year, ifelse(api_df$period == "M13", 12, substr(api_df$period, 2, 3)), "01", sep="-"))

Reshape internal map data

Alaska and Hawaii are a little close together. Will have to play with the coordinates in the map_prep script and revise that before the next push to CRAN.

inflation_adjust() returning "403 Forbidden" error

Hi, thank you for your work on this. I'm getting the following error when trying to use the inflation_adjust() function, even the stock example:

Error in download.file("https://download.bls.gov/pub/time.series/cu/cu.data.1.AllItems",  : 
  cannot open URL 'https://download.bls.gov/pub/time.series/cu/cu.data.1.AllItems'
In addition: Warning messages:
1: In download.file("https://download.bls.gov/pub/time.series/cu/cu.data.1.AllItems",  :
  downloaded length 0 != reported length 0
2: In download.file("https://download.bls.gov/pub/time.series/cu/cu.data.1.AllItems",  :
  cannot open URL 'https://download.bls.gov/pub/time.series/cu/cu.data.1.AllItems': HTTP status was '403 Forbidden'

Catalog argument not returning data.

The catalog argument of the bls_api() function is not returning data in some cases. This a side-effect of the BLS API itself as catalog is "only available for certain data sets." Need to add some error-handling to the bls_api() function.

dateCast() on quarterly BED data

df <- bls_api(c("BDS0000000000000000120007LQ5"),
              startyear = 2008, endyear = 2017) %>%
    # Add time-series dates
    dateCast()

The data frame contains 'year' and 'period' columns as returned by the bls_api() function. The 'period' column is Q01, Q02, Q03 or Q04 which dateCast() incorrectly casts to months. For example, year 2010 and period Q03 will cast to date 2010-03-01.

Great package. Thank you.

Document qcew_api

Made a quick fix on the fly #14

To Do:

  • Add if checks to allow users to input quarter argument. To allow user to pass the arg as numeric or character.

  • Update vignettes

  • Make sure tests pass

Series ID lookup

Would like to include a search function for series ids. The BLS has so many IDs that including all of them isn't sustainable. However, we could include a few of the most popular surveys such as the CPS and CES. Would need to scrape the .csv files provided by the BLS and make them internal package data.

https://www.bls.gov/cps/home.htm

blscrapeR functions return function syntax instead of data

I was using this package yesterday evening and the code was working correctly by returning the actual data.
This morning, I noticed that my code was no longer working. The code is below.

library(devtools)
devtools::install_github("keberwein/blscrapeR")
library(blscrapeR)
bls_api("CUUR0000SA0", startyear = "2010", endyear = "2017")

The returned output is:

function (x, df1, df2, ncp, log = FALSE)
{
if (missing(ncp))
.Call(C_df, x, df1, df2, log)
else .Call(C_dnf, x, df1, df2, ncp, log)
}
<bytecode: 0x00000000087bc150>
<environment: namespace:stats>

bls_api() returning corrupted data

bls_api() is returning corrupted data. A call to a date range that includes the latest record of one of the data series results in a warning "number of columns of result is not a multiple of vector length (arg 2)." When this happens, the first and most recent record appears to have an extra column, latest, that is missing in subsequent records. bls_api() seems to be handling this by filling the data from subsequent rows and then padding the last column with data from the first column, resulting in corruption of the data frame.

The columns for the first row appear to be

year    period    periodName    latest    value    footnotes    seriesID

where latest is only present for the first/most recent record, and contains the value TRUE.

In subsequent rows, the column latest appears to missing, but the data is filled in using values from the columns:

year    period    periodName    value    footnotes    seriesID    year

Below are four example codes. The first two show the results of the call to bls_api() directly, and the second two show the result after tidyr::unnest() to convert list columns to vectors.

The first and third examples are successful, pulling data as expected for years 1980 through 2000. The second and fourth both show the problem, pulling data for years 2000 through 2018. The latest record that actually exists (at time of this writing) is for period M12 of 2017, and when pulled through the BLS site interface at https://data.bls.gov/cgi-bin/srgate is reported as preliminary. i.e., the row on the website looks like

LAUMT263474000000003 | 2017 | M12 | 5.3(P)
> bls_api(seriesid = "LAUMT263474000000003", startyear = 1980, endyear = 2000, registrationKey = Sys.getenv("BLS_KEY"))
REQUEST_SUCCEEDED
# A tibble: 120 x 6
    year period    periodName value footnotes seriesID 
   <dbl> <list>    <list>     <dbl> <list>    <list>   
 1  1999 <chr [1]> <chr [1]>   3.60 <chr [1]> <chr [1]>
 2  1999 <chr [1]> <chr [1]>   3.80 <chr [1]> <chr [1]>
 3  1999 <chr [1]> <chr [1]>   3.70 <chr [1]> <chr [1]>
 4  1999 <chr [1]> <chr [1]>   3.70 <chr [1]> <chr [1]>
 5  1999 <chr [1]> <chr [1]>   3.80 <chr [1]> <chr [1]>
 6  1999 <chr [1]> <chr [1]>   4.50 <chr [1]> <chr [1]>
 7  1999 <chr [1]> <chr [1]>   5.10 <chr [1]> <chr [1]>
 8  1999 <chr [1]> <chr [1]>   4.30 <chr [1]> <chr [1]>
 9  1999 <chr [1]> <chr [1]>   4.20 <chr [1]> <chr [1]>
10  1999 <chr [1]> <chr [1]>   4.20 <chr [1]> <chr [1]>
# ... with 110 more rows
> bls_api(seriesid = "LAUMT263474000000003", startyear = 2000, endyear = 2018, registrationKey = Sys.getenv("BLS_KEY"))
REQUEST_SUCCEEDED
# A tibble: 216 x 7
    year period    periodName latest    value footnotes seriesID 
   <dbl> <list>    <list>     <list>    <dbl> <list>    <list>   
 1  2017 <chr [1]> <chr [1]>  <chr [1]>  5.30 <chr [1]> <chr [1]>
 2  2017 <chr [1]> <chr [1]>  <chr [1]> NA    <chr [1]> <chr [1]>
 3  2017 <chr [1]> <chr [1]>  <chr [1]> NA    <chr [1]> <chr [1]>
 4  2017 <chr [1]> <chr [1]>  <chr [1]> NA    <chr [1]> <chr [1]>
 5  2017 <chr [1]> <chr [1]>  <chr [1]> NA    <chr [1]> <chr [1]>
 6  2017 <chr [1]> <chr [1]>  <chr [1]> NA    <chr [1]> <chr [1]>
 7  2017 <chr [1]> <chr [1]>  <chr [1]> NA    <chr [1]> <chr [1]>
 8  2017 <chr [1]> <chr [1]>  <chr [1]> NA    <chr [1]> <chr [1]>
 9  2017 <chr [1]> <chr [1]>  <chr [1]> NA    <chr [1]> <chr [1]>
10  2017 <chr [1]> <chr [1]>  <chr [1]> NA    <chr [1]> <chr [1]>
# ... with 206 more rows
Warning message:
In rbind(list(year = "2017", period = "M12", periodName = "December",  :
  number of columns of result is not a multiple of vector length (arg 2)

With tidyr::unbind()

> bls_api(seriesid = "LAUMT263474000000003", startyear = 1980, endyear = 2000, registrationKey = Sys.getenv("BLS_KEY")) %>% 
+   tidyr::unnest()
REQUEST_SUCCEEDED
# A tibble: 120 x 6
    year value period periodName footnotes seriesID            
   <dbl> <dbl> <chr>  <chr>      <chr>     <chr>               
 1  1999  3.60 M12    December   ""        LAUMT263474000000003
 2  1999  3.80 M11    November   ""        LAUMT263474000000003
 3  1999  3.70 M10    October    ""        LAUMT263474000000003
 4  1999  3.70 M09    September  ""        LAUMT263474000000003
 5  1999  3.80 M08    August     ""        LAUMT263474000000003
 6  1999  4.50 M07    July       ""        LAUMT263474000000003
 7  1999  5.10 M06    June       ""        LAUMT263474000000003
 8  1999  4.30 M05    May        ""        LAUMT263474000000003
 9  1999  4.20 M04    April      ""        LAUMT263474000000003
10  1999  4.20 M03    March      ""        LAUMT263474000000003
# ... with 110 more rows
> bls_api(seriesid = "LAUMT263474000000003", startyear = 2000, endyear = 2018, registrationKey = Sys.getenv("BLS_KEY")) %>% 
+   tidyr::unnest()
REQUEST_SUCCEEDED
# A tibble: 216 x 7
    year value period periodName latest footnotes            seriesID            
   <dbl> <dbl> <chr>  <chr>      <chr>  <chr>                <chr>               
 1  2017  5.30 M12    December   true   P Preliminary.       LAUMT263474000000003
 2  2017 NA    M11    November   4.9    LAUMT263474000000003 2017                
 3  2017 NA    M10    October    5.2    LAUMT263474000000003 2017                
 4  2017 NA    M09    September  5.3    LAUMT263474000000003 2017                
 5  2017 NA    M08    August     5.8    LAUMT263474000000003 2017                
 6  2017 NA    M07    July       6.2    LAUMT263474000000003 2017                
 7  2017 NA    M06    June       4.8    LAUMT263474000000003 2017                
 8  2017 NA    M05    May        4.4    LAUMT263474000000003 2017                
 9  2017 NA    M04    April      3.9    LAUMT263474000000003 2017                
10  2017 NA    M03    March      4.8    LAUMT263474000000003 2017                
# ... with 206 more rows
Warning message:
In rbind(list(year = "2017", period = "M12", periodName = "December",  :
  number of columns of result is not a multiple of vector length (arg 2)

Change in LAU website layout?

Hi Kris! I tried to run your vignette code for a Florida county unemployment map, replacing Florida with Ohio. I got this result:

trying URL 'http://www.bls.gov/lau/laucntycur14.txt'
Error in download.file("http://www.bls.gov/lau/laucntycur14.txt", temp) :
cannot open URL 'http://www.bls.gov/lau/laucntycur14.txt'
In addition: Warning message:
In download.file("http://www.bls.gov/lau/laucntycur14.txt", temp) :
cannot open URL 'http://www.bls.gov/lau/laucntycur14.txt': HTTP status was '404 Not Found'

This seems to be an issue with redesign of the LAU website, rather than your code per se. When I entered the URL above manually, I got the same error.

If you figure out where these files have moved, I wouldn't mind knowing what it is. Thanks!

Andrew Hoerner
[email protected]

bls_api() suddenly returning error message

Hello,

I recently discovered that every time I run the bls_api() function, I now receive the following error message:

Error in if (jsondat$status == "REQUEST_SUCCEEDED") { :
argument is of length zero

This has never happened before. I updated my rlang package to the latest version but am still receiving the error, no matter which series IDs I request.

Thanks for your help,
Kevin

"A" vs "a" in annual data

First off, I really appreciate this package. I was having a bit of a struggle getting annual data. The docs say to use qtr = "A", but I get an error; if I use qtr = "a", it comes through okay. Likewise, going to the URL https://data.bls.gov/cew/data/api/2017/A/area/09009.csv gets me a "Not found" error, but with a lowercase a it's fine. I'm not sure if this is something that changed in the API on their end.

library(blscrapeR)

nhv1 <- qcew_api(year = 2017, qtr = "a", slice = "area", sliceCode = "09009")
#> Please set a numeric year.
#> Trying BLS servers...
#> Payload successful.
nhv2 <- qcew_api(year = 2017, qtr = "A", slice = "area", sliceCode = "09009")
#> Please set a numeric year.
#> Trying BLS servers...
#> URL caused a warning. Please check your parameters and try again: https://data.bls.gov/cew/data/api/2017/A/area/09009.csv
#> Error in qcew_api(year = 2017, qtr = "A", slice = "area", sliceCode = "09009"): object 'qcewDat' not found

bls_api returns df as type function

While running the bls_api, it is converting the dataframe it should create as a function. The function looks like below

function (x, df1, df2, ncp, log = FALSE) 
{
  if (missing(ncp)) 
    .Call(C_df, x, df1, df2, log)
  else .Call(C_dnf, x, df1, df2, ncp, log)
}

Here is my full code I am using

library(tidyverse)
library(blscrapeR)

msa <- read.delim("https://raw.githubusercontent.com/smitty1788/Personal-Website/master/dl/MSA_Codes.txt",
                header = FALSE) %>% 
  rename(area_code = V2, area_text = V3) %>% 
  select(area_code, area_text) %>% 
  mutate(CBSA_ID = substr(area_code, 5, 9))

MSA_LAUS <- tibble(date = character(),
                   labor_force = numeric(),
                   employment = numeric(),
                   unemployment = numeric(),
                   unemployment_rate = numeric(),
                   CBSA_ID = character(),
                   area_text = character())

for (i in 1:395) {
  ac <- as.character(msa$CBSA_ID[i])
  at <- as.character(msa$area_text[i])
  
  labor_force <- as.character(paste0("LAU", msa$area_code[i], "06"))
  employment <- as.character(paste0("LAU", msa$area_code[i], "05"))
  unemployment <- as.character(paste0("LAU", msa$area_code[i], "04"))
  unemployment_rate <- as.character(paste0("LAU", msa$area_code[i], "03"))
  
  x <- as.vector(c(labor_force, employment, unemployment, unemployment_rate))
  series_id <- tibble(
    name = c("labor_force", "employment", "unemployment", "unemployment_rate"),
    id = c(labor_force, employment, unemployment, unemployment_rate)
  )
  
  labor <- bls_api(x, startyear = '2002', endyear = '2010')
  laus <- labor %>% 
    mutate(seriesID = as.character(seriesID)) %>% 
    merge(series_id, by.x = 'seriesID', by.y = 'id', all.x = TRUE) %>%
    filter(!is.na(name)) %>% 
    select(year, periodName, name, value) %>% 
    spread(name, value = value) %>% 
    mutate(date = as.Date(paste0(as.character(year), " ", as.character(periodName), " ", "01"), '%Y %B %d'),
           CBSA_ID = ac,
           area_text = at) %>% 
    select(date, labor_force, employment, unemployment, unemployment_rate, CBSA_ID, area_text)
  
  MSA_LAUS <- rbind(MSA_LAUS, laus)
}

The error returns as

Error in UseMethod("mutate_") : 
  no applicable method for 'mutate_' applied to an object of class "function"

Out of date for R 4.2.2

I'm trying to install this package using R 4.2.2, getting the following error:

Warning in install.packages :
  package ‘blscrapeR’ is not available for this version of R

A version of this package for your version of R might be available elsewhere,
see the ideas at
https://cran.r-project.org/doc/manuals/r-patched/R-admin.html#Installing-packages

When installing via devtools:

Installing package into ‘C:/Users/danmi/AppData/Local/R/win-library/4.2’
(as ‘lib’ is unspecified)
* installing *source* package 'blscrapeR' ...
** using staged installation
** R
** data
*** moving datasets to lazyload DB
** byte-compile and prepare package for lazy loading
Error in loadNamespace(i, c(lib.loc, .libPaths()), versionCheck = vI[[i]]) : 
  namespace 'rlang' 1.0.6 is already loaded, but >= 1.1.0 is required
Calls: <Anonymous> ... asNamespace -> loadNamespace -> namespaceImport -> loadNamespace
Execution halted
ERROR: lazy loading failed for package 'blscrapeR'
* removing 'C:/Users/danmi/AppData/Local/R/win-library/4.2/blscrapeR'
Warning: installation of package ‘C:/Users/danmi/AppData/Local/Temp/Rtmpg3muiy/file828125135fc/blscrapeR_3.2.2.tar.gz’ had non-zero exit status

Is there a way to install this on the latest version of R? Or do I need to revert to an older version? If so, which is the most recent version of R that's compatible?

Make dates an optional argument for bls_api function

The API does not return a standard date. Rather, it returns a month and year. In the past, we've forced a standard yyyy-mm-dd on folks in the returned data. Since this date is something added by the package and not native to the data, we should make it a T/F option.

Remove xts and zoo as dependencies

The xts and zoo packages exist as dependencies only for the inflation_adust function. Rewrite the function in base and get rid of these two dependencies.

Limits on series id?

I am trying to experiment with different series id values using the BLS documentation found here. I am particularly interested in the 'State and Area employment, hours, and earnings. However, even the sample series id fails to pull with the following minor change.

example from BLS

all_earnings <- bls_api(seriesid="SMU197802023800001",
                        startyear=2019)

However, if I modify the first two numeric values to 55 indicating Wisconsin as opposed to Iowa I just get the following indicating what seems to be success and failure.

wis_earnings <- bls_api(seriesid="SMU557802023800001",
                        startyear=2019)
The API requires both a start and end year.
The endyear argument has automatically been set to 2021.
REQUEST_SUCCEEDED
Warning message:
Unknown or uninitialised column: `value`.

This results in a dataframe that is empty. Any insight would be appreciated.

Recommend Projects

  • React photo React

    A declarative, efficient, and flexible JavaScript library for building user interfaces.

  • Vue.js photo Vue.js

    🖖 Vue.js is a progressive, incrementally-adoptable JavaScript framework for building UI on the web.

  • Typescript photo Typescript

    TypeScript is a superset of JavaScript that compiles to clean JavaScript output.

  • TensorFlow photo TensorFlow

    An Open Source Machine Learning Framework for Everyone

  • Django photo Django

    The Web framework for perfectionists with deadlines.

  • D3 photo D3

    Bring data to life with SVG, Canvas and HTML. 📊📈🎉

Recommend Topics

  • javascript

    JavaScript (JS) is a lightweight interpreted programming language with first-class functions.

  • web

    Some thing interesting about web. New door for the world.

  • server

    A server is a program made to process requests and deliver data to clients.

  • Machine learning

    Machine learning is a way of modeling and interpreting data that allows a piece of software to respond intelligently.

  • Game

    Some thing interesting about game, make everyone happy.

Recommend Org

  • Facebook photo Facebook

    We are working to build community through open source technology. NB: members must have two-factor auth.

  • Microsoft photo Microsoft

    Open source projects and samples from Microsoft.

  • Google photo Google

    Google ❤️ Open Source for everyone.

  • D3 photo D3

    Data-Driven Documents codes.