kobsio / kobs Goto Github PK
View Code? Open in Web Editor NEWKubernetes Observability Platform
Home Page: https://kobs.io
License: MIT License
Kubernetes Observability Platform
Home Page: https://kobs.io
License: MIT License


![dependabot[bot] avatar](https://avatars.githubusercontent.com/in/29110?v=4 "dependabot[bot]")


At the moment it is difficult to extend the supported variables in the Dashboard component with new options, e.g. an option from the Azure plugin, which loads all resource groups or an option in the klogs plugin which allows users to select a value from a field.
The problem is that all options for the variables are defined within the following function:
A better solution would be to define the options to load variable values in the plugin, for example we can add a new optional field to the IPluginComponent interface:
export interface IPluginComponent {
  home?: React.FunctionComponent<IPluginPageProps>;
  icon: string;
  page?: React.FunctionComponent<IPluginPageProps>;
  panel: React.FunctionComponent<IPluginPanelProps>;
  preview?: React.FunctionComponent<IPluginPreviewProps>;
  variables?: (variable: IVariable) => IVariableValues;
}
With the new variables field we can then define function for each plugin which takes the user defined variable (type: IVariable), then runs the plugin logic / executes the API request and returns the variable values (type: IVariableValues).
kobs is build around the concept of applications, which can be used to describe all aspects of operation a service on Kubernetes. At the moment the applications "plugin" lacks some important features:
In the next steps we should concentrate our focus on these issues.
/applications), but not on the page for a single application (/application). This should be changed, so that describing applications via tags, becomes more useful. It should also be possible to filter a list of applications by the defined tags. Here we have to decide if we want to ignore the select cluster / namespace while filtering for tags or if the selected cluster / namespace should also be included. At the moment I prefer the second option, because we can leave the list of namespaces empty.style in the configuration which is then added based on tags or based on a new property in the Application CR. Last but not least it would also be nice to allow users to define dashboards / panels in the dependencies array of an application, which are then displayed when the user selects the edge between two applications. NOTE: We have to decide how we want to display applications in the topology chart, which do not match the tags (remove them vs. lower opacity).I like the idea of applications which is the start of application-centric approach. I succeed to login kobs with authentication enabled via keycloak provider. However, it seems that the logged in user can view/access all the applications filtered by cluster and namespace but not by the team which the user belongs to.
A team defined in the application cr.
apiVersion: kobs.io/v1
kind: Application
metadata:
  name: reviews
  namespace: bookinfo
spec:
   ...
  teams:
  - name: not-existing
    namespace: kobs
    cluster: kobs
  ...
teamCluster, teamNamespace and teamName in the following code snippet are always nil. If I'm not mistaken, they could be used to filter the applications.
applications.go

func (router *Router) getApplications(w http.ResponseWriter, r *http.Request) {
	clusterNames := r.URL.Query()["cluster"]
	namespaces := r.URL.Query()["namespace"]
	tagsList := r.URL.Query()["tag"]
	view := r.URL.Query().Get("view")
	teamCluster := r.URL.Query().Get("teamCluster")
	teamNamespace := r.URL.Query().Get("teamNamespace")
	teamName := r.URL.Query().Get("teamName")
The logged in user can only view/access the applications owned by his/her team.
This is a collection of the next features for the Azure plugin:
types for the Azure plugin. Their implementation should follow the style of the other supported resources. These two resources can be named computeinstances and loadbalancers in the panel.DetailsVirtualMachines component is used within a panel in a dashboard. The details panel should contain the most important metrics for the selected Virtual Machine and the mounted disks including their metrics.tail view in the logs panel. Within this we can also fix a small issue with the select component to switch between the different contains in the logs view, where the options list isn't closed after a container was selected.Describe the bug
When we select a time range to view get some data, e.g. metrics in the Prometheus plugin, we are adding the time, timeEnd and timeStart parameter to the URL. When we then copy this URL and open it a day later, it will still use the selected time range, but in the options dialog it shows Last 15 Minutes.
To Reproduce
Last 15 Minutes but uses the time range from some minutes agoExpected behavior
When the URL is opened, it should use the formerly selected time range, but it should show the custom time range instead of Last 15 Minutes.
Additional context
At the moment we have to pass the time parameter within the URL so that we can refresh the page. It would be better to not set the time parameter and instead change it directly in the state.
This must be done in nearly all plugins, so that we should create a general function in the core plugin to parse the search location which can be used across plugins. Then we can pass the time as additional parameter to this function and use it directly, so that we do not have to add it to the URL.
When a user then opens a plugin, we can decide on the provided parameter what we want to do:
timeEnd and timeStart parameters are present, we use them to set a custom time range.time parameter is present we, use it to set the time range, but where the timeStart is the current time and not a old one.I'm always frustrated when entering queries over and over, that I have to manually enter each field (attribute). Imho this is unnecessary type-work and can lead to typos etc.
Example:

There are none afaik. You can only manually copy fields or fully queries from e.g. a text field on your computer to Klogs, but there is no autocompletion yet.
It would be nice to have a notifications item, next to the settings and help icon in the header. When a user clicks on this icon a list of notifications should be shown.
We add a new item to the header in the form of a notification icon. When a user clicks on the icon a notification drawer is shown, with a list (divided by groups) of notifications.
This notifications can be retrieved via plugins, in the first iteration it should be ok to support:
resources plugin to show a list of Kubernetes Events from the different clusters / a list of unhealthy workloadsopsgenie plugin to show open alerts / open incidents from Opsgenie.What exactly is shown can be customized via the hub configuration file. There an administrator should be able to define the plugins which are used in the notifications and the corresponding options / queries to get the data.
Helm is a popular package manager for Kubernetes, so it would be nice if we can also add support for Helm. This way we can allow users to manage their Helm releases via the kobs.
A new plugin helm should be added, which shows a list of Helm releases. This list can then be filtered by clusters and namespaces. When the user selects a Helm release from the list a details panel is opened, with the current status, values and history of the release. Besides that a user should also be able to rollback the version of a release and maybe it should also be possible to delete a release. It should be possible to define these action on the user and team level via the plugin permissions when authentication is enabled.
For the panel implementation of the plugin it should be possible to show a list of Helm releases (by clusters / namespaces) or a single Helm release, which can be selected via cluster / namespace / name.
Docker build / compose as described in the CONTRIBUTION guide is not working (Mac)
 > [app 6/6] RUN make generate-assets:
#22 0.601 yarn run v1.22.19
#22 0.655 $ lerna run build:shared --stream
#22 1.225 lerna notice cli v5.5.0
#22 1.356 lerna info Executing command in 1 package: "yarn run build:shared"
#22 1.606 @kobsio/shared: $ tsc
#22 8.278 lerna success run Ran npm script 'build:shared' in 1 package in 6.9s:
#22 8.279 lerna success - @kobsio/shared
#22 8.291 $ lerna run build --stream
#22 8.636 lerna notice cli v5.5.0
#22 8.737 lerna info Executing command in 22 packages: "yarn run build"
#22 9.227 @kobsio/app: $ react-scripts build
#22 9.406 @kobsio/plugin-datadog: $ PUBLIC_URL='/plugins/datadog' react-scripts build
#22 9.495 @kobsio/plugin-azure: $ PUBLIC_URL='/plugins/azure' react-scripts build
#22 9.568 @kobsio/plugin-elasticsearch: $ PUBLIC_URL='/plugins/elasticsearch' react-scripts build
#22 9.633 @kobsio/plugin-flux: $ PUBLIC_URL='/plugins/flux' react-scripts build
#22 15.38 @kobsio/plugin-flux: Creating an optimized production build...
#22 15.44 @kobsio/plugin-elasticsearch: Creating an optimized production build...
#22 15.47 @kobsio/plugin-datadog: Creating an optimized production build...
#22 15.56 @kobsio/app: Creating an optimized production build...
#22 15.62 @kobsio/plugin-azure: Creating an optimized production build...
#22 107.7 @kobsio/app: /kobs/node_modules/@kobsio/react-scripts/scripts/build.js:19
#22 107.8 @kobsio/app:   throw err;
#22 107.8 @kobsio/app:   ^
#22 107.8 @kobsio/app: RpcIpcMessagePortClosedError: Process 259 exited [SIGKILL].
#22 107.8 @kobsio/app:     at /kobs/node_modules/fork-ts-checker-webpack-plugin/lib/rpc/rpc-ipc/RpcIpcMessagePort.js:19:23
#22 107.8 @kobsio/app:     at Generator.next (<anonymous>)
#22 107.8 @kobsio/app:     at /kobs/node_modules/fork-ts-checker-webpack-plugin/lib/rpc/rpc-ipc/RpcIpcMessagePort.js:8:71
#22 107.8 @kobsio/app:     at new Promise (<anonymous>)
#22 107.8 @kobsio/app:     at __awaiter (/kobs/node_modules/fork-ts-checker-webpack-plugin/lib/rpc/rpc-ipc/RpcIpcMessagePort.js:4:12)
#22 107.8 @kobsio/app:     at ChildProcess.handleExit (/kobs/node_modules/fork-ts-checker-webpack-plugin/lib/rpc/rpc-ipc/RpcIpcMessagePort.js:18:42)
#22 107.8 @kobsio/app:     at ChildProcess.emit (node:events:513:28)
#22 107.8 @kobsio/app:     at Process.ChildProcess._handle.onexit (node:internal/child_process:291:12) {
#22 107.8 @kobsio/app:   code: null,
#22 107.8 @kobsio/app:   signal: 'SIGKILL'
#22 107.8 @kobsio/app: }
#22 108.1 @kobsio/app: error Command failed with exit code 1.
#22 108.1 @kobsio/app: info Visit https://yarnpkg.com/en/docs/cli/run for documentation about this command.
#22 108.3 lerna ERR! yarn run build exited 1 in '@kobsio/app'
#22 108.3 lerna WARN complete Waiting for 5 child processes to exit. CTRL-C to exit immediately.
#22 108.7 error Command failed with exit code 1.
#22 108.7 info Visit https://yarnpkg.com/en/docs/cli/run for documentation about this command.
#22 108.8 make: *** [Makefile:61: generate-assets] Error 1
------
executor failed running [/bin/sh -c make generate-assets]: exit code: 2
docker build -f ./cmd/kobs/Dockerfile -t kobsio/kobs:dev . or cd deploy/docker && docker-compose up
Build is working
If applicable, add screenshots to help explain your problem.
Add any other context about the problem here.
node --version
v19.3.0
go version
go version go1.19.1 darwin/amd64
To be the one place for developers it would be nice if kobs can support for Pingdom. That way users can add their defined Pingdom checks to an Application CR, to view the external monitored uptime / response time within kobs.
The Pingdom plugin should support the following features in it's first version:
The API documentation for Pingdom can be found at https://docs.pingdom.com/api/.
Describe the bug
A clear and concise description of what the bug is.
To Reproduce
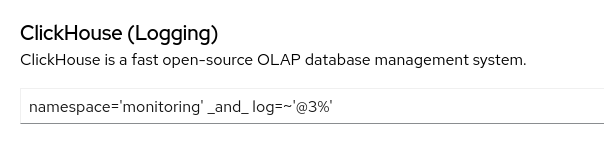
https://<your-kobs-instance>/clickhouse-loggingnamespace='monitoring' _and_ log=~'%403%'namespace='monitoring' _and_ log=~'@3%'Expected behavior
When using ILIKE its not desired to have percent sequences interpreted as URL encoding
Screenshots

Additional context
n/a
Describe the bug
The Jaeger traces are not refreshed when changing the service.
To Reproduce
Expected behavior
URL changes and triggers change of the traces in the results view.
Screenshots
Additional context
Hi Team,
Kindly share configuration documents with steps to configure the new Plugin which will be useful to configure and test the new plugin.
We implemented a new plugin but we are not able to integrate it with kobs. Maybe we are missing some configuration ?.Please share detailed configuration steps.
Thanks,
Harry
The actions like closing or snoozing an alert can be enabled / disabled via the Opsgenie configuration, but they can not be controlled on a per user / team level.
In #219 we implemented a permission schema for plugins, which is already used for the Azure plugin. We should adopt this schema for the Opsgenie plugin, so that the actions can be enabled for each user / team seperatly.
Besides the adjustment of the permissions schema, we should also add actions for incidents similar to the ones for alerts. With these new actions users should be able to resolve and close alerts.
The permission scheme for the Opsgenie plugin can look as follows:
---
apiVersion: kobs.io/v1beta1
kind: Team
metadata:
  name: team1
spec:
  id: [email protected]
  permissions:
    plugins:
      - name: opsgenie
        permissions:
          - closeAlert
          - snoozeAlert
          - acknowledgeAlert
          - resolveIncident
          - closeIncident
In the above example all users which are part of team1 can close, snooze and acknowledge alerts and they can resolve and close incidents.
The permissions property of a plugin contains a list of actions, which are allowed for a user / team. This way we can simply merge the actions list, when the plugin permissions are defined for multiple teams or on the user and team level.
With the new permission handling in the Opsgenie plugin, we can unify the permission handling in plugins, which makes the permission handling easier for users.
One thing we have to consider is, that when we are using this permission model, we would remove the options to control the allowed actions, for users which are using kobs with out the auth middleware.
The goal of kobs is it to simplify the operation of services on Kubernetes by providing the concept of applications. This way all the important information for a service like metrics, logs, traces and alerts can be find in one place. It would be nice when these information can also be connected via integrations.
An integration should allow users to connect all information of a service on a plugin level, for example:
traceID, it should be possible to open the corresponding trace in the Jaeger plugin.guid:x-request-id=628d57f7-1978-99f1-aace it should be possible to open the corresponding access logs in the klogs plugin (content.request_id='628d57f7-1978-99f1-aace').These integration should be configured in the kobs configuration file in the section of each plugin, which means that we can add a new integrations field to the configuration of each plugin, which should support this feature.
To have not that much breaking changes in the plugin configurations in the future, we should have a "scaleable" solution for this feature in place. Currently my preferred way of implementing this, is to add a type field for each integration, where we can then use the type name as another key to define the options for the integration. We are already using this schema in various places, e.g. the provider configuration of clusters:
Currently the documentation is published every time a file in the docs folder is changed. It would be nice to support multiple versions for the documentation.
When we change sth. in the main branch the documentation is published under a main tag and when we create a new tag another version for the documentation is published under the tag name (e.g. 1.0.0). This way users can view the documentation for their installed version of kobs and are not confused by new features.
This can be implemented via mike. More information regarding the setup can be found at https://squidfunk.github.io/mkdocs-material/setup/setting-up-versioning/.
When implementing this feature we have to check if we have to delete the current files in the gh-pages branch manually or if this is done automatically.
For the GitHub Action we can use the same on keys as for the Docker image. The only disadvantage of this approach is, that the documentation is published on each commit to the main branch, also when there are no updates.
Helm deployment lacks v0.12.0 container image:ghcr.io/kobsio/kobs:v0.12.0
I'd like to run (non-modifying) aggregation pipelines on MongoDB collections. Currently, only "find" and "count" are available
In the "Query Documents" view, in the "operation" drop-down, I'd like to select the option "aggregate" and then enter an aggregation pipeline in the "query" field.
Currently, I open a shell in the mongodb container (also via kobs) and do it on the command line.
{{ .namespace }} and {{ .pod }} values are not getting populated after selecting from placeholder.


As per the selection query should be
"query": "container_cpu_usage_seconds_total{namespace="sct-stride-fe", image!="", pod=~".*", container!="POD", container!=""}",
I'm always frustrated when entering queries manually and actively searching, that only after I executed the search, some kind of Backend validation kicks in and "tells me" (the feedback is not really good there for a normal user) that my query input may was invalid.

Examples for invalid data:
attribute_foo="bar" (wrong quotes)a='42' _and_ (foo='bar' (missing bracket)Some basic query syntax validation to prevent errors and give better feedback to the user
none
If we can add a feature to create a dashboard using logs by adding gauge or histogram, so instead of searching logs we can visualize the dashboards directly from Elastic Search or Splunk, just the same way we have added Prometheus Query So that we can create our own dashboards.

We are getting the below error:
Could not initialize clusters context
Unexpected token < in JSON at position 0
We are using kubeconfig as a provider. Can anyone help me what exactly I am missing in the helm chart:
https://github.com/kobsio/helm-repository/blob/main/kobs-0.7.3.tgz
    clusters:
      providers:
        - provider: kubeconfig
          kubeconfig:
            path: /kobs/.kube/config```
Can anyone help me to build kobs locally, I am using Mac for this?

How to solve this

Currently we are always showing the Applications, Topology, Teams, Kubernetes Resources and Plugins in the navigation bar. It would be nice to allow users to customize this.
An administrator of kobs should able to add additional items to the navigation bar via the hub configuration file. For that he should be able to define to define groups (NavGroup) and item (NavItem) which are pointing to dashboards. It should be possible to nest the navigation items, so that the sub items are shown in a flyout.
It should only be possible to link to dashboards via the navigation bar. If a user wants to link to a specific plugin it would be better to introduce an application launcher.
I'm always frustrated when heavily using Klogs that it does not recognize the past queries that I used for searching.
Some kind of Query History that saves the last X (e.g. 10) queries that I used in Klogs.
In the context of the Klogs input field I have some option to select (or better: match) from a list of my past queries (if there are some), select one - and that query gets automatically set as input for the Klogs search.
Manually saving Klogs queries on my computer

- size: 3 panels: - title: Dashboards plugin: name: grafana options: type: dashboards dashboards: - Uui0pIGGz - 7Wushy_mk
Is your feature request related to a problem? Please describe.
Currently we can view the Istio metrics in kobs via the Prometheus or Kiali plugin. It would be nice to have another view where we can see the success rate, request per seconds and the latency for each application in a table view. This table can be filtered by namespace and when an application is selected, we got the details for this application.
Describe the solution you'd like
Similar to the other plugins a new Istio plugin can be created. Each instance of the plugin can then be configured with the name of a Prometheus instance from which we retrieve the relevant information. It is also possible to add a logging plugin (ClickHouse or Elasticsearch) to also see the access logs from Istio and a Jaeger instance.
With this configuration we can directly call the Prometheus, ClickHouse or Jaeger plugin from the frontend or we can pass the configured instances to the Istio configuration on the backend side and proxy the requests there.
The frontend of the plugin is a simple table with the following columns: Application, Success Rate (SR), Requests per Second (RPS), P50 Latency, P95 Latency, P99 Latency. This table can be filtered by a list of namespaces. When a row from the table is selected the user will be redirected to the corresponding details page, where he can see the same metrics for each Pod of the application.
Besides that it would also be good to have the Kiali graph for the selected application, where we can see the mentioned metrics for all the inbound and outbound requests from/to other services.
In further steps we can also show the access logs for the application and the traces on this page or add them as links for the corresponding plugins.
Describe alternatives you've considered
We can build something similar via Dashboards, but there we are limited in the options. For that an additional plugin for Istio would be really useful.
Additional context
The Linkerd dashboard is very good and sth. similar would be awsome: https://linkerd.io/2.10/features/dashboard/. Another good example can be found in the following blog post: https://banzaicloud.com/blog/backyards-traffic-tap/.
It would be nice to have an overview of all open alerts from an Alertmanager instance. The plugin should support a similar feature set like the Opsgenie plugin.
It should be possible to view all open and silenced alerts from a configured Alertmanager instance. A user should also be able to filter the list of shown alerts and to silence an alert via kobs.
For the silence alert function, the plugin should use a similar logic like the Opsgenie plugin, this means:
A declarative, efficient, and flexible JavaScript library for building user interfaces.
🖖 Vue.js is a progressive, incrementally-adoptable JavaScript framework for building UI on the web.
TypeScript is a superset of JavaScript that compiles to clean JavaScript output.
An Open Source Machine Learning Framework for Everyone
The Web framework for perfectionists with deadlines.
A PHP framework for web artisans
Bring data to life with SVG, Canvas and HTML. 📊📈🎉
JavaScript (JS) is a lightweight interpreted programming language with first-class functions.
Some thing interesting about web. New door for the world.
A server is a program made to process requests and deliver data to clients.
Machine learning is a way of modeling and interpreting data that allows a piece of software to respond intelligently.
Some thing interesting about visualization, use data art
Some thing interesting about game, make everyone happy.
We are working to build community through open source technology. NB: members must have two-factor auth.
Open source projects and samples from Microsoft.
Google ❤️ Open Source for everyone.
Alibaba Open Source for everyone
Data-Driven Documents codes.
China tencent open source team.