Giter Site home page Giter Site logo

kylebarron / usgs-topo-tiler Goto Github PK

View Code? Open in Web Editor NEW
76.0 6.0 3.0 11.05 MB

Python package to read Web Mercator map tiles from USGS Historical Topographic Maps

Home Page: https://kylebarron.dev/usgs-topo-mosaic

License: MIT License

Python 100.00%
rasterio usgs usgs-data topographic-maps cogeo-mosaic cloud-optimized-geotiff

usgs-topo-tiler's Introduction

usgs-topo-tiler

Python package to read Web Mercator map tiles from USGS Historical Topographic Maps, and utilities to create a MosaicJSON collection from these maps.

Grand Canyon Historical Mosaic

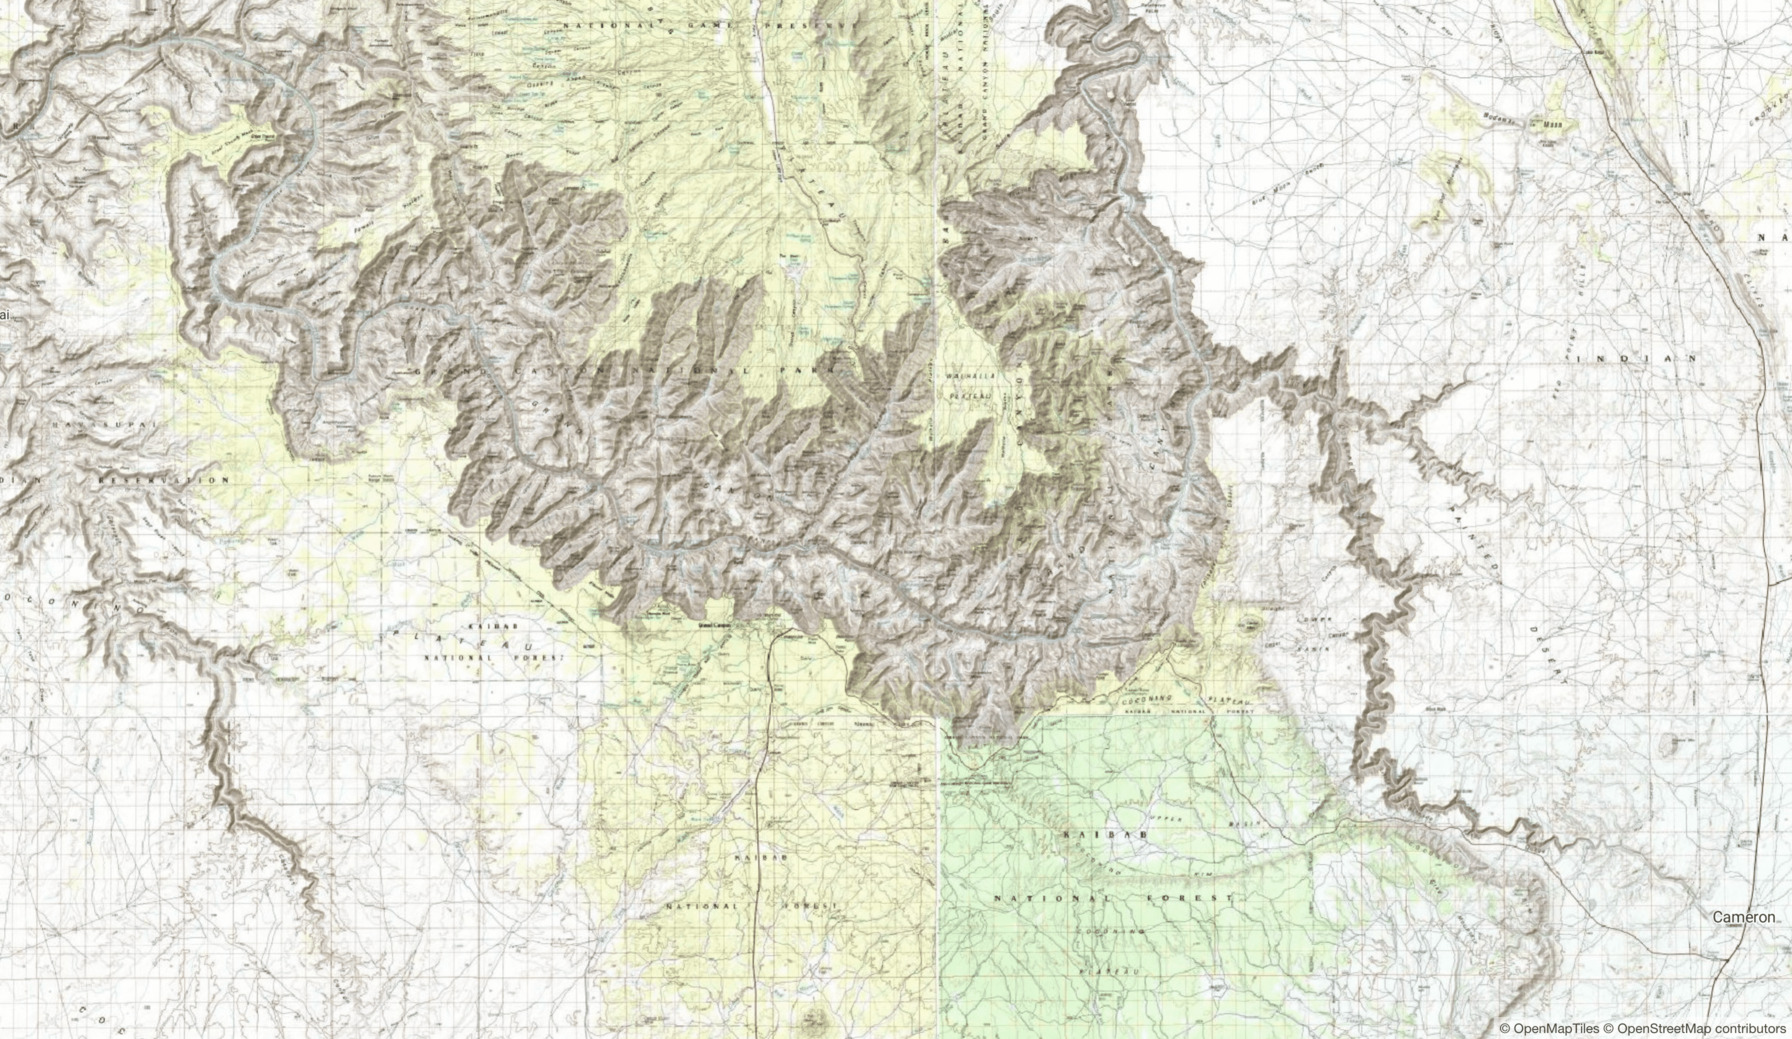
A mosaic of USGS historical maps around the Grand Canyon, with added relief shading.

Overview

I stumbled upon a hidden gem: the entire USGS historical topographic map archive, consisting of 183,112 digitized maps created between 1884 and 2006, is stored in Cloud-Optimized GeoTIFF (COG) format on AWS S3.

The fact that maps are accessible publicly and stored in COG format means that you can easily and cheaply set up a serverless function on AWS Lambda to serve map tiles on the fly.

The COG format is a backwards-compatible, cloud-native storage format for raster files that allow selected portions of the file to be read over the network without needing to download and parse the entire file. This fast random read access allows for dynamic tiling of map tiles on demand, without needing to preprocess and store any map data.

There are three parts to serving your own tiles:

  • usgs-topo-tiler: a library to extract a single Web Mercator tile from one source historical map.
  • usgs-topo-tiler's CLI, which helps to construct MosaicJSON files. These files tell usgs-topo-mosaic what source files should be combined to create a single Web Mercator tile.
  • usgs-topo-mosaic: a library to use a MosaicJSON file created above to create a seamless mosaic of tiles. This is designed to be deployed with AWS Lambda and AWS API Gateway as a serverless tile endpoint.

Generate a Web Mercator tile

Install

pip install usgs-topo-tiler 'rio-tiler>=2.0a6'

Usage

Here I'll show a quick overview of reading a single mercator tile from a single USGS historical map. If you're looking for a specific map, the simplest way is probably to use the National Map Viewer. Check the box for "Historical Topographic Maps", make sure the file format is "GeoTIFF". Click "Find Products", and then right click "Download" to get the HTTPS url to the GeoTIFF on S3.

For this demo, I'll make a mercator tile from an 1897 topographic map of Yosemite Valley.

Read a tile from a file over the internet

from usgs_topo_tiler import tile

url = 'https://prd-tnm.s3.amazonaws.com/StagedProducts/Maps/HistoricalTopo/GeoTIFF/CA/CA_Yosemite_299696_1897_125000_geo.tif'
# Mercator tile
x, y, z = 687, 1583, 12

tile, mask = tile(url, x, y, z, tilesize=512)
print(tile.shape)
# (3, 512, 512)
print(mask.shape)
# (512, 512)

Create image from tile

Note that if you're using rio-tiler v1, you should replace render with array_to_image.

from rio_tiler.utils import render

buffer = render(tile, mask, img_format='png')

Write image to file

with open('yose_1897.png', 'wb') as f:
    f.write(buffer)

You now have a 512x512 png image aligned with the Web Mercator grid, and because the source is a Cloud-optimized GeoTIFF, the image was made with a minimal number of requests to the source, and without reading the entire GeoTIF.

Yosemite, 1897 Web Mercator tile

Create a MosaicJSON

The process described above is for create one tile. But often we want to join many mercator tiles to make a seamless web map. This is where MosaicJSON comes in. It describes how to join sources and where to place them.

This section outlines how to create a MosaicJSON from USGS historical topo assets. This MosaicJSON can then be used with usgs-topo-mosaic to serve a web map of tiles with AWS Lambda.

Install

When you install usgs-topo-tiler, it doesn't include dependencies necessary for the CLI commands so as to keep the deployment size small when used with usgs-topo-mosaic.

To install the additional CLI dependencies, run:

pip install 'usgs-topo-tiler[cli]'

Download bulk metadata

First you need to download metadata including at least the geospatial bounds of each map, and the URL of each map. It's possible to use the National Map API to retrieve such metadata, however I prefer to download a CSV of bulk metadata from S3. This file includes metadata on every image in their collection.

mkdir -p data
wget https://prd-tnm.s3-us-west-2.amazonaws.com/StagedProducts/Maps/Metadata/topomaps_all.zip -P data/
unzip topomaps_all.zip

data/topomaps_all.csv is the extracted bulk metadata file. data/readme.txt has helpful information about what fields are in the bulk metadata file.

Download list of COG files:

Occasionally there are some files listed in the metadata that don't exist as GeoTIFF. I download a list of the .tif files on S3 so that I can cross-reference against the metadata and ensure that only files that exist are included in the MosaicJSON.

This step is optional, but recommended.

mkdir -p data/
usgs-topo-tiler list-s3 \
    --bucket 'prd-tnm' \
    --prefix 'StagedProducts/Maps/HistoricalTopo/GeoTIFF/' \
    --ext '.tif' \
    > data/geotiff_files.txt

> wc -l data/geotiff_files.txt
    183112 data/geotiff_files.txt

183112 COG files!

Create MosaicJSON

Now you're ready to start creating mosaics. This isn't entirely straightforward because maps were created at different times and at different scales in different regions of the U.S. So it's not usually as simple as creating a mosaic of all maps of a single scale, unless you're ok with having gaps in the mosaic spatially, where tiles might return empty data.

Footprints

One of the best way to visually see the results of a filtering query on the metadata is to generate footprints and then display them on a map.

Lets say we want to create a mosaic of mid-scale maps. We can use the --filter-only cli flag to export newline-delimited GeoJSON of the query.

usgs-topo-tiler mosaic-bulk \
    --meta-path data/topomaps_all.csv \
    --s3-list-path data/geotiff_files.txt \
    --min-scale 63360 \
    --max-scale 249000 \
    --filter-only \
    > mid_scale_footprints.geojsonl

Then we can visualize this data, e.g. with my CLI for kepler.gl.

kepler mid_scale_footprints.geojsonl

This illustrates the core problem of these historical maps when making a MosaicJSON. Some areas have been mapped more than others, and some have never been mapped at this scale range. If you were to create a MosaicJSON from these parameters, you'd get empty images when requesting data over Northern Montana and Western Texas.

Generate MosaicJSON

Once you know the desired parameters of your query, remove the --filter-only flag to generate the MosaicJSON. For example:

usgs-topo-tiler mosaic-bulk \
    --meta-path data/topomaps_all.csv \
    --s3-list-path data/geotiff_files.txt \
    --min-scale 63360 \
    --max-scale 249000 \
    > mid_scale_mosaic.json

mid_scale_mosaic.json is now a MosaicJSON file that can be used with usgs-topo-mosaic to render a web map. Note, however that this uses a custom asset string format, as described in Removing Map Collars, and won't necessarily work with all other MosaicJSON tools.

Examples

Low zoom, newest available

usgs-topo-tiler mosaic-bulk \
    --meta-path data/topomaps_all.csv \
    --s3-list-path data/geotiff_files.txt \
    --min-scale 250000 \
    > mosaic_low.json

Medium zoom, newest available, filling in with lower-resolution maps where necessary

usgs-topo-tiler mosaic-bulk \
    --meta-path data/topomaps_all.csv \
    --s3-list-path data/geotiff_files.txt \
    --min-scale 63360 \
    > mosaic_medium.json

Medium zoom, oldest available, filling in with lower-resolution maps where necessary

usgs-topo-tiler mosaic-bulk \
    --meta-path data/topomaps_all.csv \
    --s3-list-path data/geotiff_files.txt \
    --min-scale 63360 \
    --sort-preference oldest \
    > mosaic_medium_oldest.json

High zoom, newest available, continental U.S. only

usgs-topo-tiler mosaic-bulk \
    --meta-path data/topomaps_all.csv \
    --s3-list-path data/geotiff_files.txt \
    --min-scale 24000 \
    --max-scale 63359 \
    `# Lower 48 states only` \
    --bounds '-161.96,12.85,-55.01,50.53' \
    > mosaic_high.json

API

Usage: usgs-topo-tiler mosaic-bulk [OPTIONS]

  Create MosaicJSON from CSV of bulk metadata

Options:
  --meta-path PATH                Path to csv file of USGS bulk metadata dump
                                  from S3  [required]

  --s3-list-path PATH             Path to txt file of list of s3 GeoTIFF files
  --min-scale FLOAT               Minimum map scale, inclusive
  --max-scale FLOAT               Maximum map scale, inclusive
  --min-year FLOAT                Minimum map year, inclusive
  --max-year FLOAT                Maximum map year, inclusive
  --woodland-tint / --no-woodland-tint
                                  Filter on woodland tint or no woodland tint.
                                  By default no filtering is applied.

  --allow-orthophoto              Allow orthophoto  [default: False]
  --bounds TEXT                   Bounding box for mosaic. Must be of format
                                  "minx,miny,maxx,maxy"

  -z, --minzoom INTEGER           Force mosaic minzoom
  -Z, --maxzoom INTEGER           Force mosaic maxzoom
  --quadkey-zoom INTEGER          Force mosaic quadkey zoom
  --sort-preference [newest|oldest|closest-to-year]
                                  Method for choosing assets within a given
                                  mercator tile at the quadkey zoom.
                                  [default: newest]

  --closest-to-year INTEGER       Year used for comparisons when preference is
                                  closest-to-year.

  --filter-only                   Output filtered GeoJSON features, without
                                  creating the MosaicJSON. Useful for
                                  inspecting the footprints   [default: False]

  --help                          Show this message and exit.

Addendum

Removing map collars

All of the USGS historical maps have collars, regions of space around the map where metadata is printed. In order to create continuous map tiles from a collection of these maps, these collars have to be clipped, so that only the map is showing.

Ruby, AK

These maps are georeferenced, which means that it's straightforward to remove the collar when you know the actual bounds contained in the map. However, I've found that there's no reliable way to determine the bounds on the fly with just the image and its filename.

While building the mosaic ahead of time, you have access to this information, but with the usual tiling setup, you'd only have access to the URL and image while tiling.

To get around this, I apply a "hack" to the MosaicJSON format. Instead of just encoding a URL string, I encode the url and the bounds of the map as a JSON string.

Summary: when you build a mosaic using the cli in this library, it encodes a non-standard MosaicJSON that works well with the usgs-mosaic-tiler tiler, but isn't necessarily readable by other MosaicJSON tools

usgs-topo-tiler's People

Contributors

kylebarron avatar

Stargazers

 avatar  avatar  avatar  avatar  avatar  avatar  avatar  avatar  avatar  avatar  avatar  avatar  avatar  avatar  avatar  avatar  avatar  avatar  avatar  avatar  avatar  avatar  avatar  avatar  avatar  avatar  avatar  avatar  avatar  avatar  avatar  avatar  avatar  avatar  avatar  avatar  avatar  avatar  avatar  avatar  avatar  avatar  avatar  avatar  avatar  avatar  avatar  avatar  avatar  avatar  avatar  avatar  avatar  avatar  avatar  avatar  avatar  avatar  avatar  avatar  avatar  avatar  avatar  avatar  avatar  avatar  avatar  avatar  avatar  avatar  avatar  avatar  avatar  avatar  avatar  avatar

Watchers

 avatar  avatar  avatar  avatar  avatar  avatar

usgs-topo-tiler's Issues

Clip artifacts at low zoom

You could try math.ceil and math.floor instead of round here:

left = round(buffers[0] / crs_width * img_width)
bottom = img_height - round(buffers[1] / crs_height * img_height)
right = img_width - round(buffers[2] / crs_width * img_width)
top = round(buffers[3] / crs_height * img_height)

That would slightly overcompensate, but then the gaps would be white, instead of whatever the background color is.
image

Debug missing quads?

It's rare, but occasionally there are missing quadrangles:
image

These are in northern Rocky Mountain National Park. The bottom right corner of the right one is in the center of Estes Park

Ideas

  • Fake mask
  • How to get actual bounds from image?

Improve generating mosaic for non-standard quads

I currently deduplicate using exact geometries, because for the vast majority of the time, all topo maps are on the same grid. However there are some old maps of the LA region that are on a non-standard grid:

image
image

For quadkey: '02301231131' there were 100 source assets, and 19 kept after deduplication.

Handle varying imprint dates

From here

There are multiple copies of the same map in your Historical Topographic Map Collection that all have the same date. Is there a difference between those maps?

Yes, these are different maps that typically resulted from revisions and reprints. The differences are often minor.

The date used to identify a map can be found in the lower right corner. If there are multiple editions with the same compilation date, look for additional dates in the lower right portion of the map collar that might differentiate them:

  • Date on Map -- The year of base compilation, or the year of a significant revision
  • Imprint Year -- The year the map was printed
  • Photo Inspection Year -- The year when a photo inspection was last done on the map
  • Photo Revision Year -- The year when photos were used to revise a map
  • Field Check Year -- The year map content was verified in the field
  • Survey Year -- The year when a field survey was completed for the mapped area
  • Edit Year -- The year the map was last globally edited or revised

From here

Imprint Year: Printed text in the lower map ‘Collar’ (in small font) giving the YYYY date a map was physically printed. By definition, the ‘Imprint Year’ should not be earlier than any other modification dates for the map (that is, a map cannot be printed before it is edited or revised). ‘Imprint Years’ can change even if map content was not revised since its last printing. This is a very important data element for differentiating many similar maps from each other

From same document

Date on Map: [required field] The YYYY date in the lower map ‘Collar’ giving the year the map was created. It is important to note that the HTMC metadata field of the same name will always contain data. However, a fair number of older maps will not have a traditional ‘Date on Map’ and instead will have a different value (see details below for substitution rules)

Are all Topo quads in COG?

Find the earliest quad (by dateCreated, not date of the map). Then make sure it's a valid COG?

It looks like all historical topo maps are in GeoTIFF, which means they're probably all in COG (reference)

Add filters for topographic, woodland tint. Some maps made at the same time with...

# TODO: Add filters for topographic, woodland tint. Some maps made at the same time with neighboring ids are quite different, e.g.
# CA_Acton_302201_1959_24000_geo.tif
# CA_Acton_302202_1959_24000_geo.tif
# TODO: option for high scale, medium scale, low scale
# High scale: 24k, Medium scale: 63k, low scale: 250k


This issue was generated by todo based on a TODO comment in 7d6771e. It's been assigned to @kylebarron because they committed the code.

Support arbitrary scales/grids, not just quads

Crosstab of grid size vs scale:

pd.crosstab(gdf['Scale'], gdf['Grid Size'], margins=True).to_markdown()
Scale 1 X 1 Degree 1 X 2 Degree 1 X 3 Degree 1 X 4 Degree 15 X 15 Minute 2 X 1 Degree 3.75 X 3.75 Minute 30 X 30 Minute 30 X 60 Minute 7.5 X 15 Minute 7.5 X 7.5 Minute None All
10000 0 0 0 0 0 0 76 0 0 0 1 0 77
12000 0 0 0 0 0 0 1 0 0 0 0 0 1
20000 0 0 0 0 3 0 0 0 0 0 295 0 298
21120 0 0 0 0 0 0 0 0 0 0 19 0 19
24000 0 0 0 0 4 0 0 0 0 0 131183 0 131187
25000 0 0 0 0 0 0 0 0 0 389 1157 2 1548
30000 0 0 0 0 0 0 0 0 0 0 276 0 276
31680 0 0 0 0 5 0 0 0 0 0 4273 0 4278
48000 0 0 0 0 1034 0 0 0 0 7 90 0 1131
50000 0 0 0 0 94 0 0 0 0 0 0 0 94
62500 0 0 0 0 27997 0 0 0 0 0 2 0 27999
63360 0 0 0 0 7082 0 0 0 0 0 0 0 7082
96000 0 0 0 0 1 0 0 42 0 0 0 0 43
100000 0 0 0 0 0 0 0 8 2963 0 0 0 2971
125000 0 0 0 0 0 0 0 4657 1 0 0 0 4658
192000 0 0 0 0 0 0 0 2 0 0 0 0 2
250000 495 3021 945 20 0 34 0 10 0 0 0 0 4525
All 495 3021 945 20 36220 34 77 4719 2964 396 137296 2 186189

Option to sort by year, then scale

Currently I first sort by scale then by year. This means that "oldest" isn't specifically "oldest", it's "oldest for the highest scale available". You should enable alternative sorts, such as by year then scale?

Find min/max zoom based on metadata

rio-tiler has a nice helper function get_zooms:

def get_zooms(src_dst, ensure_global_max_zoom=False, tilesize=256):
    """
    Calculate raster min/max mercator zoom level.
    Parameters
    ----------
    src_dst: rasterio.io.DatasetReader
        Rasterio io.DatasetReader object
    ensure_global_max_zoom: bool, optional
        Apply latitude correction factor to ensure max_zoom equality for global
        datasets covering different latitudes (default: False).
    tilesize: int, optional
        Mercator tile size (default: 256).
    Returns
    -------
    min_zoom, max_zoom: Tuple
        Min/Max Mercator zoom levels.
    """
    bounds = transform_bounds(src_dst.crs, "epsg:4326", *src_dst.bounds, densify_pts=21)
    center = [(bounds[0] + bounds[2]) / 2, (bounds[1] + bounds[3]) / 2]
    lat = center[1] if ensure_global_max_zoom else 0

    dst_affine, w, h = calculate_default_transform(
        src_dst.crs, "epsg:3857", src_dst.width, src_dst.height, *src_dst.bounds
    )

    mercator_resolution = max(abs(dst_affine[0]), abs(dst_affine[4]))

    # Correction factor for web-mercator projection latitude scale change
    latitude_correction_factor = math.cos(math.radians(lat))
    adjusted_resolution = mercator_resolution * latitude_correction_factor

    max_zoom = zoom_for_pixelsize(adjusted_resolution, tilesize=tilesize)

    ovr_resolution = adjusted_resolution * max(h, w) / tilesize
    min_zoom = zoom_for_pixelsize(ovr_resolution, tilesize=tilesize)

    return (min_zoom, max_zoom)

Essentially the only things you need are the map's CRS and bounds. Bounds are clear in the bulk csv metadata. There's also a projection column with the following unique values:

Polyconic                        115709
Lambert Conformal Conic           26067
Transverse Mercator               17647
Universal Transverse Mercator     17118
Unstated                           9648

So you should see if you can easily get a CRS from those

`rio_tiler.reader` has no attribute `tile`

hi kyle! first off, great work and thank you for sharing your code!

running the example in the README.md I am seeing this error:

Traceback (most recent call last):
  File "main.py", line 7, in <module>
    tile, mask = tile(url, x, y, z, tilesize=512)
  File "/home/flynn/.local/lib/python3.8/site-packages/usgs_topo_tiler/usgs_topo.py", line 72, in tile
    return reader.tile(
AttributeError: module 'rio_tiler.reader' has no attribute 'tile'

Looks like maybe rio_tiler API was changed/updated?

Recommend Projects

  • React photo React

    A declarative, efficient, and flexible JavaScript library for building user interfaces.

  • Vue.js photo Vue.js

    🖖 Vue.js is a progressive, incrementally-adoptable JavaScript framework for building UI on the web.

  • Typescript photo Typescript

    TypeScript is a superset of JavaScript that compiles to clean JavaScript output.

  • TensorFlow photo TensorFlow

    An Open Source Machine Learning Framework for Everyone

  • Django photo Django

    The Web framework for perfectionists with deadlines.

  • D3 photo D3

    Bring data to life with SVG, Canvas and HTML. 📊📈🎉

Recommend Topics

  • javascript

    JavaScript (JS) is a lightweight interpreted programming language with first-class functions.

  • web

    Some thing interesting about web. New door for the world.

  • server

    A server is a program made to process requests and deliver data to clients.

  • Machine learning

    Machine learning is a way of modeling and interpreting data that allows a piece of software to respond intelligently.

  • Game

    Some thing interesting about game, make everyone happy.

Recommend Org

  • Facebook photo Facebook

    We are working to build community through open source technology. NB: members must have two-factor auth.

  • Microsoft photo Microsoft

    Open source projects and samples from Microsoft.

  • Google photo Google

    Google ❤️ Open Source for everyone.

  • D3 photo D3

    Data-Driven Documents codes.