Giter Site home page Giter Site logo

covid-19-data-visualization's Introduction

COVID-19 Data Visualization

Coronavirus disease 2019 (COVID-19) listing confirmed cases, reported deaths and reported recoveries. Coronavirus disease (COVID-19) is caused by the Severe acute respiratory syndrome Coronavirus 2 (SARS-CoV-2) and has had a worldwide effect. On March 11 2020, the World Health Organization (WHO) declared it a pandemic, pointing to Coronavirus illness in over 110 countries and territories around the world at the time.

App Screenshot

Summary Process

1. Objective
2. Data Extraction
3. Data Preparation
4. Installation
5. Data Visualization
6. Conclusion

Objective:

Visualization of people affected by COVID-19 worldwide

  • Confirmed tested cases of Coronavirus infection
  • TreeMap Representation of Data
  • Pie Chart Representation of stats of worst affected countries
  • Representation of Population to Tests Done Ratio
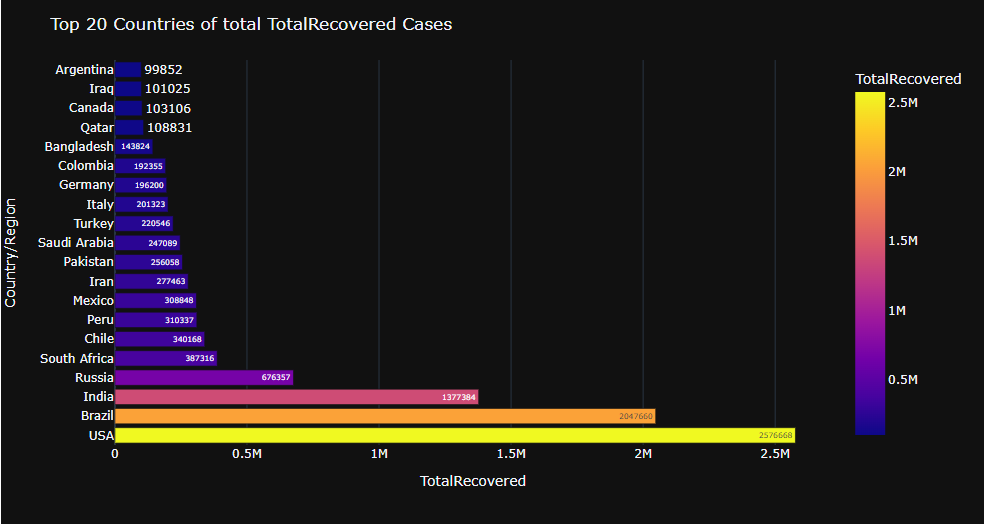
  • The number of people who have reportedly recovered from it
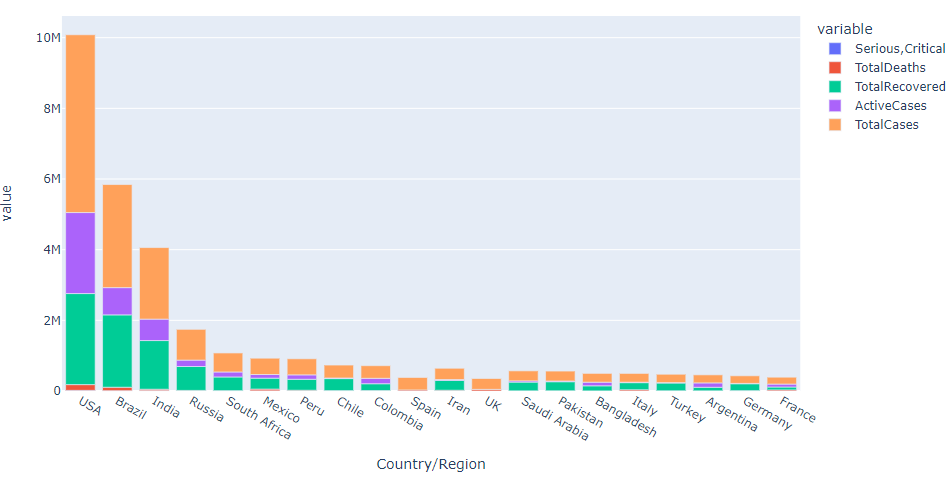
  • Top 20 countries that are Severely affected/TotalConfirmed/TotalDeaths/TotalActive/TotalRecoveries by corona

Installation

To install the libraries used in this project. Follow the below steps

 pip install pandas
 pip install numpy
 pip install matplotlib
 pip install plotly

Data Visualization

For full report of this project: COVID-19

TreeMap of Total Covid Cases Logo

Most-Effected country by CORONA Logo

Top 20 Recovered Cases Logo

covid-19-data-visualization's People

Contributors

l-vinaykumar avatar

Watchers

Kostas Georgiou avatar  avatar

Recommend Projects

  • React photo React

    A declarative, efficient, and flexible JavaScript library for building user interfaces.

  • Vue.js photo Vue.js

    ๐Ÿ–– Vue.js is a progressive, incrementally-adoptable JavaScript framework for building UI on the web.

  • Typescript photo Typescript

    TypeScript is a superset of JavaScript that compiles to clean JavaScript output.

  • TensorFlow photo TensorFlow

    An Open Source Machine Learning Framework for Everyone

  • Django photo Django

    The Web framework for perfectionists with deadlines.

  • D3 photo D3

    Bring data to life with SVG, Canvas and HTML. ๐Ÿ“Š๐Ÿ“ˆ๐ŸŽ‰

Recommend Topics

  • javascript

    JavaScript (JS) is a lightweight interpreted programming language with first-class functions.

  • web

    Some thing interesting about web. New door for the world.

  • server

    A server is a program made to process requests and deliver data to clients.

  • Machine learning

    Machine learning is a way of modeling and interpreting data that allows a piece of software to respond intelligently.

  • Game

    Some thing interesting about game, make everyone happy.

Recommend Org

  • Facebook photo Facebook

    We are working to build community through open source technology. NB: members must have two-factor auth.

  • Microsoft photo Microsoft

    Open source projects and samples from Microsoft.

  • Google photo Google

    Google โค๏ธ Open Source for everyone.

  • D3 photo D3

    Data-Driven Documents codes.