Comparsion Between k_means and DBSCAN Clustering based on their accuracy
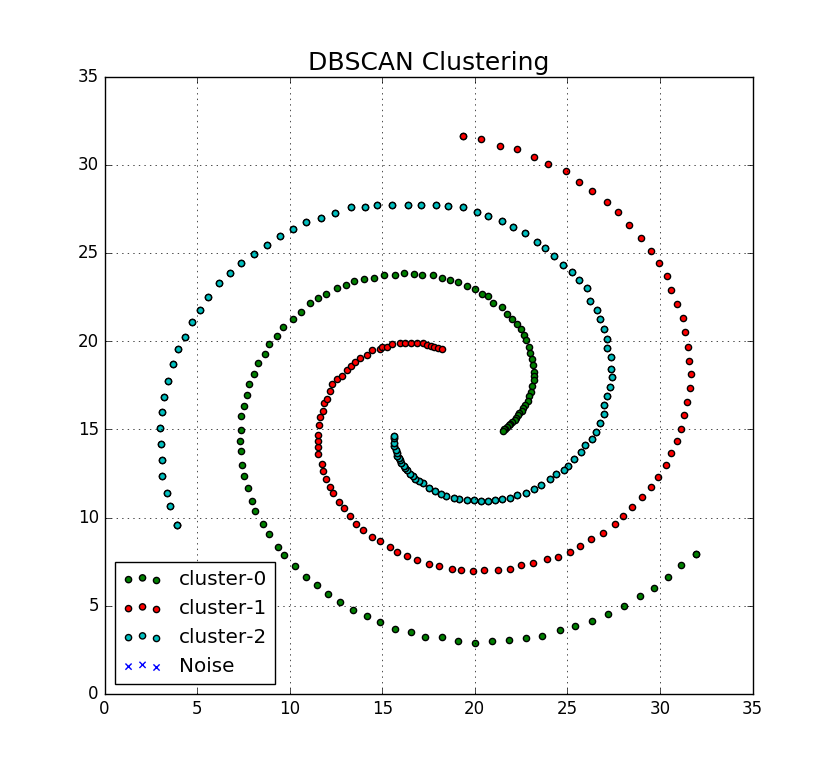
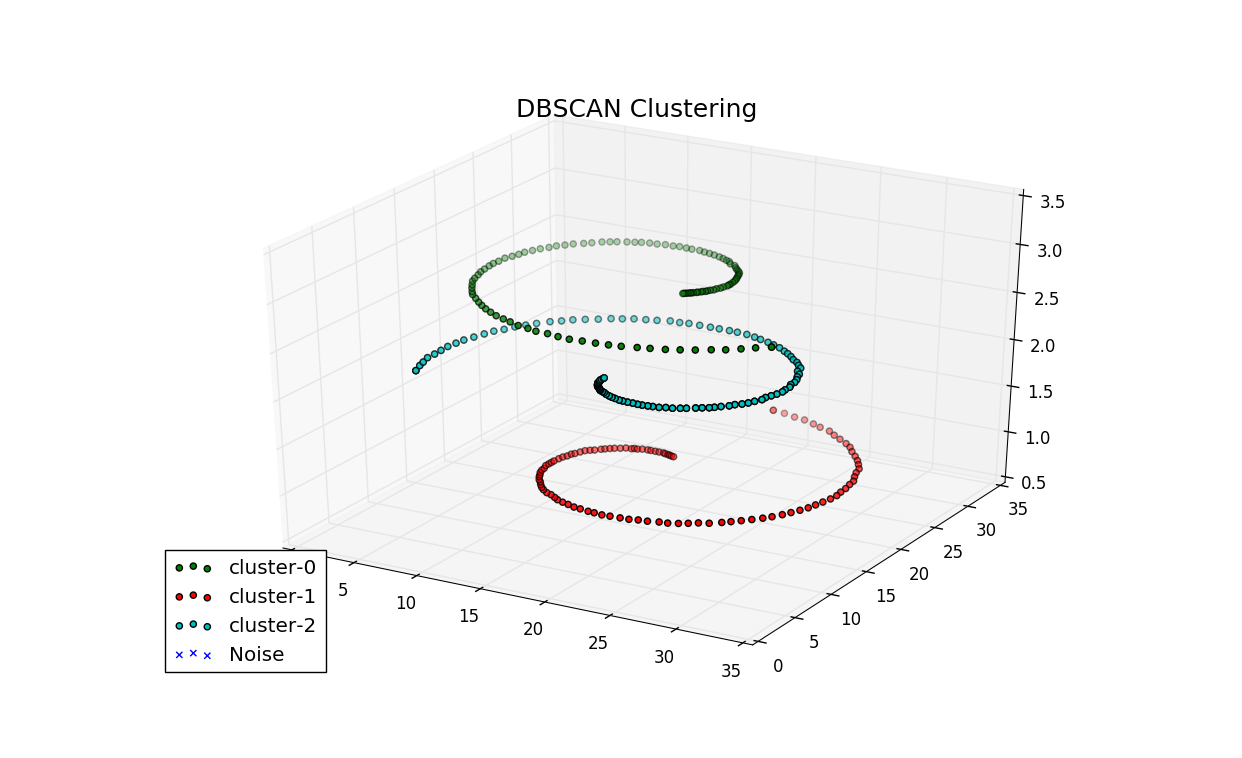
Implementation of DBSCAN Algorithm in Python.
It takes two inputs. First one is the .csv file which contains the data (no headers). In 'main.py' change line 12 to:
DATA = '/path/to/csv/file.csv'
And the second is the config file which contains few parameters necessary for the algorithm. More details inside 'config' file. You can change the 'config' file as per your requirement.
UPDATE: July 13, 2017 - The code has been updated to support 3D points. Although technically, it can be used to perform multi-demensional clustering (might need to tweak the code more) - it is the visualization part will not work as expected.
python implementation of k-means clustering. k-means is an unsupervised learning technique that attempts to group together similar data points in to a user specified number of groups. The below example shows the progression of clusters for the Iris data set using the k-means++ centroid initialization algorithm.

k-means attempts to identify a user specified k(<N) number of clusters from a set of N d-dimensional real valued vectors. The algorithm proceeds by attempting to minimize the sum of squared distances from a cluster center, to the cluster members. The canonical algorithm proceeds in three phases:
- Initialise k random centroids (cluster centers);
- assign data points to nearest cluster according to distance metric (typically Euclidean distance);
- update the centroids to the mean of the members of the cluster;
- repeat steps 2 & 3 until the assignments from step 2 do not change.
The output of the algorithm is a cluster assignment for each data point, and a final level of "distortion". The algorithm does not produce a provably optimal solution, and initial cluster centers may cause the algorithm to get stuck in a locally optimum solution that is clearly sub-optimal (see the basic 2d example in the Results section).
Much research has focused on:
- selecting initial cluster centers. K-Means++ is a well known method, and is included in this implementation, the algorithm is outlined in the following sub-section.
- computing distances, i.e. using measures other than Euclidean see here.
Rather than initialize random centroids as in step 1 above, k-means++ probabilistically spreads out the initial centroids to avoid poor initial configuration, the algorithm is:
- Choose first centroid randomly.
- For each data point x, compute the distance d(x), from x to the nearest centroid that has already been chosen.
- Select a data point to be the next centroid using a weighted probability proportional to d(x)2.
This technique gives favor to data points which are not near another initial centroids, and uses a selection policy that is reminiscent of roulette wheel (or fitness proportionate) selection that is often used in genetic algorithms.
-
K-Means is described in Top 10 Algorithms for Data Mining;
-
K-Means is outlined in Information Theory, Inference, and Learning Algorithms, excerpt here;
-
Professor Andrew Moore of CMU has some good notes here;
-
Edureka example, using crime data
SciPy has a k-means implementation. The objective of this work is to build a pure python implementation for the purposes of learning, and helping others learn the k-means algorithm. Interested readers with only minimal python experience will be able to read, and step over this code without the added complexity of a library such as SciPy. It is not by any means intended for production use :)
- python 3.6.3
- matplotlib 2.1.1 - see here for installation instructions.
Run the code with the python interpreter:
python kmeans.py ./resources/<config.cfg>
Where config.cfg is a plain text configuration file. The format of the config file is a python dict with the following fields:
{
   'data_file' : '\\resources\\iris.csv',
   'data_project_columns' : ['sepal_length','sepal_width','petal_length','petal_width','class'],
   'k' : 3,
   'cluster_atts' : ['sepal_length','sepal_width','petal_length','petal_width'],
   'init_cluster_func' : 'kmeans_plus_plus',
   'plot_config' :
    {'output_file_prefix' : 'iris',
     'plots_configs': [
        {'plot_atts' : ['sepal_length','sepal_width']},
        {'plot_atts' : ['sepal_length','petal_length']},
        {'plot_atts' : ['sepal_length','petal_width']},
        {'plot_atts' : ['sepal_width','petal_length']},
        {'plot_atts' : ['sepal_width','petal_width']},
        {'plot_atts' : ['sepal_width','petal_width']}
     ]
   }
}
You have to specify:
- a csv data file;
- a subset of fields to project from the file;
- the number of clusters to form, k;
- the subset of attributes used in the clustering process;
- optionally specify an initial cluster func (default='rand_init_centroids'), interested authors made add their own to the code and specify it here;
- a plot config that includes
- prefix for png files created during the process in the working directory, if this isn't specified, images will not be produced;
- the individual plot configurations, limited to 2 dimensions per plot.
The Iris data set (iris.config), from Lichman, M. (2013). UCI Machine Learning Repository . Irvine, CA: University of California, School of Information and Computer Science., is a very well known data set in the machine learning community. Here are the results of my random initial clusters:


This data was generated for debugging purposes (see basic2d.config), and illustrates the effect of having a poor choice of initial random clusters. The below results demonstrate an initial centroid configuration that prevents the algorithm from reaching the obvious cluster assignment. In this case the placement of the red centroid means the blue centroid captures all of the data points in the lower left, and lower right quadrants.


