A ride-sharing company is interested in predicting rider retention.
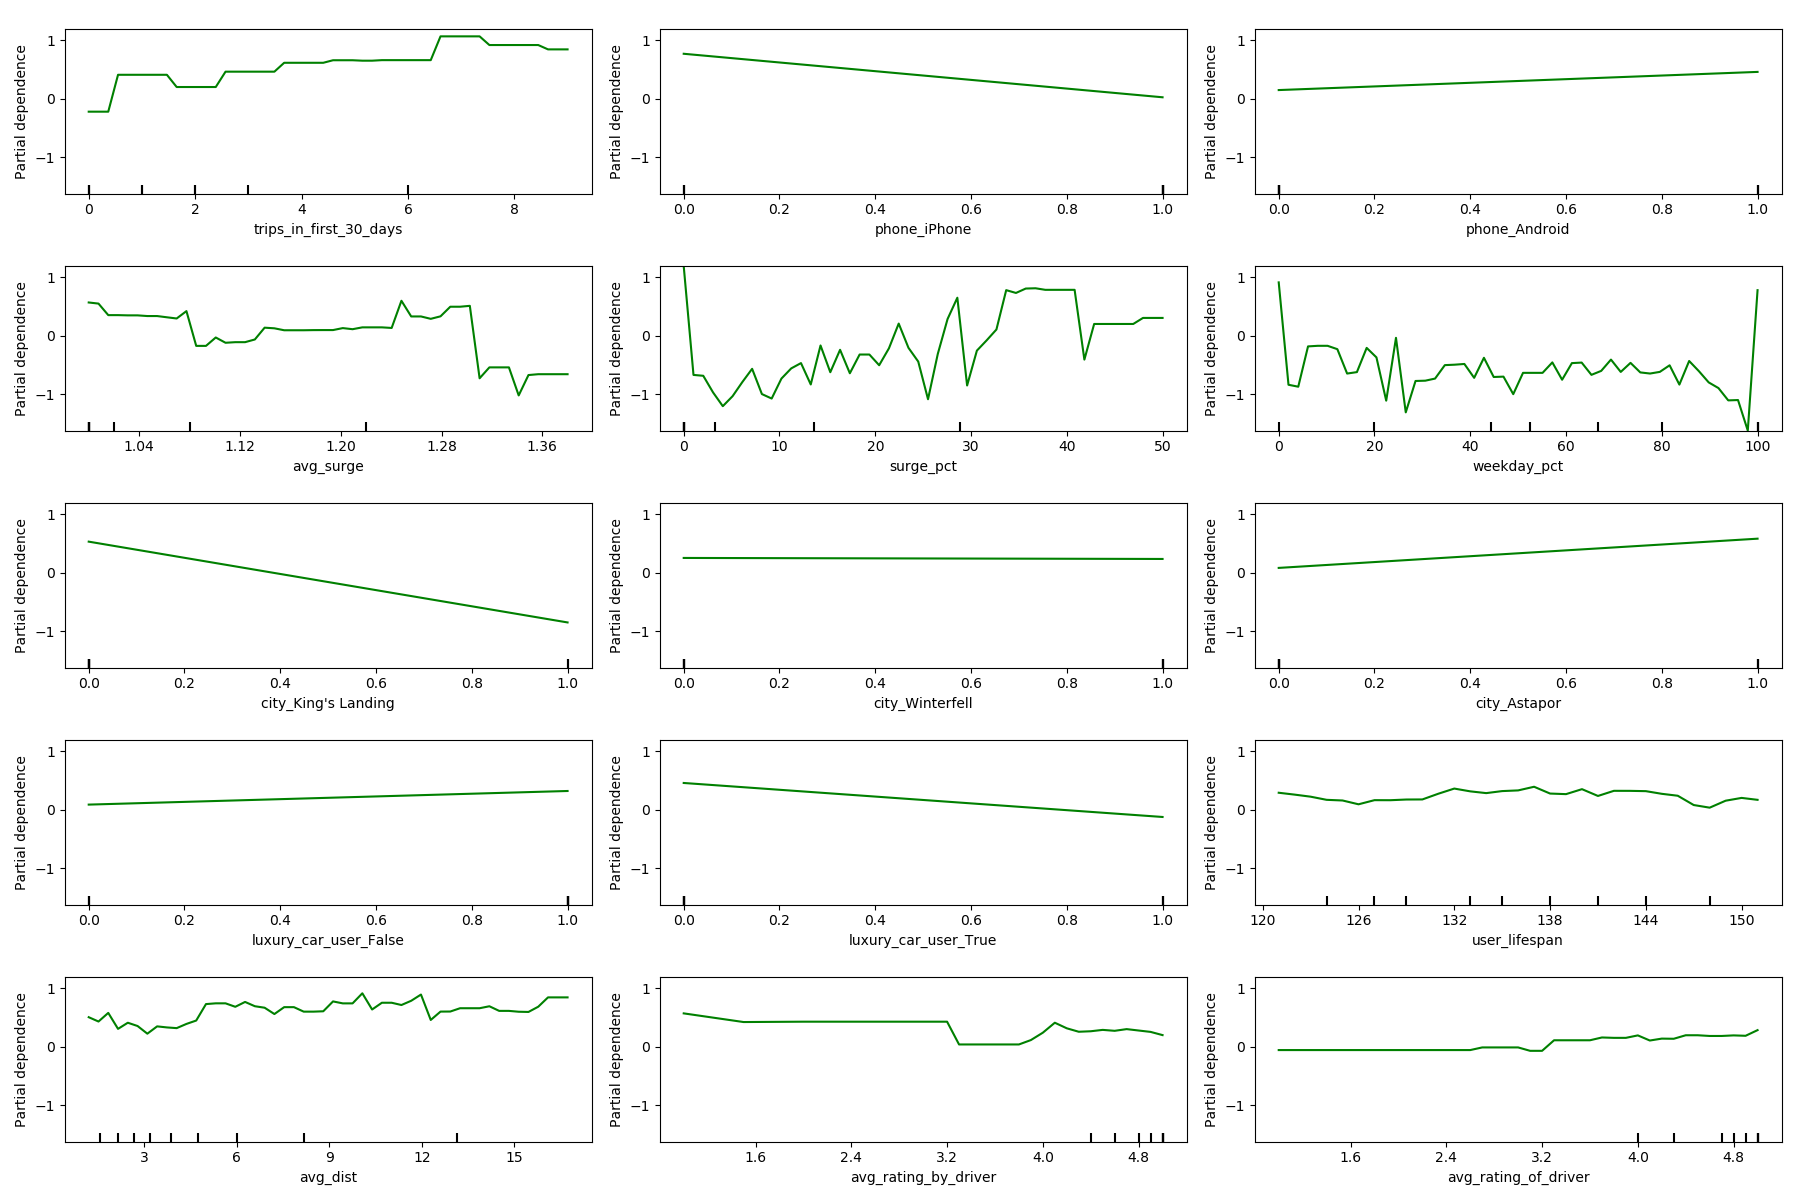
- High-income users are less likely to churn: Using iphone, living in King's Landing (and to a lesser extent in Winterfell), and riding luxury cars are consistently negatively associated with the churn probability.
- Users who ride on both weekdays and weekend days are less likely to churn, as compared to users who ride only during weekdays or only during the weekend.
- Users who experiement low shares of rides with surge are less likely to churn. However, this trend is more evident in which suggests that surge seems to have a short-term effect on user's behavior.
- Ratings and average distance of rides do not seem to be associated with churn.
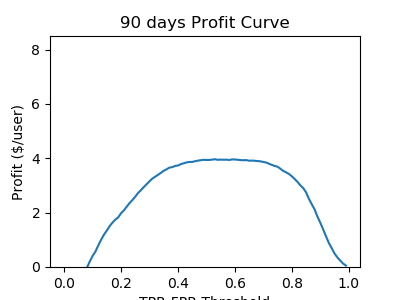
The best strategy to be adopted will depend on the stage and priorities of the company.
- If the churn definition is aggressive (i.e. a user is considered to have churned if he/she has not used the service in 30 days), the company can make a profit of up to $8 per user by sending out $20 per year in promotions to users predicted to churn.
- If the churn definition is standard (i.e. 90 days), the company can make a profit of up to $4 per user by sending out $20 per year in promotions to users predicted to churn.
Assumptions:
- User value: $40 user/year
- Campaign cost: $20 user/year
- 100% success rate of campaign (profit is non-negative at >= 50% success rate)
- These figures are consistent with an annual revenue of $ 1 Billion and 5 million users (Lyft 2017).
city: city this user signed up in phone: primary device for this user signup_date: date of account registration, in the formYYYYMMDDlast_trip_date: the last time this user completed a trip, in the formYYYYMMDDavg_dist: the average distance (in miles) per trip taken in the first 30 days after signupavg_rating_by_driver: the rider’s average rating over all of their tripsavg_rating_of_driver: the rider’s average rating of their drivers over all of their tripssurge_pct: the percent of trips taken with surge multiplier > 1avg_surge: The average surge multiplier over all of this user’s tripstrips_in_first_30_days: the number of trips this user took in the first 30 days after signing upluxury_car_user: TRUE if the user took a luxury car in their first 30 days; FALSE otherwiseweekday_pct: the percent of the user’s trips occurring during a weekday
- Churn: The models try two definitions for churn:
- Standard: A user is considered to have churned if he/she has not taken a ride in the last 90 days. This definition is broadly in line with the industry standard.
- Aggressive: A user is considered to have churned if he/she has not taken a ride in the last 30 days. This definition is suitable for a company in an expansive stage, when it is willing to pay a relatively high retention cost to keep a user.
- Exogenous features
- Categorical features with missing values were filled in with the mode for their specific group (by
cityandluxury_car_user). Missing value sin continuous features were filled in with the median value for such groups. - Categorical features, such as
city,phone, andluxury_car_userwere converted to dummy variables. - Continuous features that exhibited a log-normal distribution were logarized.
user_lifespananduser_rated_driverwere created.
- Categorical features with missing values were filled in with the mode for their specific group (by
The four models run were:
- Logistic Regression
- Random Forest
- Gradient Boosting
- Adaboost
- Gradient Boosting + Logistic Regression ensemble
- Random Forest + Logistic Regression ensemble
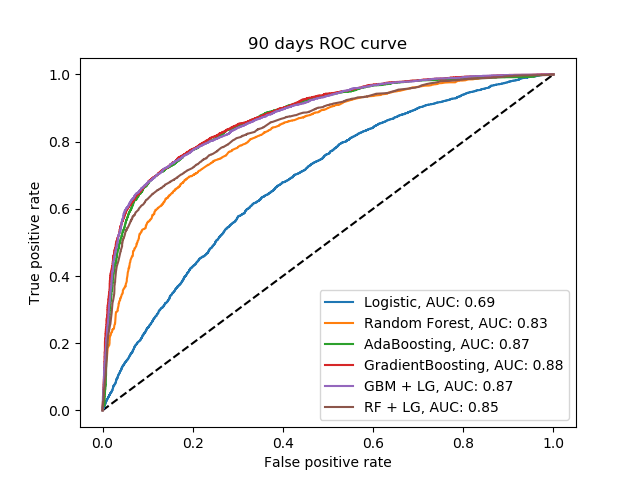
For each model, a Cross-Validation with Grid Search to optimize hyperparameters was conducted. The metric used to compare performance was the Area Under the Curve for the Reiceiver-Operator Curve (AUC/ROC), which portrays the tradeoff between true positive rate (TPR) and false positive rate (FPR) for Classification Models.
- ROC curves