Giter Site home page Giter Site logo

macropower / macropower-analytics-panel Goto Github PK

View Code? Open in Web Editor NEW
25.0 3.0 5.0 2.43 MB

It's like Google Analytics, but for Grafana dashboards!

Home Page: https://grafana.com/grafana/plugins/macropower-analytics-panel

License: GNU General Public License v2.0

JavaScript 1.25% TypeScript 36.25% Go 61.35% Dockerfile 0.81% Makefile 0.35%
grafana grafana-plugin prometheus-metrics prometheus-exporter prometheus logstash fluentd logging hacktoberfest hacktoberfest2021

macropower-analytics-panel's Introduction

macropower-analytics-panel

Build Release GitHub release (latest SemVer) Marketplace Downloads

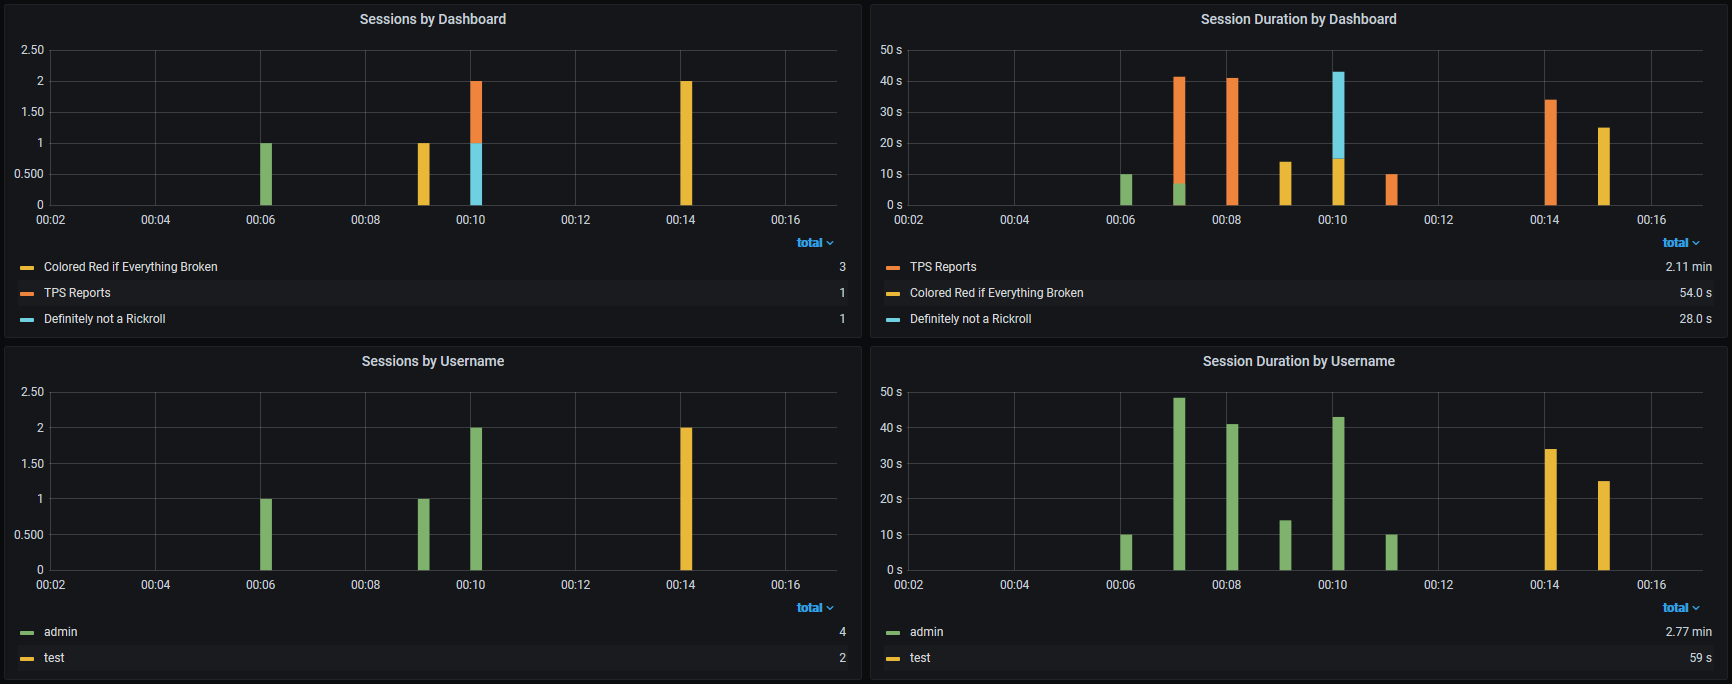
Grafana panel that lets you measure dashboard utilization. It's like Google Analytics, but for Grafana dashboards!

Example Analytics

Features

Have you ever found yourself wanting to know who is using your dashboards, or how much they are being used?

Have you ever asked yourself questions like, "Who should I be catering to" or "What data should I be focusing on"?

Analytics panel extends your dashboards by giving you full control of your user's session data, letting you gather details such as:

  • Timestamps
  • Session duration
  • Tab focused state
  • Selected variables
  • Username
  • User roles
  • Dashboard Name/ID
  • Instance info

Getting Started

You'll need to complete a few tasks to get up and running.

  1. Install the plugin
  2. Select, configure, and run a server
  3. Configure the panel
  4. Hide the panel (optional)

Running a Server

This plugin works by harvesting information about a user's session and the current environment, and forwarding that data as JSON to an endpoint of your choice.

To use this plugin, you must run a server to receive and store/emit data. There are a few different options to choose from, and they may each require different panel settings. Please refer to each of the linked servers' repos for more information.

This plugin's example directory has a few docker-compose files that should help you get started, however we do not have them for every server (contributions welcome).

Default

Included in this plugin's repo is a simple Go server that requires no external dependencies. It can expose data to systems supporting the OpenMetrics standard (e.g. Prometheus, InfluxDB 2.0) and/or your logging system of choice via stdout (e.g. Loki).

Get started or test this option with docker-compose -f example/server/docker-compose.yaml up

analytics-panel-listener

@jtommi maintains analytics-panel-listener, a service that listens for this plugin's payloads and stores them in MongoDB.

Telegraf

You can use Telegraf's http_listener_v2 input to accept data from this plugin. An example configuration for this input can be found in the example directory. This example requires you to enable "flatten" in the plugin's settings. You can tweak this configuration to send data to any of Telegraf's many outputs.

Get started or test this option with docker-compose -f example/telegraf/docker-compose.yaml up

Logstash / Fluentd / etc

Most modern logging pipelines (e.g. Fluentd, Logstash) should support ingesting data from this plugin. You can either use the default server and ship logs from its output, or create an http listener to accept this plugin's JSON payloads. If you use either of these or some other system, please consider making a contribution by including your config in this plugin's examples directory.

Custom

You can design a your own service to accept payloads provided by the plugin, and transform / store data as you see fit. If you do this, please consider open sourcing your work and telling me about it in an issue, so that I can include a link to your work here.

Configuring the Panel

Once you have a server running, you must place its endpoint in the plugin's settings. For example, if you use the default server, the endpoint would be http://your-server-name:your-port/write.

There are several other options which all provide descriptions in the Grafana UI. Please read them, and take note of any requirements in your server's documentation (for instance, using Telegraf is much more simple if you enable flatten, but most other servers will require flatten to be disabled).

This plugin works by using the session data provided to every panel in your dashboard. As such, you will need to ensure that analytics-panel is being loaded every time a dashboard you wish to monitor is being loaded. This means that you should place this panel in part of the dashboard that is guaranteed to be loaded by the user when they visit your dashboard. As of right now, the only place that you absolutely cannot place analytics-panel is inside a row, as expanding and collapsing the row is essentially the same as loading and unloading the entire dashboard, from any panel's perspective.

Hiding the Panel

While you cannot place the panel inside a row, you can take several steps to make the panel very difficult to notice, and this will not have any negative effects on the plugin's behavior.

  • In Visualization, set Hidden to True.
  • In General Settings, set Transparent to True.
  • In General Settings, set Title/Description to nothing. Alternatively, you can set a Title/Description and use this panel as a title, separator, or footer.
  • Save and make the panel as small as you want. I found that 1 height, 100% width works well.

Default Settings

If you are planning on including this panel on many or all of your dashboards, you may want to consider changing the default settings for analytics-panel. This can save you time, since you will not need to input the same endpoint and/or toggle some setting every time you add a new panel.

You can edit defaults by doing the following:

  • Edit the src/defaults.json file.
  • Run npm run build to generate an updated dist.
  • Sign with a private signature (optional).
  • Copy the updated plugin to your plugins directory.
  • Restart Grafana.

Note that changing defaults will not change existing panels. Defaults are copied to the dashboard when the panel is added.

Troubleshooting

If something is not working properly, the first thing you should do is look at your browser's console and network inspector. After opening the inspector, load a dashboard with an analytics-panel and take a look at the console, the request, and the response. In most cases, problems should be evident here.

In the event that you have many panels scattered across many dashboards, and suspect that some panels may be experiencing issues, you can sort your dashboards by "Errors Total - Most", or one of its variants. Note that errors are not thrown if JSON data is visible.

If you run into an issue you cannot solve, please post an issue and I will do my best to look into your inquiry.

macropower-analytics-panel's People

Contributors

jacobcolvin-8451 avatar macropower avatar mig4 avatar

Stargazers

 avatar  avatar  avatar  avatar  avatar  avatar  avatar  avatar  avatar  avatar  avatar  avatar  avatar  avatar  avatar  avatar  avatar  avatar  avatar  avatar  avatar  avatar  avatar  avatar  avatar

Watchers

 avatar  avatar  avatar

macropower-analytics-panel's Issues

Add "keep-alive" option

From #10

Another idea I have in mind is a "keep-alive" option: since the plugin can't send the end request when the browser window is closed, it could send a keep alive to the server every x minutes. The server could than be configured to consider a session ended if it didn't receive a keep-alive for more than x+1 minutes (or more) which could still be overwritten if the end request comes in. - @jtommi

I really like this idea and think it could really help solve a number of issues with the data this plugin delivers. I'm opening up this issue to track progress.

SyntaxError: Unexpected end of input

Hi,

Thanks for this plugin, will be really useful for my work. I've configured it with my REST API backend that can receive the JSON body successfully. But after a few seconds, the plugin view reports a "SyntaxError: Unexpected end of input" error. My server returns a JSON response with the format {"location":"12345"} which seems to correspond with the guidance in the documentation.
Screenshot 2020-07-14 at 11 59 03

I'm not sure if this is related but when I navigate away from the dashboard I never receive an 'end of session' response even though my server is set up to receive it (i.e. myaddress/mypath/{id}).

Did anyone experience this? I'm using Grafana 7.0.6 (9f4a172a76) and plugin version 1.0.0.

Docker recompile error after defaults change

Running in docker, trying to recompile the plugin after editing the defaults.json

FROM grafana/grafana:7.3.5
USER root
RUN apk update \ 
 && apk add jq \
 && apk add git \
 && apk add unzip \
 && apk add nodejs npm \
 && rm -rf /var/cache/apk/*
# download plugin
ADD https://github.com/MacroPower/macropower-analytics-panel/archive/refs/tags/v2.0.0.zip /var/lib/grafana/plugins/macropower-analytics-panel.zip
RUN unzip /var/lib/grafana/plugins/macropower-analytics-panel.zip -d /var/lib/grafana/plugins/ && rm /var/lib/grafana/plugins/macropower-analytics-panel.zip
# copy changed plugin defaults 
COPY --chown=644 defaults.json /var/lib/grafana/plugins/macropower-analytics-panel-2.0.0/src/defaults.json
# recompile plugin
RUN cd /var/lib/grafana/plugins/macropower-analytics-panel/ && npm install
RUN cd /var/lib/grafana/plugins/macropower-analytics-panel/ && npm run build
USER grafana

And getting a few problems

  1. Not really a problem, more a concern. On npm install I getfound 6 vulnerabilities (2 low, 3 moderate, 1 high) Any plans to fix these?
  2. Getting an error on npm run build:
> [10/12] RUN cd /var/lib/grafana/plugins/macropower-analytics-panel-2.0.0/ && npm run build:
#15 0.619 
#15 0.619 > [email protected] build /var/lib/grafana/plugins/macropower-analytics-panel-2.0.0
#15 0.619 > grafana-toolkit plugin:build
#15 0.619 
#15 2.157   Using Node.js [object Object]
#15 3.642   Using @grafana/toolkit [object Object]
#15 3.645 - Preparing
#15 3.653 ✔ Preparing
#15 3.654 - Linting
#15 5.022   Warning: React version was set to "detect" in eslint-plugin-react settings, but the "react" package is not installed. Assuming latest React version for linting.
#15 5.952   
#15 5.952   
#15 5.955   
#15 5.955   /var/lib/grafana/plugins/macropower-analytics-panel-2.0.0/src/payload.ts
#15 5.955     11:11  error  Array type using 'Array<string>' is forbidden for simple types. Use 'string[]' instead  @typescript-eslint/array-type
#15 5.955   
#15 5.955   /var/lib/grafana/plugins/macropower-analytics-panel-2.0.0/src/utils.ts
#15 5.955     51:20  error  Array type using 'Array<TemplateVariable>' is forbidden for simple types. Use 'TemplateVariable[]' instead  @typescript-eslint/array-type
#15 5.955     56:16  error  Array type using 'Array<string>' is forbidden for simple types. Use 'string[]' instead                      @typescript-eslint/array-type
#15 5.955   
#15 5.955   ✖ 3 problems (3 errors, 0 warnings)
#15 5.955     3 errors and 0 warnings potentially fixable with the `--fix` option.
#15 5.955   
#15 5.955   
#15 5.955   
#15 5.957   Trace: Error: 3 linting errors found in 6 files
#15 5.957       at /var/lib/grafana/plugins/macropower-analytics-panel-2.0.0/node_modules/@grafana/toolkit/src/cli/tasks/plugin.build.js:118:31
#15 5.957       at step (/var/lib/grafana/plugins/macropower-analytics-panel-2.0.0/node_modules/@grafana/toolkit/node_modules/tslib/tslib.js:140:27)
#15 5.957       at Object.next (/var/lib/grafana/plugins/macropower-analytics-panel-2.0.0/node_modules/@grafana/toolkit/node_modules/tslib/tslib.js:121:57)
#15 5.957       at fulfilled (/var/lib/grafana/plugins/macropower-analytics-panel-2.0.0/node_modules/@grafana/toolkit/node_modules/tslib/tslib.js:111:62)
#15 5.957       at processTicksAndRejections (internal/process/task_queues.js:97:5)
#15 5.957       at /var/lib/grafana/plugins/macropower-analytics-panel-2.0.0/node_modules/@grafana/toolkit/src/cli/utils/useSpinner.js:25:29
#15 5.957       at step (/var/lib/grafana/plugins/macropower-analytics-panel-2.0.0/node_modules/@grafana/toolkit/node_modules/tslib/tslib.js:140:27)
#15 5.957       at Object.throw (/var/lib/grafana/plugins/macropower-analytics-panel-2.0.0/node_modules/@grafana/toolkit/node_modules/tslib/tslib.js:121:57)
#15 5.957       at rejected (/var/lib/grafana/plugins/macropower-analytics-panel-2.0.0/node_modules/@grafana/toolkit/node_modules/tslib/tslib.js:112:69)
#15 5.957       at processTicksAndRejections (internal/process/task_queues.js:97:5)
#15 5.957 ✖ 3 linting errors found in 6 files
#15 5.992 npm ERR! code ELIFECYCLE
#15 5.992 npm ERR! errno 1
#15 5.998 npm ERR! [email protected] build: `grafana-toolkit plugin:build`
#15 5.998 npm ERR! Exit status 1
#15 5.998 npm ERR! 
#15 5.998 npm ERR! Failed at the [email protected] build script.
#15 5.998 npm ERR! This is probably not a problem with npm. There is likely additional logging output above.
#15 6.005 
#15 6.005 npm ERR! A complete log of this run can be found in:
#15 6.005 npm ERR!     /root/.npm/_logs/2021-05-07T19_21_28_248Z-debug.log
------
executor failed running [/bin/sh -c cd /var/lib/grafana/plugins/macropower-analytics-panel-2.0.0/ && npm run build]: exit code: 1

Any help on this build error would be appreciated!

Height 0 and width 100 not working

I made a couple of tests and for me it is not working if I hide the panel with 0 height, 100% width. Only 1 height works. I am using telegraf plugin

Are there any instructions on how to configure this plugin on grafana.net please?

Hi @MacroPower

I'm using the hosted grafana.net service. I was able to install the plugin on grafana.com and it shows up as installed

on grafana.com

image

on grafana.net

image

And I've seen the jtommi notes on how to create a server to capture the statistics it will fire...

So I create a folder and a dashboard:

image

I see nothing in panels

image

So my questions are:

  1. How to configure this panel (I cannot find any instructions on how to plug the server URL in)
  2. How to add the panel to a dashboard.

Problem in Config

Hi
I want to use the plugin but, I cann't Config that.

I use Telegraf plugin http_listener_v2 on my server that grafana also was placed on it.

That Telegraf plugin was receives data and worked properly but this plugin seems don't send any data.

Please help me to fix this problem.
Thanks a lot.

macropower-analytics-panel behind reverse-proxy

Hello, I am trying to run macropower-analytics-panel in a docker served grafana sitting behind a reverse proxy. The plugin installation is done correctly (using the env variable in dockerfile) and I have also set the domain in the docker configuration (again through the env variable in th Dockerfile).

However, I am getting the following errors (info - but the plugin does not work eventually) in the grafana startup logs:

t=2021-08-21T07:44:34+0000 lvl=info msg="Request Completed" logger=context userId=1 orgId=1 uname=admin method=GET path=/api/live/ws status=0 remote_addr=10.0.1.1 time_ms=0 size=0 referer=
t=2021-08-21T07:44:40+0000 lvl=info msg="Request Completed" logger=context userId=1 orgId=1 uname=admin method=GET path=/public/plugins/macropower-analytics-panel/img/logo.svg status=404 remote_addr=10.0.1.1 time_ms=0 size=1727 referer=https://[reducted]/plugins
t=2021-08-21T07:44:42+0000 lvl=info msg="Request Completed" logger=context userId=1 orgId=1 uname=admin method=GET path="/public/img/icons/unicons/icon-gf icon-gf-panel.svg" status=404 remote_addr=10.0.1.1 time_ms=2 size=37433 referer=https://[reducted]/plugins/macropower-analytics-panel/
t=2021-08-21T07:44:42+0000 lvl=info msg="Request Completed" logger=context userId=1 orgId=1 uname=admin method=GET path=/public/plugins/macropower-analytics-panel/module.js status=404 remote_addr=10.0.1.1 time_ms=0 size=1727 referer=https://[reducted]/plugins/macropower-analytics-panel/
t=2021-08-21T07:44:42+0000 lvl=info msg="Request Completed" logger=context userId=1 orgId=1 uname=admin method=GET path=/public/plugins/macropower-analytics-panel/img/logo.svg status=404 remote_addr=10.0.1.1 time_ms=0 size=1727 referer=https://[reducted]/plugins/macropower-analytics-panel/

Plugin does not work in Grafana 7.1.0, 7.1.1, 7.1.3

In Grafana 7.1.x, the ability to get the $__dashboard variable via <TemplateSrv>.getVariables() was dropped. The panel is not loading as a result of that.

I will need to revert back to the old method of gathering this info from the URL until I either find a new way to gather this data, or support is re-introduced.

In the future this should be an optional property so that it doesn't crash the entire panel.

Return a standard template value along with a type field

Right now, grafana can return template values of either null, string, or string[].

To make deserialization more simple, values should always be represented as string[].

e.g.
null = [], string = [""], string[] = ["", "", ...]

Then append a "type" field so that users may still distinguish between different selection options. (e.g. single-select, multi-select).

Possibility of an example backend server?

This is a great idea and project, thanks for sharing. Are there any plans to offer an example backend to help adoption and time to configure? I'd love to use this but I'm way too novice to take the time to figure that out at the moment.

Not Seeing Session Duration

I have the macropower_analytics_server and Prometheus setup in my Kubernetes cluster and I can see metrics on Grafana dashboard utilization being exported. However, I'm not seeing grafana_analytics_sessions_duration_seconds_total when I query for it in Grafana.

However, I can query for grafana_analytics_sessions_total just fine. Is there something I'm missing in order to track seconds duration per session? I have session-timeout set to 1h.

Grafana Dashboard Tracking

@MacroPower Can I use this plugin to find out the count of users coming onto a particular grafana dashboard , if yes then pls guide how to extract that data?

Feature suggestions for 2.x

I had some features in mind and wanted to get your take on which are interesting and what's the level of complexity to implement them.

Send panel options in the body

It would be nice to add the panel options in the body, e.g. {'heartbeat_activated': true, 'heartbeat_interval': 60}, etc
That would allow to easily spot sessions that were closed, especially with Heartbeat always activated.

Add 'in_focus' field in the heartbeat payload when 'Heartbeat always' is activated

I don't know how doable this is. The idea is to be able to know when the window is out of focus

Add the session start time in every payload

First I thought that the heartbeat paylaods shouldn't contain the objects user, host and dashboard, since they shouldn't change within a session.
Then I started my listener a bit to late, it did miss the start payload and the subsequent heartbeat payload through an exception on my listener because it couldn't find the UUID in the DB.
So I'd leave the complete payload in each type so that basically any heartbeat can also be a start in case the listener missed it.
But in that case it would be great to have the session start time in every payload.

Add a refresh payload

In addition to the heartbeat, also send a payload of {"type": "refresh"} each time the dashboard refreshes the panels
I'm not sure what would be the added value though compared to the heartbeat.

Improve URL parsing

Rather than using regex replace statements (which were meant to be depreciated prior to #5), use the URL type to gather the path. This can be more reliable in gathering the dashboard name and uid.

Current issues:

  • Breaks when adding to a non-saved dashboard
  • Can break with certain combinations of trailing slashes and query parameters

Add option to avoid including personally identifiable information in collected data

Hi, thanks for the plugin, it looks great! We're looking into using it in a couple of our dashboards at Giant Swarm.

What do you think of an option to avoid including any personally identifiable information in the collected data? I'm thinking specifically about user.login and user.email fields (aka user_login and user_email labels on metrics).

I'm aware we can strip those when ingesting into Prometheus but we'd have a slight preference to not store it at all.

I'm happy enough to work on a PR to add this, just wanted to start a discussion to see what you think.

SyntaxError: JSON.parse: unexpected end of data at line 1 column 1 of the JSON data

I threw together a quick listener using nodejs, but when activating "Post end", I get an error saying it couldn't parse the response and I don't understand why.

As you see, the payload looks good in Firefox and the Content type is JSON
image

Here is the NodeJS snippet:

app.post('/load', (req, res) => {
  res.statusCode = 201;
  res.json({ location: '12345664' });
  res.end();
});

I'm using a fresh docker image of Grafana 7.1.5

Recommend Projects

  • React photo React

    A declarative, efficient, and flexible JavaScript library for building user interfaces.

  • Vue.js photo Vue.js

    🖖 Vue.js is a progressive, incrementally-adoptable JavaScript framework for building UI on the web.

  • Typescript photo Typescript

    TypeScript is a superset of JavaScript that compiles to clean JavaScript output.

  • TensorFlow photo TensorFlow

    An Open Source Machine Learning Framework for Everyone

  • Django photo Django

    The Web framework for perfectionists with deadlines.

  • D3 photo D3

    Bring data to life with SVG, Canvas and HTML. 📊📈🎉

Recommend Topics

  • javascript

    JavaScript (JS) is a lightweight interpreted programming language with first-class functions.

  • web

    Some thing interesting about web. New door for the world.

  • server

    A server is a program made to process requests and deliver data to clients.

  • Machine learning

    Machine learning is a way of modeling and interpreting data that allows a piece of software to respond intelligently.

  • Game

    Some thing interesting about game, make everyone happy.

Recommend Org

  • Facebook photo Facebook

    We are working to build community through open source technology. NB: members must have two-factor auth.

  • Microsoft photo Microsoft

    Open source projects and samples from Microsoft.

  • Google photo Google

    Google ❤️ Open Source for everyone.

  • D3 photo D3

    Data-Driven Documents codes.