Giter Site home page Giter Site logo

mich-w / qtserialmonitor Goto Github PK

View Code? Open in Web Editor NEW
183.0 9.0 66.0 12.64 MB

Qt serial monitor and data plotter

License: GNU General Public License v3.0

C++ 99.83% C 0.04% QMake 0.13%
arduino serialmonitor plotter serial-plotter serial-monitor qt oscilloscope serial-console serial-arduino graph

qtserialmonitor's Introduction

QtSerialMonitor

license downloads latest release

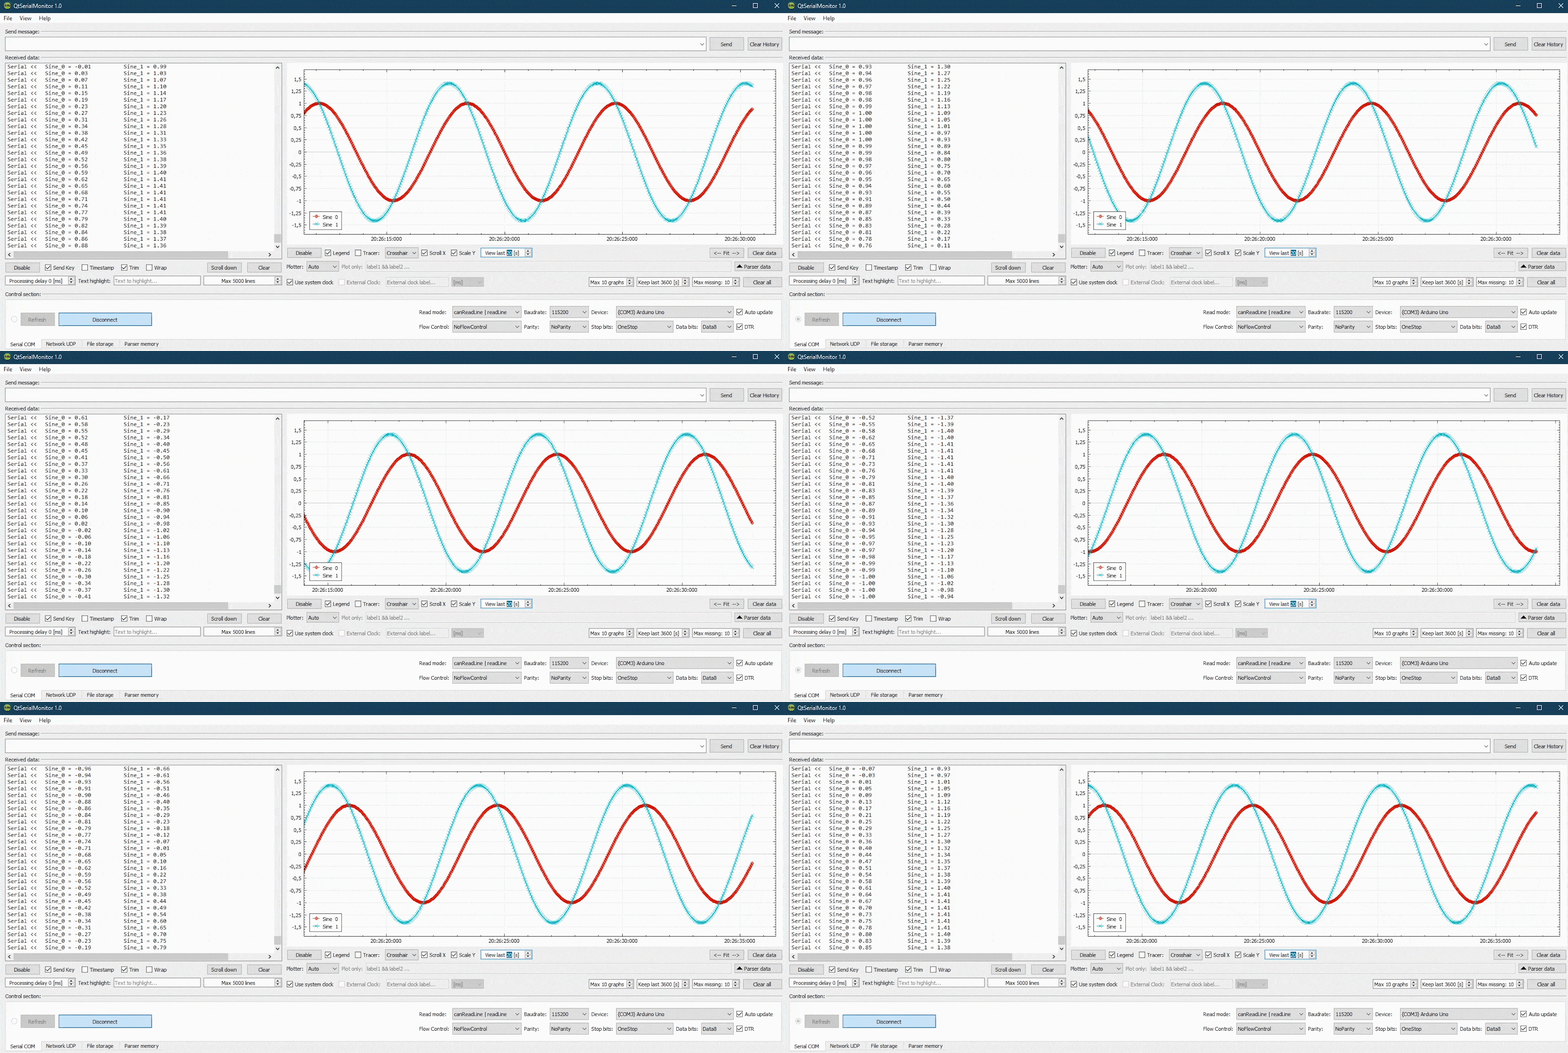
Universal serial monitor with data plotting capabilities, based on Qt. Designed with all sorts of Arduino projects in mind, as a handy tool for debugging and experimentation :)

Features:

  • In/out serial data terminal with command history,
  • UDP network protocol support,
  • Resizable UI widgets,
  • Data plotter with multiple graphs support and basic data filtering - uses QCustomPlot,
  • Printer support, ability to save graph as image,
  • Read/write ".csv", ".txt" data logs,
  • many more...

Work in progress:

- 3D Orientation Demo - for IMU testing (user will be able to toggle between chart view
  and a simple 3D scene containing an object rotating accordingly to received roll,
  pitch and yaw values, representing the sensor's orientation),

- Improvements, fixes etc.

Notes:

  • The app uses a custom-written parser, which searches the incoming message for plottable data in form of label-value set. At the moment, all labels and values must be separated with a whitespace in order to be recognized. Its possible to use separators like "=" and "," - parser will be replace them with whitespace before processing. If no label is found, a generic name will be used i.e. "Graph 0".*

      Examples of supported formats:
    
      - "Roll = 1.23 Pitch = 45.6"
      - "Voltage: 1.23 (tabulator) Output: 4.56"
      - "1.23 4.56" (Graph 0 and Graph 1)
    
  • Application uses QtSettings functionality and stores a simple .ini file on the hard drive in which it keeps its settings. Under Windows, the file should be located in C:\ProgramData\QtSerialMonitor. The settings are saved each time the app closes.

qtserialmonitor's People

Contributors

albymor avatar enkiusz avatar mich-w avatar

Stargazers

 avatar  avatar  avatar  avatar  avatar  avatar  avatar  avatar  avatar  avatar  avatar  avatar  avatar  avatar  avatar  avatar  avatar  avatar  avatar  avatar  avatar  avatar  avatar  avatar  avatar  avatar  avatar  avatar  avatar  avatar  avatar  avatar  avatar  avatar  avatar  avatar  avatar  avatar  avatar  avatar  avatar  avatar  avatar  avatar  avatar  avatar  avatar  avatar  avatar  avatar  avatar  avatar  avatar  avatar  avatar  avatar  avatar  avatar  avatar  avatar  avatar  avatar  avatar  avatar  avatar  avatar  avatar  avatar  avatar  avatar  avatar  avatar  avatar  avatar  avatar  avatar  avatar  avatar  avatar  avatar  avatar  avatar  avatar  avatar  avatar  avatar  avatar  avatar  avatar  avatar  avatar  avatar  avatar  avatar  avatar  avatar  avatar  avatar  avatar  avatar

Watchers

 avatar  avatar  avatar  avatar  avatar  avatar  avatar  avatar  avatar

qtserialmonitor's Issues

Graphs display issue when data "hi-speed" send

image

/*
  for test 
  by Enzo
*/

void setup() {
  //Initialize serial and wait for port to open:
  Serial.begin(115200);
  while (!Serial) {
    ; // wait for serial port to connect. Needed for native USB port only
  }
}

float thisByte = 0.0f;

void loop() {

  Serial.print(sin(thisByte)*100.0f);
  Serial.print(",");
  Serial.print(cos(thisByte)*100.0f);
  Serial.print(",");
  Serial.print(sin(thisByte)*50.0f);
  Serial.print(",");
  Serial.print(cos(thisByte)*50.0f);
  Serial.print(",");
  Serial.print(sin(thisByte));
  Serial.print("\n");
  
  delay(10);
  thisByte += 0.1f;
  if (thisByte == 360.0f) {    // you could also use if (thisByte == '~') {
    thisByte = 0.0f;
  }
}

Exporting big data from csv takes too much delay.

I want to export the data I read through the serial port with Qt c++ with excel. But when there is too much data, the application stops responding. I know it stopped responding because the process hasn't finished yet. When the process is finished, I get my excel export file properly. The problem starts here. I need to transfer a maximum of two hundred thousand rows of data and this process takes hours. Please check this link.

Window size on Linux is to big

Is there a property that I can/need to modify to not have a screen width of 1910 ? For now I can't manage to do it because the values resets to the old ones.

Data points overlap in the time domain at high frequency

Data points overlap in the time domain at high frequency

Screenshots

image

zoom in:

image

Description

Environment

ESP32 WROOM DevKit v1 (ESP32-WROOM32 + CP210x(TTL2USB))
MPU6050

Windows 10, Home, 22H2, 19045.2486
QtSerialMonitor v1.53

Test code

library source: jrowberg/i2cdevlib: I2C device library collection for AVR/Arduino or other C++-based MCUs (github.com)

#include <Arduino.h>
#include <Wire.h>

#include "I2Cdev.h"
#include "MPU6050.h"

MPU6050 accelgyro;
int16_t gx, gy, gz;

void init_mpu() {
    Wire.begin();

    Serial.println("Initializing I2C devices...");
    accelgyro.initialize();

    Serial.println("Testing device connections...");
    Serial.println(accelgyro.testConnection() ? "MPU6050 connection successful" : "MPU6050 connection failed");
}

void setup() {
    Serial.begin(115200);
    while (!Serial) {
        ; // wait for serial port to connect. Needed for native USB
    }
    Serial.setDebugOutput(true);
    Serial.println("UART0");
    init_mpu();
}

void loop() {
    accelgyro.getRotation(&gx, &gy, &gz);
    Serial.print(gz);
    Serial.println();
}

Description

The loop() runs at about 1020Hz (get 490933 figures in 8 minutes), or a period of approximately 1ms.

Each byte at 115200 baud rate takes $\frac{10\text{-bit}}{115200\text{\ b/s}}\approx86.8\mu\text{s}$, so the Serial.print(gz); and Serial.println(); require 500~700us to send. The above result(1020Hz) seems to be reasonable for me.

But the QtSerialMonitor plots new data in the time domain at a minimum period of roughly 30ms~50ms, causing the phenomenon in the screenshots above.

Speculation

Windows?

Acquiring high-resolution time stamps - Win32 apps | Microsoft Learn

I've tried to tinker with the process priority of QtSerialMonitor in Windows task manager. Unfortunately, it didn't work. And I don't have a Linux or Mac device to test on.

Qt

QDateTime and QTime accuracy issues

QtSerialMonitor?

software internal processing time?

software internal clog?

P.S.

by the way, is that possible to plot something like:

image

In this way the time domain accuracy is greatly improved. But it seems that Qt cannot achieve this?

Which Qt version to use for building

Which Qt version should be used to build this project? Where does one obtain the Windows installer? With Qt 5.12 I get the following error:

QtSerialMonitor-master\src\logger.cpp:142: error: 'Qt::SplitBehaviorFlags' has not been declared
..\src\logger.cpp: In member function 'void Logger::writeLogCSV(QStringList, QList, bool)':
..\src\logger.cpp:142:75: error: 'Qt::SplitBehaviorFlags' has not been declared
QStringList origFile = out.readAll().split(QRegExp("[\r\n]"), Qt::SplitBehaviorFlags::SkipEmptyParts);

Recommend Projects

  • React photo React

    A declarative, efficient, and flexible JavaScript library for building user interfaces.

  • Vue.js photo Vue.js

    ๐Ÿ–– Vue.js is a progressive, incrementally-adoptable JavaScript framework for building UI on the web.

  • Typescript photo Typescript

    TypeScript is a superset of JavaScript that compiles to clean JavaScript output.

  • TensorFlow photo TensorFlow

    An Open Source Machine Learning Framework for Everyone

  • Django photo Django

    The Web framework for perfectionists with deadlines.

  • D3 photo D3

    Bring data to life with SVG, Canvas and HTML. ๐Ÿ“Š๐Ÿ“ˆ๐ŸŽ‰

Recommend Topics

  • javascript

    JavaScript (JS) is a lightweight interpreted programming language with first-class functions.

  • web

    Some thing interesting about web. New door for the world.

  • server

    A server is a program made to process requests and deliver data to clients.

  • Machine learning

    Machine learning is a way of modeling and interpreting data that allows a piece of software to respond intelligently.

  • Game

    Some thing interesting about game, make everyone happy.

Recommend Org

  • Facebook photo Facebook

    We are working to build community through open source technology. NB: members must have two-factor auth.

  • Microsoft photo Microsoft

    Open source projects and samples from Microsoft.

  • Google photo Google

    Google โค๏ธ Open Source for everyone.

  • D3 photo D3

    Data-Driven Documents codes.