Stanford University, CS193p, Winter 2015, Assignment 3 (iOS)
The Graphing Calculator is a continuation of the previous 2 assignments from the Stanford University CS193P course Developing iOS 8 Apps with Swift, available for free on iTunes. This is the third and final assignment in the Calculator series.
For the other 2 projects, please see:
https://github.com/sanjibahmad/CalculatorBrain
https://github.com/sanjibahmad/Calculator
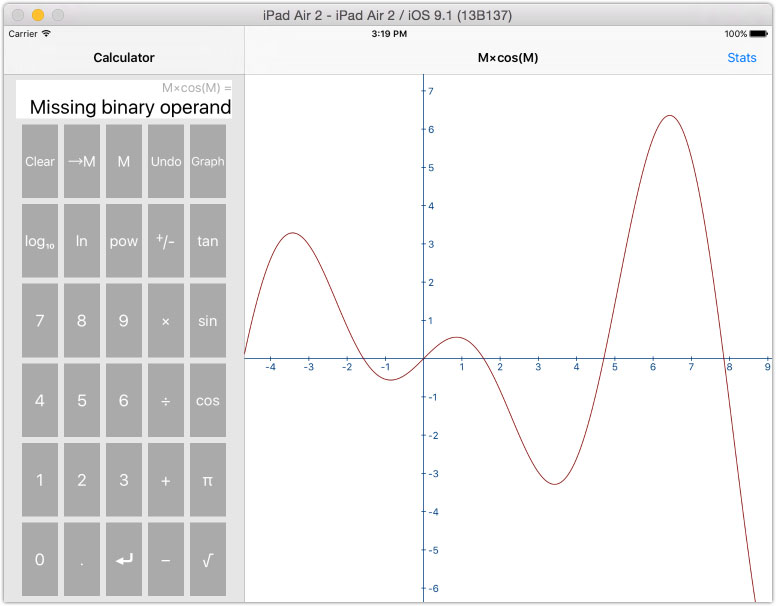
This project provides graphing features in addition to the regular calculator functions. Graphs can be plotted by entering expressions where M is the independent variable. Please see examples below.
To plot M, enter: M, Graph
To plot sin(M), enter: M, Sin, Graph
To plot M x cos(M), enter: M, M, cos, x, Graph
Some interesting notes:
- The CalculatorBrain is reused to calculate the values of M for graphing
- Plot values are set in the GraphingViewController as the data source of GraphingView
- To fix the sluggish performance when zoomed out and panned, only the number of plots required for the screen width are calculated
- Graph scale and origin is stored in NSUserDefaults
- Upon device rotation, the graph is centered and adjusted slightly with the width and height change ratio