This XBlock allows students to visualize data on a pie chart and interact with it. You can easily integrate the XBlock into Open edX and start to use the pie chart.
In order to install the XBlock into your Open edX devstack Server you need to:
-
Download the XBlock from github. Place the files inside your server.
-
Install your block: You must replace
/path/to/your/blockwith the path where you have downloaded the XBlock$ vagrant ssh vagrant@precise64:~$ sudo -u edxapp /edx/bin/pip.edxapp install /path/to/your/block
-
Enable the block:
#. In
edx-platform/lms/envs/common.py, uncomment::# from xmodule.x_module import prefer_xmodules # XBLOCK_SELECT_FUNCTION = prefer_xmodules#. In
edx-platform/cms/envs/common.py, uncomment::# from xmodule.x_module import prefer_xmodules # XBLOCK_SELECT_FUNCTION = prefer_xmodules#. In
edx-platform/cms/envs/common.py, change::'ALLOW_ALL_ADVANCED_COMPONENTS': False, to:: 'ALLOW_ALL_ADVANCED_COMPONENTS': True -
Add the block to your courses' advanced settings in Studio:
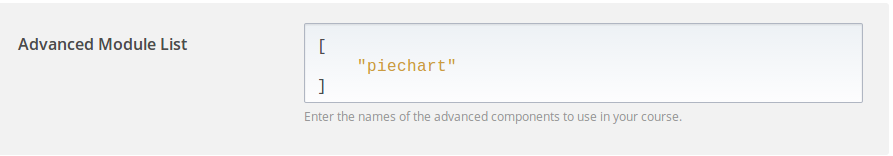
#. Log in to Studio, and open your course #. Settings -> Advanced Settings #. Change the value for the key
"advanced_modules"topiechart
In the Studio go to:

Add a piechart policy key on the advanced_modules keys
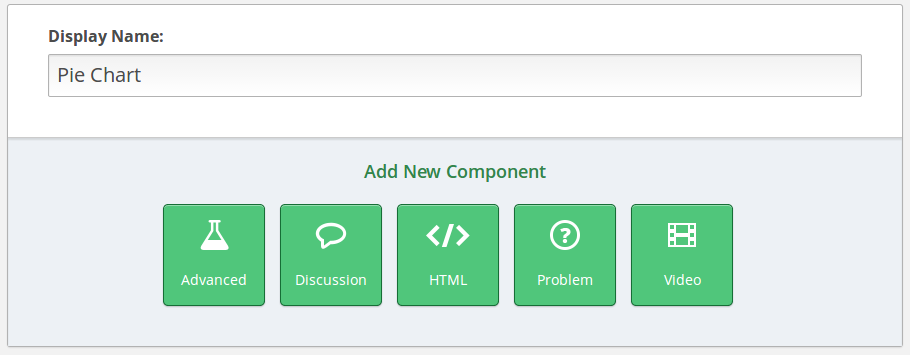
After that, a new button called Advanced will appear in your unit edit view
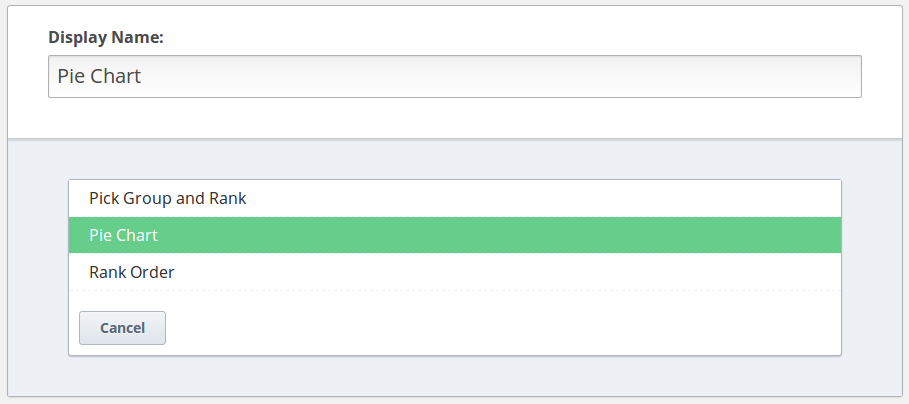
Add a new option called Pie Chart, which will add the component with the default pie chart to the course.
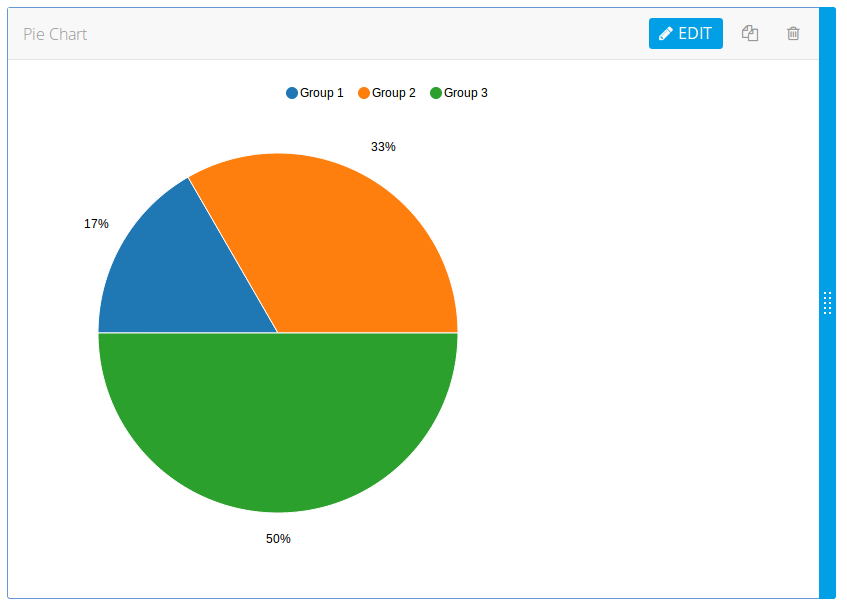
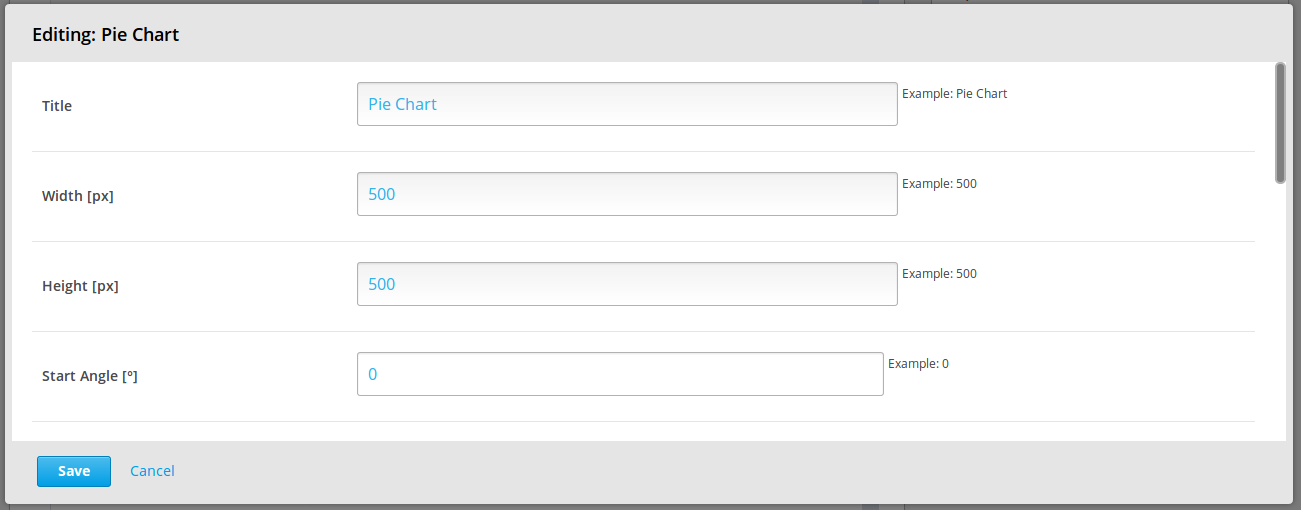
You can change the parameters of the pie chart by pressing the edit button.
Right now you can change:
1. Title of the XBlock
2. Width and Height of the XBlock
3. Start and End angle of the Pie Chart
4. Whether labels will be shown or not
5. Label threshold
6. Label type (whether percent, group name or group value will be displayed)
7. Whether the pie chart is donut or not
8. Number of available groups of data
9. Group name and value for each group of data
1. Legend:    click one -> show/hide group of data
              double click -> hide every group of data except the one that was clicked
2. Pie Chart: hover over -> shows the label with group name and value over the group


