A R implementation of k-means clustering algorithm.
A matrix of paired points and number of cluster
The clusters of points and centers for each cluster
- kmeans with different cluster number
a2 = KM(Data,2)
a4 = KM(Data,4)
a6 = KM(Data,6)
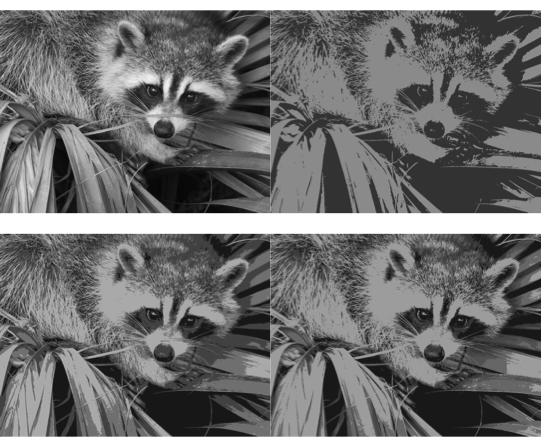
- Show compressed images
plotgrid = function(a){
data = a[[2]]
newmat = matrix(data$newdata,nrow = nrow(Data),ncol= ncol(Data))
## transfer to raster file for plot
rasterGrob(newmat)
}
k1 = rasterGrob(Data)
k2 = plotgrid(a2)
k4 = plotgrid(a4)
k6 = plotgrid(a6)
grid.arrange(k1,k2,k4,k6, ncol=2,nrow = 2)
imagE = function(a){
data = a[[2]]
newmat = matrix(data$newdata,nrow = nrow(Data),ncol= ncol(Data))
#transfer in to matrix, the original form
newmat = apply(newmat,2,rev)
return(newmat)
}
i2 = imagE(a2)
i4 = imagE(a4)
i6 = imagE(a6)
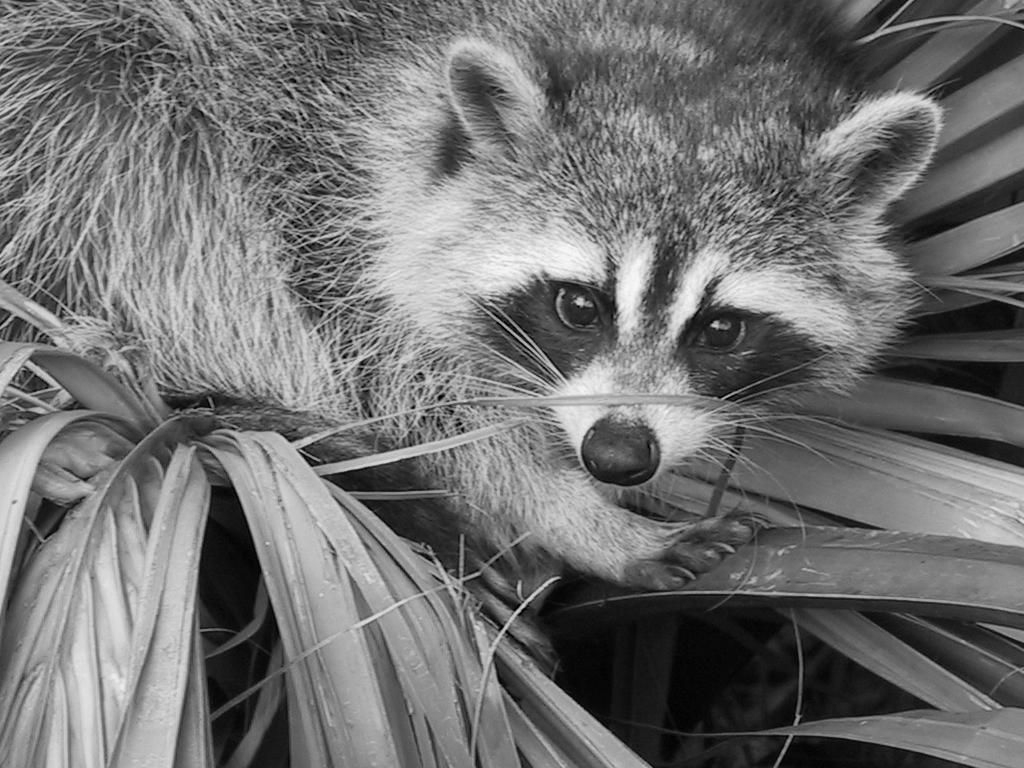
image(t(Data),col = grey(seq(0,1,length = 256)),axes = F,main = "Original")
image(t(i2), col = grey(seq(0,1,length = 256)),axes = F,main = "K = 2")
image(t(i4), col = grey(seq(0,1,length = 256)),axes = F,main = "K = 4")
image(t(i6), col = grey(seq(0,1,length = 256)),axes = F,main = "K = 6")