Giter Site home page Giter Site logo

moon-light-shadow / python-science-tutorial Goto Github PK

View Code? Open in Web Editor NEW

This project forked from naveenv92/python-science-tutorial

0.0 0.0 0.0 4.22 MB

Series of notebooks to illustrate different plotting features using Python

License: MIT License

Python 0.04% Jupyter Notebook 99.96%

python-science-tutorial's Introduction

Python Science Tutorials ๐Ÿ“ˆ๐Ÿ“Š

This repository will contain a series of scripts and notebooks to help people get acclimated to using Python for scientific publications.
Follow me at: @naveen.venkatesan


Table of Contents

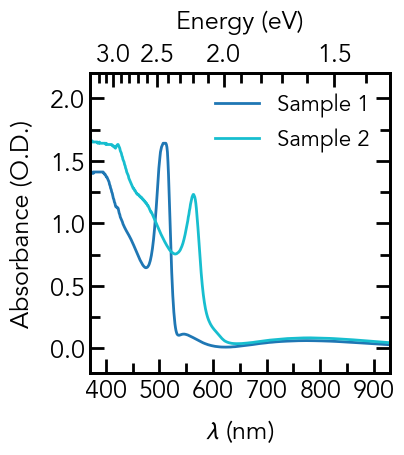
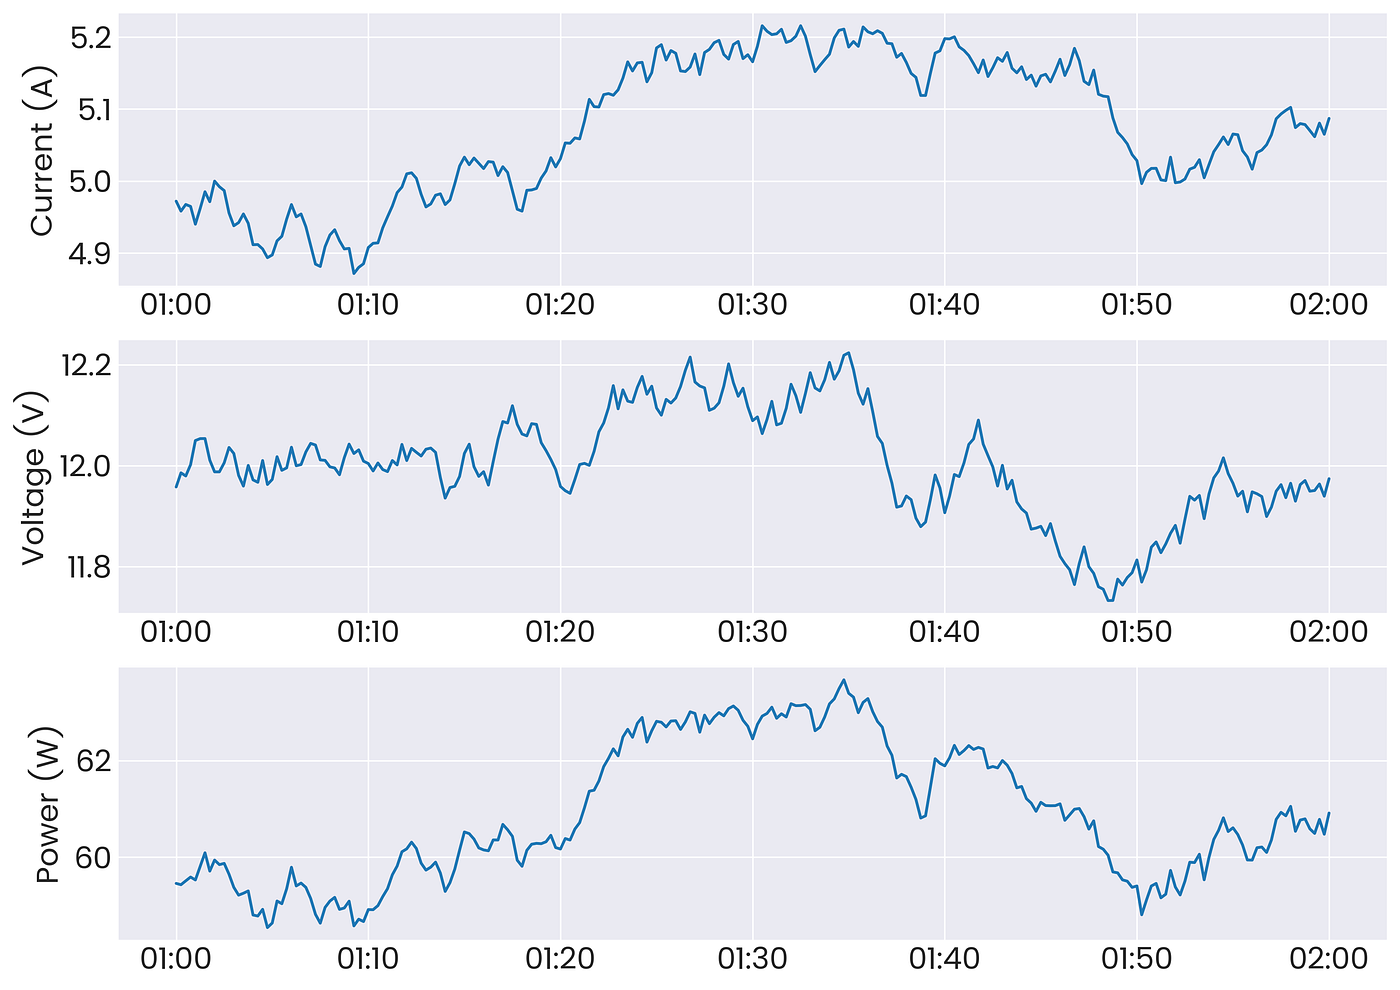
  1. An Introduction to Making Scientific Publication Plots with Python

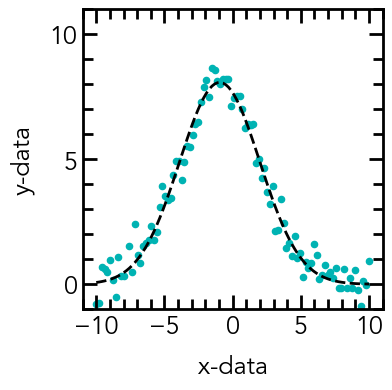
  2. Basic Curve Fitting of Scientific Data With Python

  3. Visualizing Three-Dimensional Data - Heatmaps, Contours, and 3D Plots with Python

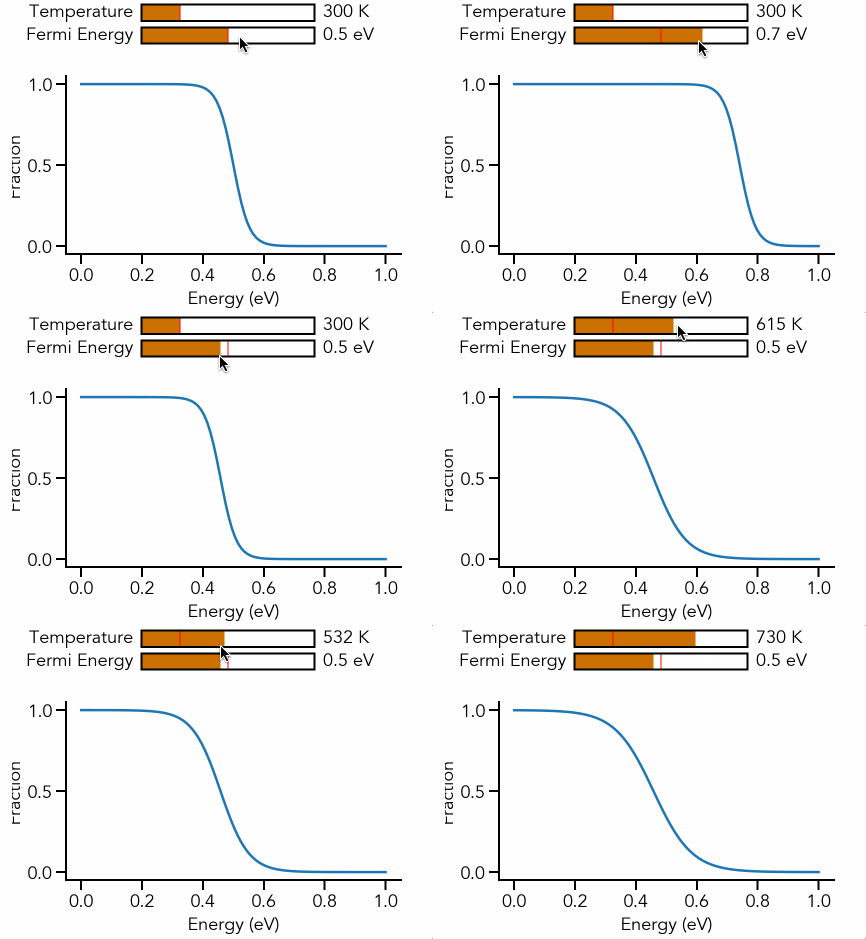
  4. Intro to Dynamic Visualization with Python - Animations and Interactive Plots

  5. A Guide to Creating and Using Your Own Matplotlib Style

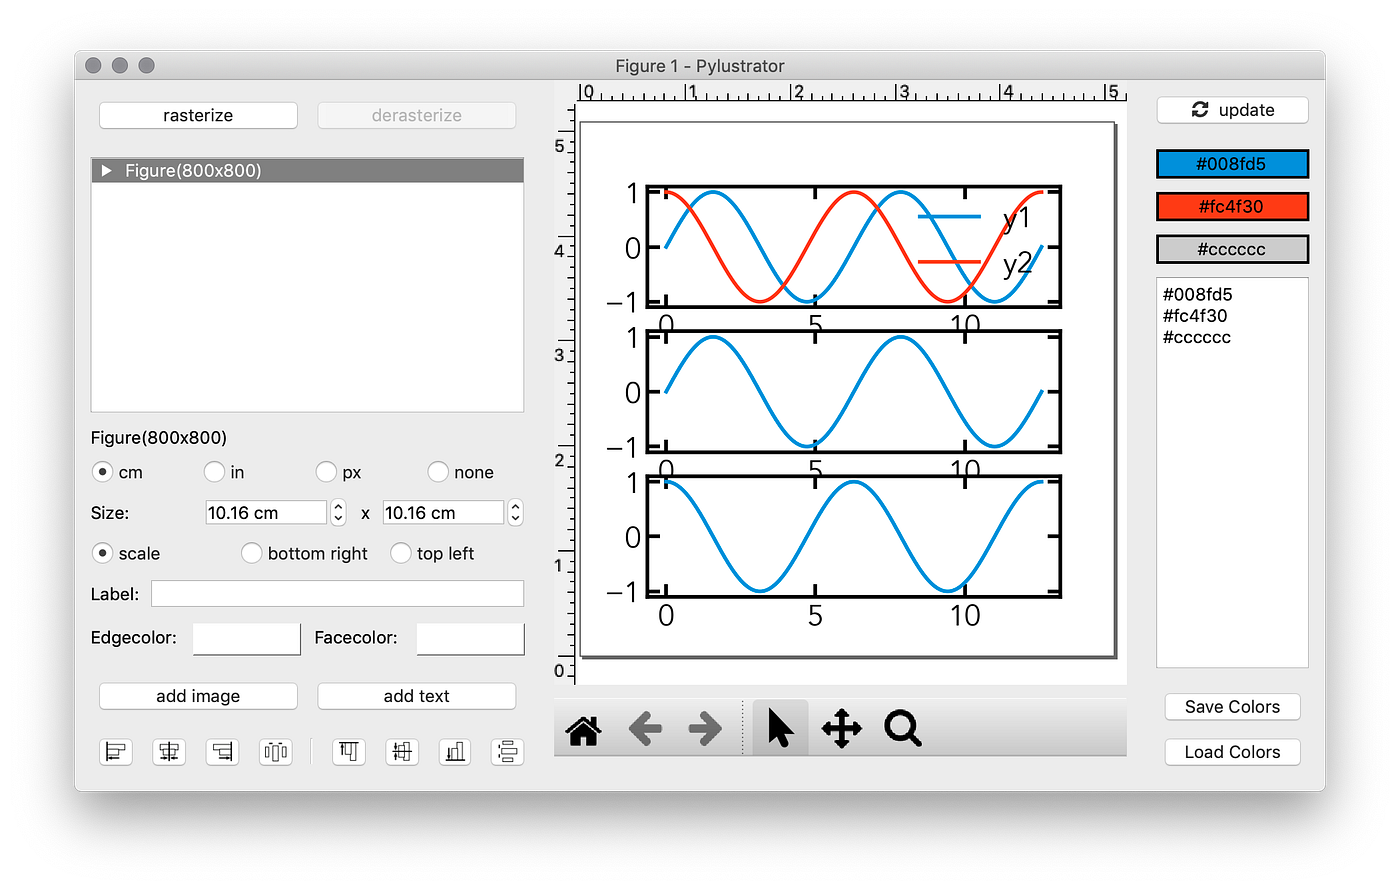
  6. Generate Easily Reproducible Scientific Figures with Pylustrator

  7. Create Panel Figure Layouts in Matplotlib with Gridspec

  8. Intro to Comparing and Analyzing Multiple Unevenly Spaced Time-Series Signals

  9. An Introduction to Plotly for Matplotlib Users

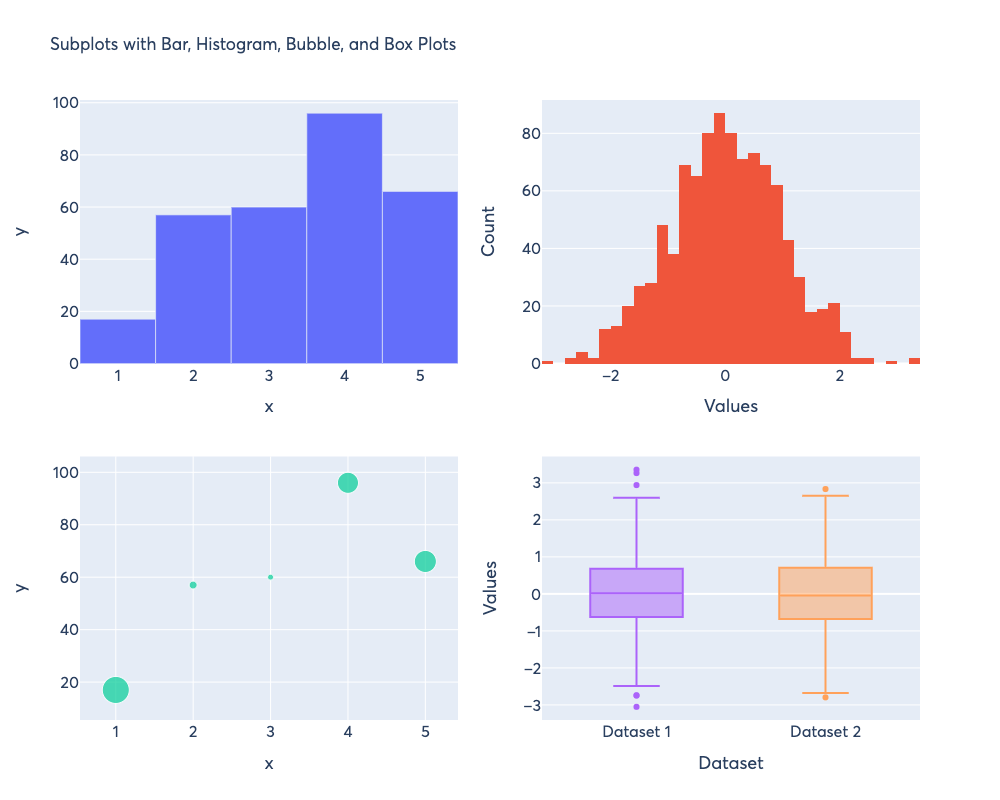
  10. Creating Various Plot Types and Subplots with Plotly


An Introduction to Making Scientific Publication Plots with Python

Link to Article: https://towardsdatascience.com/an-introduction-to-making-scientific-publication-plots-with-python-ea19dfa7f51e

Notebook: python-plotting-intro.ipynb


Basic Curve Fitting of Scientific Data With Python

Link to Article: https://towardsdatascience.com/basic-curve-fitting-of-scientific-data-with-python-9592244a2509

Notebook: curve-fitting-tutorial.ipynb


Visualizing Three-Dimensional Data - Heatmaps, Contours, and 3D Plots with Python

Link to Article: https://towardsdatascience.com/visualizing-three-dimensional-data-heatmaps-contours-and-3d-plots-with-python-bd718d1b42b4

Notebook: heatmaps.ipynb


Intro to Dynamic Visualization with Python - Animations and Interactive Plots

Link to Article: https://towardsdatascience.com/intro-to-dynamic-visualization-with-python-animations-and-interactive-plots-f72a7fb69245

Notebook: animation.ipynb


A Guide to Creating and Using Your Own Matplotlib Style

Link to Article: https://towardsdatascience.com/a-guide-to-creating-and-using-your-own-matplotlib-style-30de6c60bac0

Style File: scientific.mplstyle


Generate Easily Reproducible Scientific Figures with Pylustrator

Link to Article: https://towardsdatascience.com/generate-easily-reproducible-scientific-figures-with-pylustrator-9426292e07a4

Python Script: plot.py


Create Panel Figure Layouts in Matplotlib with Gridspec

Link to Article: https://towardsdatascience.com/create-panel-figure-layouts-in-matplotlib-with-gridspec-7ec79c218df0

Notebook: gridspec.ipynb


Intro to Comparing and Analyzing Multiple Unevenly Spaced Time-Series Signals

Link to Article: https://towardsdatascience.com/intro-to-comparing-and-analyzing-multiple-unevenly-spaced-time-series-signals-e46b2347972a#9512-73cf3e25e1a0

Notebook: time_series.ipynb


An Introduction to Plotly for Matplotlib Users

Link to Article: https://towardsdatascience.com/an-introduction-to-plotly-for-matplotlib-users-9f4f0d2113bc

Notebook: plotly.ipynb


Creating Various Plot Types and Subplots with Plotly

Link to Article: https://towardsdatascience.com/creating-various-plot-types-and-subplots-with-plotly-bd727f808262

Notebook: plotly-charts.ipynb


python-science-tutorial's People

Contributors

naveenv92 avatar

Recommend Projects

  • React photo React

    A declarative, efficient, and flexible JavaScript library for building user interfaces.

  • Vue.js photo Vue.js

    ๐Ÿ–– Vue.js is a progressive, incrementally-adoptable JavaScript framework for building UI on the web.

  • Typescript photo Typescript

    TypeScript is a superset of JavaScript that compiles to clean JavaScript output.

  • TensorFlow photo TensorFlow

    An Open Source Machine Learning Framework for Everyone

  • Django photo Django

    The Web framework for perfectionists with deadlines.

  • D3 photo D3

    Bring data to life with SVG, Canvas and HTML. ๐Ÿ“Š๐Ÿ“ˆ๐ŸŽ‰

Recommend Topics

  • javascript

    JavaScript (JS) is a lightweight interpreted programming language with first-class functions.

  • web

    Some thing interesting about web. New door for the world.

  • server

    A server is a program made to process requests and deliver data to clients.

  • Machine learning

    Machine learning is a way of modeling and interpreting data that allows a piece of software to respond intelligently.

  • Game

    Some thing interesting about game, make everyone happy.

Recommend Org

  • Facebook photo Facebook

    We are working to build community through open source technology. NB: members must have two-factor auth.

  • Microsoft photo Microsoft

    Open source projects and samples from Microsoft.

  • Google photo Google

    Google โค๏ธ Open Source for everyone.

  • D3 photo D3

    Data-Driven Documents codes.