You've been tasked with analyzing the company's financial and user data in clever ways to make the company grow. You’ll produce a Jupyter notebook that contains your data preparation, analysis, and visualizations for all the time series data that the company needs to understand.
- Technologies
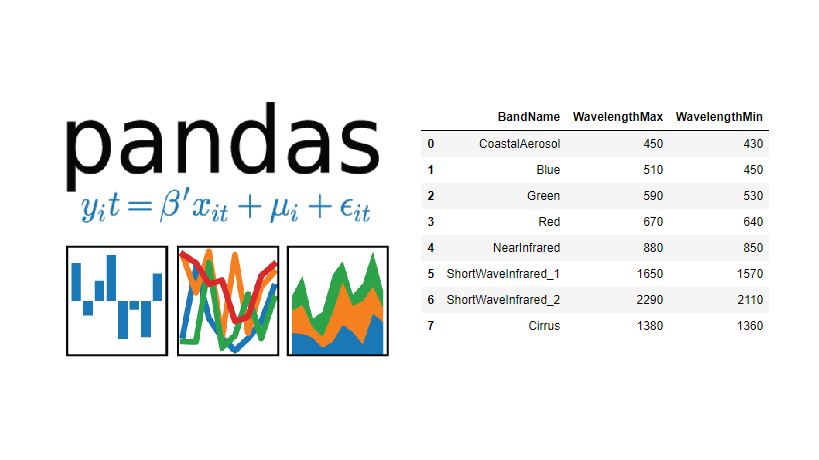
-Our primary focus in this module was the Facebook Open Source library Prophet. And as Always our friend Pandas
We used Pandas
Importing the data. Creating dataframes with Pandas methods. Using Pandas methods on our dataframes.
# Create a new column in the mercado_stock_trends_df DataFrame called Stock Volatility
# This column should calculate the standard deviation of the closing stock price return data over a 4 period rolling window
mercado_stock_trends_df_con['Stock Volatility'] = mercado_stock_trends_df_con['close'].pct_change().dropna().rolling(window=4).std()


mercado_stock_trends_df_con
https://pandas.pydata.org/ Package overview pandas is a Python package providing fast, flexible, and expressive data structures designed to make working with “relational” or “labeled” data both easy and intuitive. It aims to be the fundamental high-level building block for doing practical, real-world data analysis in Python. Additionally, it has the broader goal of becoming the most powerful and flexible open source data analysis/manipulation tool available in any language. It is already well on its way toward this goal.
Prophet is a procedure for forecasting time series data based on an additive model where non-linear trends are fit with yearly, weekly, and daily seasonality, plus holiday effects. It works best with time series that have strong seasonal effects and several seasons of historical data. Prophet is robust to missing data and shifts in the trend, and typically handles outliers well.


- hvplot example
# Set the index in the forecast_mercado_trends DataFrame to the ds datetime column
forecast_mercado_trends = forecast_mercado_trends.reset_index().set_index(['ds'])
# YOUR CODE HERE

# View the only the yhat,yhat_lower and yhat_upper columns from the DataFrame
# YOUR CODE HERE
forecast_mercado_trends_plot = forecast_mercado_trends[['yhat','yhat_lower','yhat_upper']]
forecast_mercado_trends_plot.hvplot(
                   width=900,
                   height = 500,
                   grid=True,
                   title='The [yhat],[yhat_lower] and [yhat_upper] columns from the DataFrame',
                   fontscale=1.3)
- Prophet example
from fbprophet import Prophet
from fbprophet.plot import plot
from fbprophet.plot import plot_plotly, plot_components_plotly

# Call the Prophet function, store as an object
model_mercado_trends = Prophet()

# Fit the time-series model.
# YOUR CODE HERE
model_mercado_trends.fit(mercado_prophet_df)

# Create a future dataframe to hold predictions
# Make the prediction go out as far as 2000 hours (approx 80 days)
future_mercado_trends = model_mercado_trends.make_future_dataframe(periods=2000, freq='H')
# YOUR CODE HERE

# View the last five rows of the future_mercado_trends DataFrame
# YOUR CODE HERE
future_mercado_trends.tail()
This is a open source project take it and improve it 10000 X