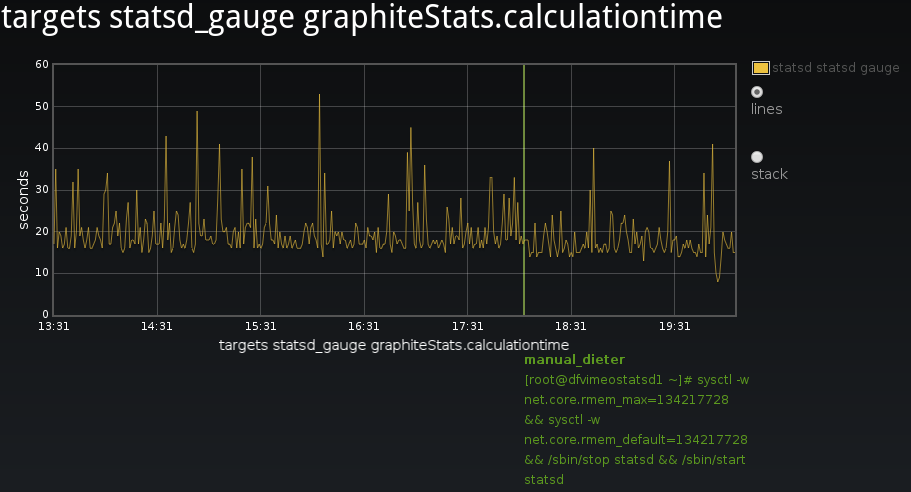
Plugin to easily make highly interactive time series (graphite) graph objects. (i.e. graphs where you can interactively toggle on/off individual series, inspect datapoints, zoom in realtime, etc) Supports Flot (canvas), Rickshaw (svg), Highcharts (svg) and standard graphite png images (in case you're nostalgic and don't like interactivity)
Goals:
- easy to use, elegant but powerful api, aimed to cover all your graphite/time series graphing needs.
- only abstract where it makes sense. Graphite, Flot, Highcharts and Rickshaw api's are awesome and powerfull, expose them
- aim for some consistency in configuration across backends (to the extent possible and sane)
- be very similar/compatible to the existing graphite API (but extended for interactivity features)
- provide all interactive features you would expect; so that all graphite dashboards can rely on the same code to render client-side graphs, minimizing redundant work and combining efforts.
Feature comparison table. NA = not available (can't be done to my knowledge), WIP = work in progress (should be possible. this basically means TODO)
| PNG | Flot | Rickshaw | Highcharts | |
|---|---|---|---|---|
| description | Static PNG images rendered by graphite server | Interactive client-side rendering using canvas | Interactive client-side rendering using SVG | Interactive client-side rendering using SVG |
| speed | quite fast | quite fast. interactive features near-realtime | slow with many datapoints and/or multiple graphs (needs better graphite consolidation) | TODO |
| hover over datapoints/graph -> popup with exact data | NA | Y (flot #867 would make it a bit better) | Y | Y |
| events with annotations (using anthracite) | NA | Y | WIP | N |
| interactive zooming | NA | Y | WIP | Y |
| interactive panning | NA | WIP | WIP | N |
| hover over legend -> hilight on plot | NA | WIP | Y | Y |
| reordering items in legend to reorder on stacked plot | NA | WIP | Y | TODO |
| toggling targets on/off | NA | WIP (flot pull 848, flot pull 869, branch flot-legend-toggle) | Y | Y |
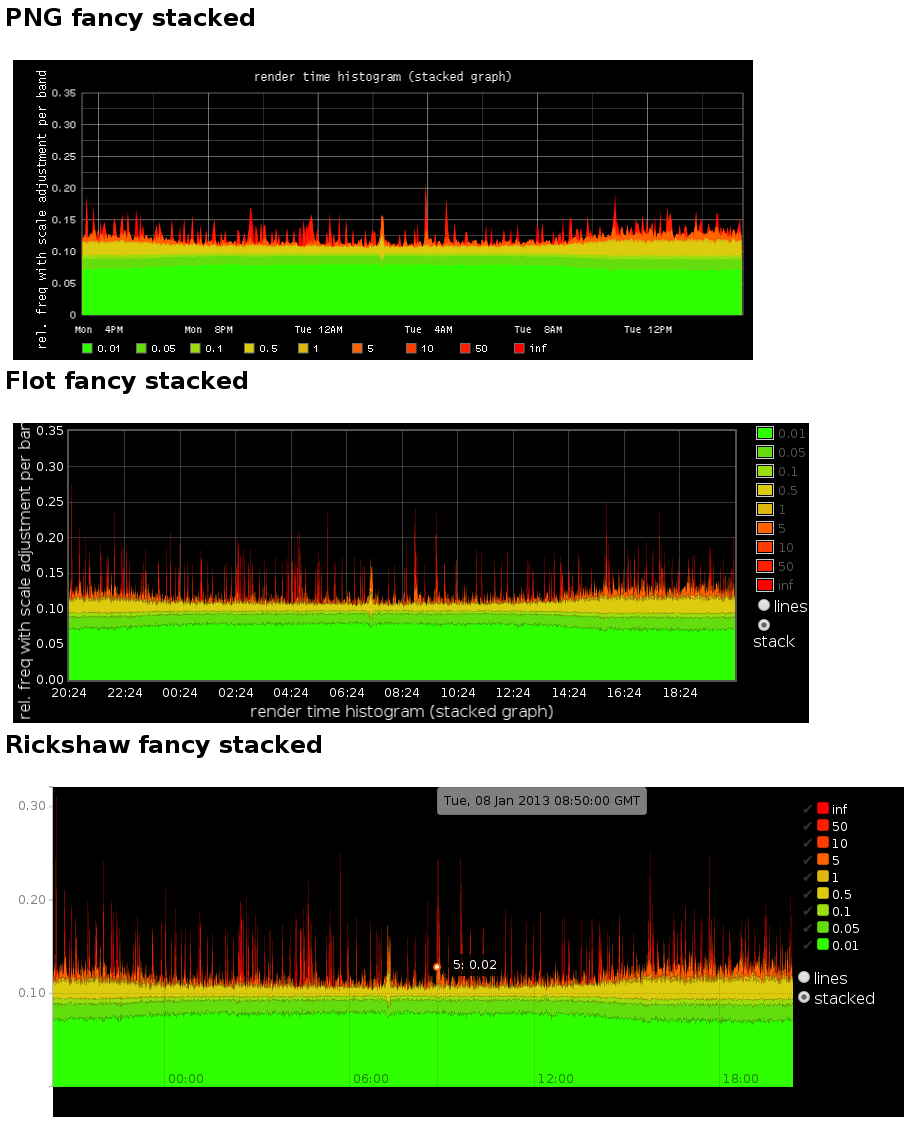
| toggling between line vs stack (band) mode | NA | Y | Y | Y |
| auto smoothing dense graphs based on datapoints/pixel | NA | NA | WIP | Y |
| notes | 1999 called. they want their static images back. you could actually implement interactive features with a JS layer on top. (and some monitoring dashboards do this) but that is/would be soo slow) |
doesn't treat null values very well. the code has to remove them, but if you use multiple targets and one of them has a lot of nulls (and hence removed datapoints) the graph display will break, so you have to use drawNullAsZero to avoid that | more "generic" (based on D3), all data is accessible in DOM and themeable with CSS | Licensing: Free for non commercial (http://www.highcharts.com/license) |
any web code that can generate graphite urls can use this library with minimal transition work
- git clone into directory that will be available over http
- git submodule update --init
- include the needed css/js depending on your needs; see example files
you'll need a small tweak to allow this app to request data from graphite. (we could use jsonp, but see obfuscurity/tasseo#27) For apache2 this works:
Header set Access-Control-Allow-Origin "*"
Header set Access-Control-Allow-Methods "GET, OPTIONS"
Header set Access-Control-Allow-Headers "origin, authorization, accept"
note: for timezone support, include timezone-js/src/date.js, Set the 'zoneFileBasePath' option to the url path needed to reach the included tz folder, and of course set the 'tz' parameter to your timezone. Note if you load files straight from disk (such as the examples), you might see errors like "XMLHttpRequest cannot load file://(...)/timeserieswidget/tz/northamerica. Origin null is not allowed by Access-Control-Allow-Origin.". This is a CORS restriction, see http://stackoverflow.com/questions/3595515/xmlhttprequest-error-origin-null-is-not-allowed-by-access-control-allow-origin
A lot can be learned by just looking at, and playing with the examples, so check the examples directory
The examples are designed so that:
- there's a js file per backend (png, flot, rickshaw), per graph (a simple and fancy one).
- the simple graph is minimal and line-based, the fancy is area-based and demos most available options.
- in a definition, we put (by convention) all common options first, backend-specific things afterwards.
- there's an html file (6 in total) to show each graph (2) of each backend (3)
- graph-compare.html includes all 6 on one page.
- the html and js files are written so you can easily diff them.
Obviously you'll probably need to adjust the targets to make the examples work with your graphite server.
In general, we try to use the same options for all backends (i.e. make the flot/rickshaw backends respond to the same options as the graphite png api) So for the most part, the available options (see examples) closely match the available options from the graphite api Sometimes this is not possible.
- instead of
target=<foo>&target=<bar>(...)we define atargetslist option - in target definitions:
- don't use
alias()orcolor(), we have alternatives ('name' and 'color' options) - don't use
colorList, i didn't even look into how to port this feature to flot/rickshaw cause you can easily avoid it
- don't use
options that only apply to graphite's native png renders:
colors, areaMode, legends, etc
options that apply to both flot and rickshaw: when a tswidget feature can't be implemented in flot/rickshaw directly, tswidget provides the code, and it works with either the flot or rickshaw backend.
'suffixes': false, 'binary' or 'si' (defaults to 'si')
automatically show large numbers using a prefix. like graphite does, but configurable
events_url     http://elasticsearch-machine:9200/index/_search (set this to enable events)
anthracite_url http://anthracite-machine/events/view (optional)
events_query   (optional. defaults to '*' (all docs). '' means no docs)
show events from Elasticsearch (via anthracite, logstash or others). Using the events_query you can narrow it down. The query format is explained here. anthracite_url enables view/edit links to view/edit anthracite events.
line_stack_toggle: 'line_stack_form_flot',
state: 'stacked',
DOM id for line/stack selector form, and initial state
hover_details
hover with mouse over graph datapoints to yield popups with information (series and X/Y values) about nearest datapoint
when a tswidget feature maps directly to a native flot feature, or it doesn't work with rickshaw or just any option in the flot api (legend, grid, ...)
you can set on_click to a callback that will be called when you click on a plot
when a tswidget feature maps directly to a native rickshaw feature, or it doesn't work with flot or just any option in the rickshaw api
(works across all backends)
$.fn.graphite.defaults.width = "450"
$.fn.graphite.defaults.height = "300"(only for png backend)
$.fn.graphite.update($("#graph"), {from: "-3days", lineWidth: "2"});short story: use rgb codes like '#1088ef', to be compatible with all 3 (graphite/flot/rickshaw). or find something else that works with all three and update this.
for targets but presumably other things as well:
- graphite supports color names like 'green' and hexadecimal RGB codes like '#1088ef'
- flot generally uses names or CSS color specifications like "rgb(255, 100, 123)" or '#1088ef', or an integer that specifies which of auto-generated colors to select, e.g. 0 will get color no. 0 it unofficially supports color codes (without '#') but only in line mode.
- rickshaw supports a few things, but for hex codes, it requires the '#'
- may set or override flot/rickshaw-specific options (such as grid, legend, ...) if you've set them. this should rarely be a problem, consult the code and grep for the feature if you want to know more.


