Giter Site home page Giter Site logo

gf's Introduction

gf โ€“ A GDB Frontend

Build status

Screenshot of the debugger's interface, showing the source view, breakpoints list, call stack, bitmap viewer, and command prompt. Another screenshot, showing the watch window and different color scheme. Another screenshot, showing the disassembly and register windows.

Building

Download this project's source.

git clone https://github.com/nakst/gf.git

And compile the application.

# linux
./build.sh

# freebsd
./build_freebsd.sh

# netbsd
./build_netbsd.sh

# openbsd
./build_openbsd.sh

Please read the rest of this file to learn about using and configuring gf. If you're new to GDB, see this article.

If you want to make a debug build of gf, use a command like g++ gf2.cpp -g -lX11 -pthread.

Tips

  • You can run the application with ./gf2. Any additional command line arguments passed to gf will be forwarded to GDB.
  • Press Ctrl+Shift+P to synchronize your working directory with GDB after you start your target executable. This is necessary if you open
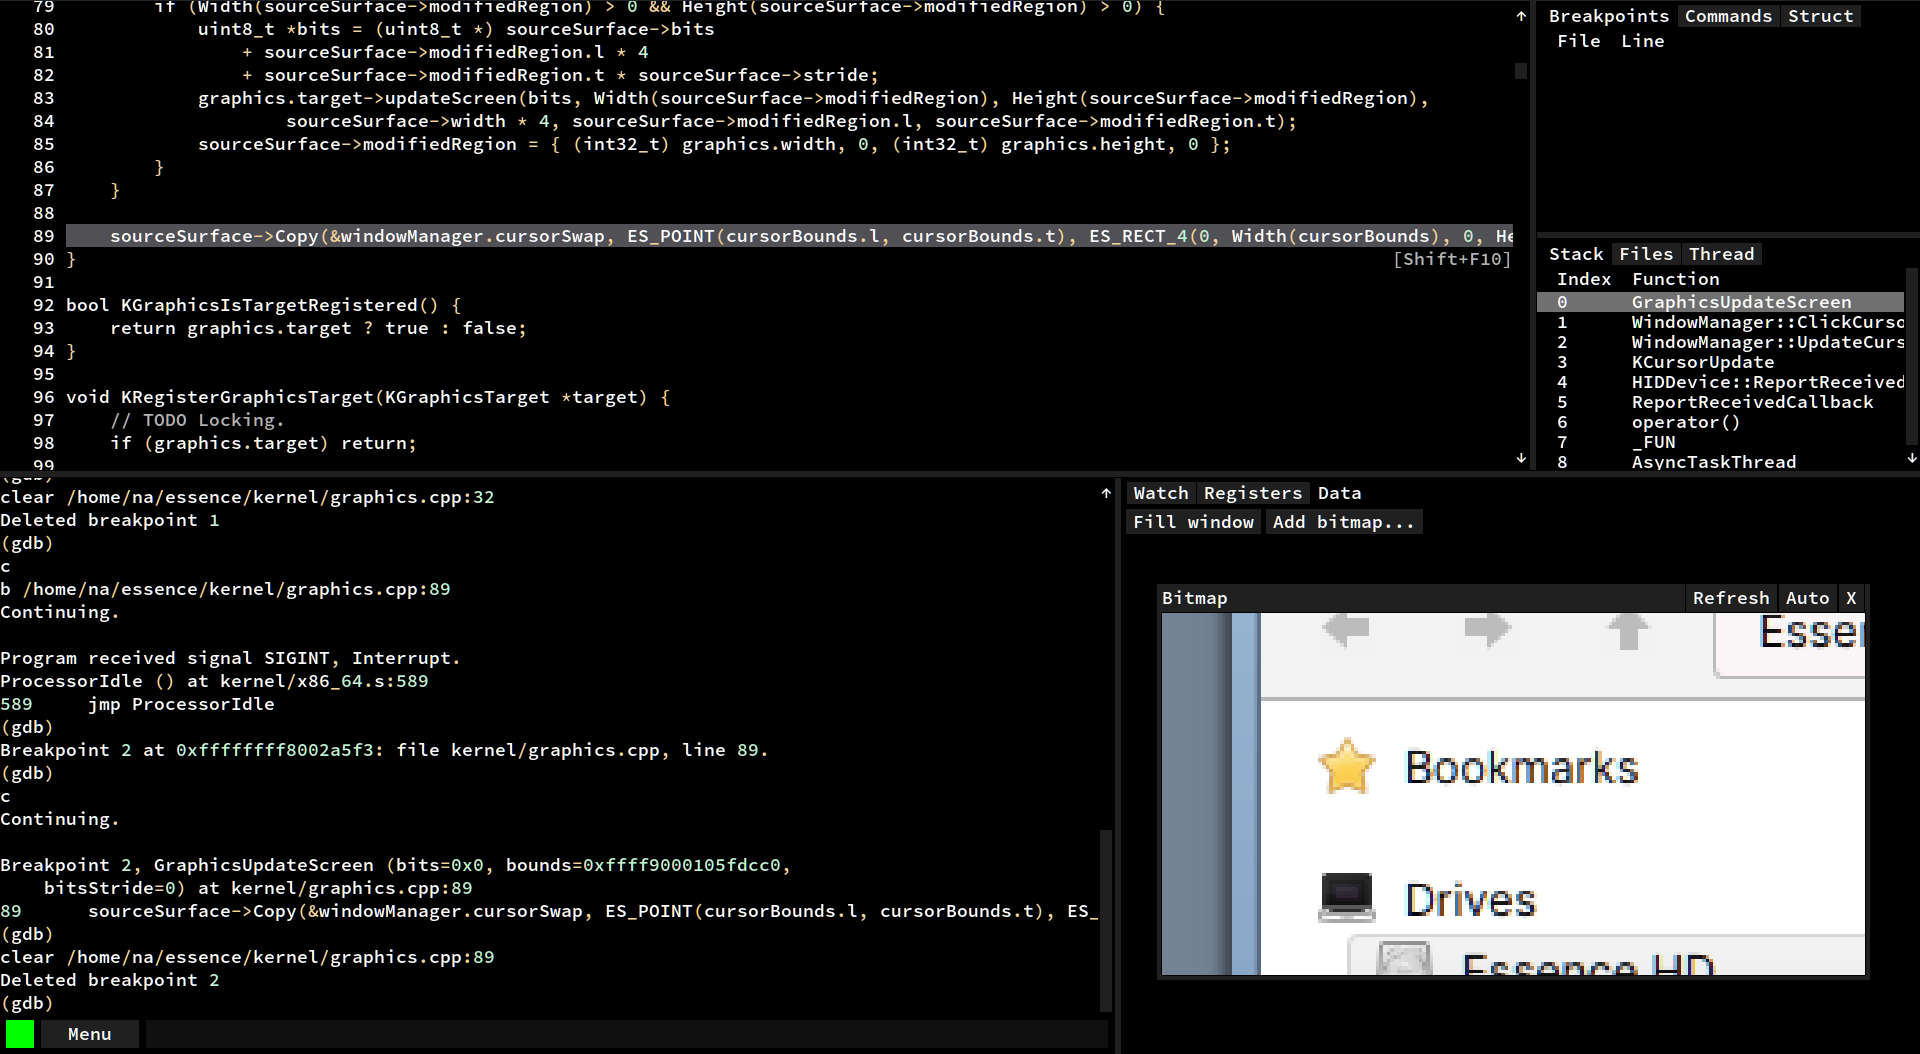
 gf in a different directory to the one you compile in.
  • To view RGBA bitmaps, select the Data tab and then select Add bitmap....
  • Ctrl+Click a line in the source view to run "until" that line. Shift+Click a line in the source view to skip to it without executing the code in between.
  • Press Shift+F10 to step out of a block, and press Shift+F11 to step out a function.
  • Press Tab while entering a watch expression to auto-complete it.
  • Press / with a watch expression highlighted to change the format specifier. For example, /x switches to hexadecimal view.
  • Press backtick to enter line inspect mode. This mode evaluates all expressions on the current line.
  • Use gf2 --rr-replay for replaying a trace recorded by rr. Use Ctrl+Shift+(F5/F10/F11) for reverse continue and step.

You may want to add the following commands to your ~/.gdbinit file:

set breakpoint pending on
set disassembly-flavor intel

Settings

On startup, settings are loaded from ~/.config/gf2_config.ini, followed by .project.gf. This is an INI-style file.

GDB configuration

You can pass additional arguments to GDB in the [gdb] section. For example,

[gdb]
arguments=-nx -ex record

You can also change the location of the GDB executable. For example,

[gdb]
path=/home/a/opt/gdb

You can direct all output from GDB to be sent to the "Log" window, if you have one in your layout string. This will work even if you haven't setup a log pipe. This can be used to view the stderr output from your target dynamically as it is running.

[gdb]
log_all_output=1

You can disable the confirmation dialogs for the kill (F3) and connect (F4) commands.

[gdb]
confirm_command_kill=0
confirm_command_connect=0

You can limit the number of stack frames in the stack window (the default is 50).

[gdb]
backtrace_count_limit=50

Custom keyboard shortcuts

Keyboard shortcuts are placed in the [shortcuts] section. For example,

[shortcuts]
Ctrl+I=print i
Ctrl+Shift+F10=reverse-next
Ctrl+Shift+F11=reverse-step

You can use any standard GDB command, or any of the commands listed in "Special commands" below.

User interface

You can change the font and user interface scaling in the [ui] section. For example,

[ui]
scale=1.5
font_path=/usr/share/fonts/TTF/DejaVuSansMono.ttf
font_size_interface=17
font_size_code=20

To change the font, FreeType must have been available when you compiled gf. You can enable subpixel font rendering by recompiling with extra_flags=-DUI_FREETYPE_SUBPIXEL ./build.sh.

You can also configure the interface layout, with the layout parameter. Use h(position,left,right) to create a horizontal split, v(position,left,right) to create a vertical split, and t(...) to create a tab pane. This value should not contain any whitespace. Please note this value is not validated, so make sure it is formatted correctly!

layout=h(75,v(75,Source,Console),v(50,t(Watch,Breakpoints,Commands,Struct,Exe),t(Stack,Files,Registers,Data,Thread))))

NB: Horizontal and vertical splits must have exactly two children. Instead, you can nest them to create more complex layouts.

You can maximize the window at startup with maximize=1.

You can request for the expressions in the watch window to be saved and restored by setting restore_watch_window=1.

You can allow selecting text in the source window by setting selectable_source=1.

Themes

You can change the theme in the theme section. See https://github.com/nakst/gf/wiki/Themes for a list of examples.

Preset commands

You can create a list of quickly accessible commands, available in the "Commands" tab in the UI. Separate individual commands using a semicolon. Each command in the list is run one after another; to run the final command asynchronously, put a & at the end. For example,

[commands]
Compile=shell gcc -o bin/app src/main.c
Run normal=file bin/app;run&
Run tests=file bin/app;run test_cases.txt&
Set breakpoints=b main;b LoadFile;b AssertionFailure

You can use any standard GDB command, or any of the commands listed in "Special commands" below.

Vim integration

You can change the server name with the server_name key in the vim section. For example,

[vim]
server_name=MyVimServer

Control pipe

You can change the loaded file and line by sending commands to the control pipe.

First, you must set the location of the control pipe. In the [pipe] section of the configuration file, set the control key to the absolute path where you want the control pipe to be.

Then, you can send commands to the pipe. For example,

# Load the specified file (must be a full path).
echo f /home/a/test.c > /home/a/control_pipe.dat

# Go to line 123.
echo l 123 > /home/a/control_pipe.dat

# Send a GDB command.
echo c file myapp > /home/a/control_pipe.dat

This can be used for text editor integration.

Log window

You can show messages send to a pipe using the log window.

First, you must set the location of the log pipe. In the [pipe] section of the configuration file, set the log key to the absolute path where you want the log pipe to be. Next, you must add the "Log" window somewhere in your layout string (see the "User interface" section above). Once configured, you can then send messages to the pipe and they will appear in the log window.

Here is an example of how to send messages to the pipe:

#define LOG(...) do { fprintf(logFile, __VA_ARGS__); fflush(logFile); } while (0)
#define LOG_OPEN(path) logFile = fopen(path, "w")
FILE *logFile;

...

LOG_OPEN("...");
LOG("Hello, world!\n");

Special commands

gf-step

gf-step either steps a single line (step) or single instruction (stepi), depending whether disassembly view is active.

gf-next

gf-next either steps over a single line (next) or single instruction (nexti), depending whether disassembly view is active.

gf-step-out-of-block

gf-step-out-of-block steps out of the current block. That is, it steps to the next line after the first unmatched }, starting from the current line.

gf-restart-gdb

gf-restart-gdb restarts the GDB process immediately. Any state such as loaded symbol files or breakpoints will be lost.

gf-get-pwd

gf-get-pwd asks GDB for the working directory in which the current executable file was compiled. This ensures the source view tries to load files from the correct directory.

gf-switch-to

gf-switch-to <window-name> switches to a specific window. The window names are the same as given in the layout string, as seen in the "User interface" section.

gf-command

gf-command <name> runs the command(s) corresponding to <name> in the [commands] section of your configuration file.

gf-inspect-line

gf-inspect-line toggles inspect line mode. By default, this is bound to the backtick key.

Watch window hooks

You can customize the behaviour of the watch window when displaying specific types using Python. When the watch window wants to display the fields of a value, it will look a hook function at gf_hooks[type_of_value]. The hook function should take two arguments, item and field. If the hook function exists, it will be called in one of two ways:

  1. When the watch window needs a list of the fields in the value, it calls the hook with item set to an opaque handle and field set to None. You should print out a list of all the names of the fields in the value, one on each line. You can print out all the standard fields by calling _gf_fields_recurse(item). When adding custom fields, their names must be enclosed by [].
  2. When the watch window needs to get the value of a specific custom field in the value, it calls the hook with item set to a gdb.Value for the value, and field to the name of the custom field that was added. The hook is not called for standard fields. You should return a gdb.Value that gives the value of the field.

For example, the following hook add a width and height custom field for a rectangle type.

def RectangleHook(item, field):
    if field:
        if field == '[width]':  
            # item['...'] looks up a field in the struct, returned as a gdb.Value
            # int(...) converts the gdb.Value to an int so we can do arithmetic on it
            # gdb.Value(...) converts the result back to a gdb.Value
            return gdb.Value(int(item['right']) - item['left'])
        if field == '[height]': 
            # do something similar for the height
            return gdb.Value(int(item['bottom']) - item['top'])
    else:
        print('[width]')         # add the width custom field
        print('[height]')        # add the height custom field
        _gf_fields_recurse(item) # add the fields actually in the struct

gf_hooks = { 'Rectangle': RectangleHook } # create the hook dictionary

If you want to create a custom dynamic array type, instead of printing field names, print (d_arr) followed by the number of array items. The fields will then be automatically populated in the form of [%d], where %d is the index. For example, given the following structure:

struct MyArray {
	int length;
	float *items;
};

This is the hook definition:

def MyArrayHook(item, field):
	if field: return item['items'][int(field[1:-1])]
	else: print('(d_arr)', int(item['length']))

Templates are removed from the name of the type. For example, Array<int>, Array<char *> and Array<float> would all use the Array hook.

Plugins

There is a simple plugin system. Make a file called plugins.cpp in the source code folder. It will be found automatically, and #included in the compilation of the main translation unit.

gf uses the Luigi UI library. It is documented here: https://github.com/nakst/luigi/blob/main/README.md.

You can register new windows, command and data viewers in a constructor function. For example,

__attribute__((constructor)) 
void MyPluginRegister() {
	interfaceWindows.Add({ 
		"Hello", // The window's name. Used to match it against the UI layout string.
		MyPluginHelloWindowCreate, // The callback to create an instance of the window.
		MyPluginHelloWindowUpdate // The callback to update an instance of the window (called every time the target pauses/steps).
	});

	interfaceDataViewers.Add({ 
		"Add test...", // The label of the button to show in the Data tab.
		MyPluginTestViewerCreate // The callback to create the data viewer.
	});

	interfaceCommands.Add({ 
		"My command", // The label to show in the application menu.
		{ /* UIShortcut */ } 
	});
}

The interface window creation callback is passed the parent UIElement and should return the UIElement it creates.

UIElement *MyPluginHelloWindowCreate(UIElement *parent) {
	UIPanel *panel = UIPanelCreate(parent, UI_PANEL_GRAY | UI_PANEL_EXPAND);
	UILabelCreate(&panel->e, 0, "Hello, world!", -1);
	return &panel->e;
}

The interface window update callback is passed the output of GDB from the most recent step, and the UIElement returned by the creation callback.

void MyPluginHelloWindowUpdate(const char *gdbOutput, UIElement *element) {
	// TODO Update the window.
}

The interface data viewer creation callback should create a MDI child of the data tab as follows:

void MyPluginTestViewerCreate(void *unused) {
	UIMDIChild *window = UIMDIChildCreate(&dataWindow->e, UI_MDI_CHILD_CLOSE_BUTTON, UI_RECT_1(0), "Title", -1);
	// TODO Configure the viewer.
	UIElementRefresh(&dataWindow->e);
}

For communicating with GDB, there are the following functions.

// Evaluate an expression. The result is overwritten between calls!
const char *EvaluateExpression(const char *expression, const char *format = nullptr);

// Send and run a command in GDB. Set `echo` to log the command in the console window. 
// If `synchronous` is set the function will wait for the command to complete before it returns.
void DebuggerSend(const char *string, bool echo, bool synchronous);

There are many examples of how to do these things in windows.cpp.

Contributors

nakst
Philippe Mongeau phmongeau 
Jimmy "Keeba" Lefevre JimmyLefevre 
John Blat johnblat64 
IWouldRatherUsePasteBin
Gavin Beatty gavinbeatty
Michael Stopa StomyPX
Anders Kaare sqaxomonophonen
Arseniy Khvorov khvorov45

Extension pack

A screenshot showing the embedded profiler, which is displaying a multi-colored flame graph. A screenshot showing the memory window and extended watch expression view.

~~All tiers on my Patreon, https://www.patreon.com/nakst, get access to the extension pack. ~~

This is now available to all; see the folder extensions_v5.

This currently includes:

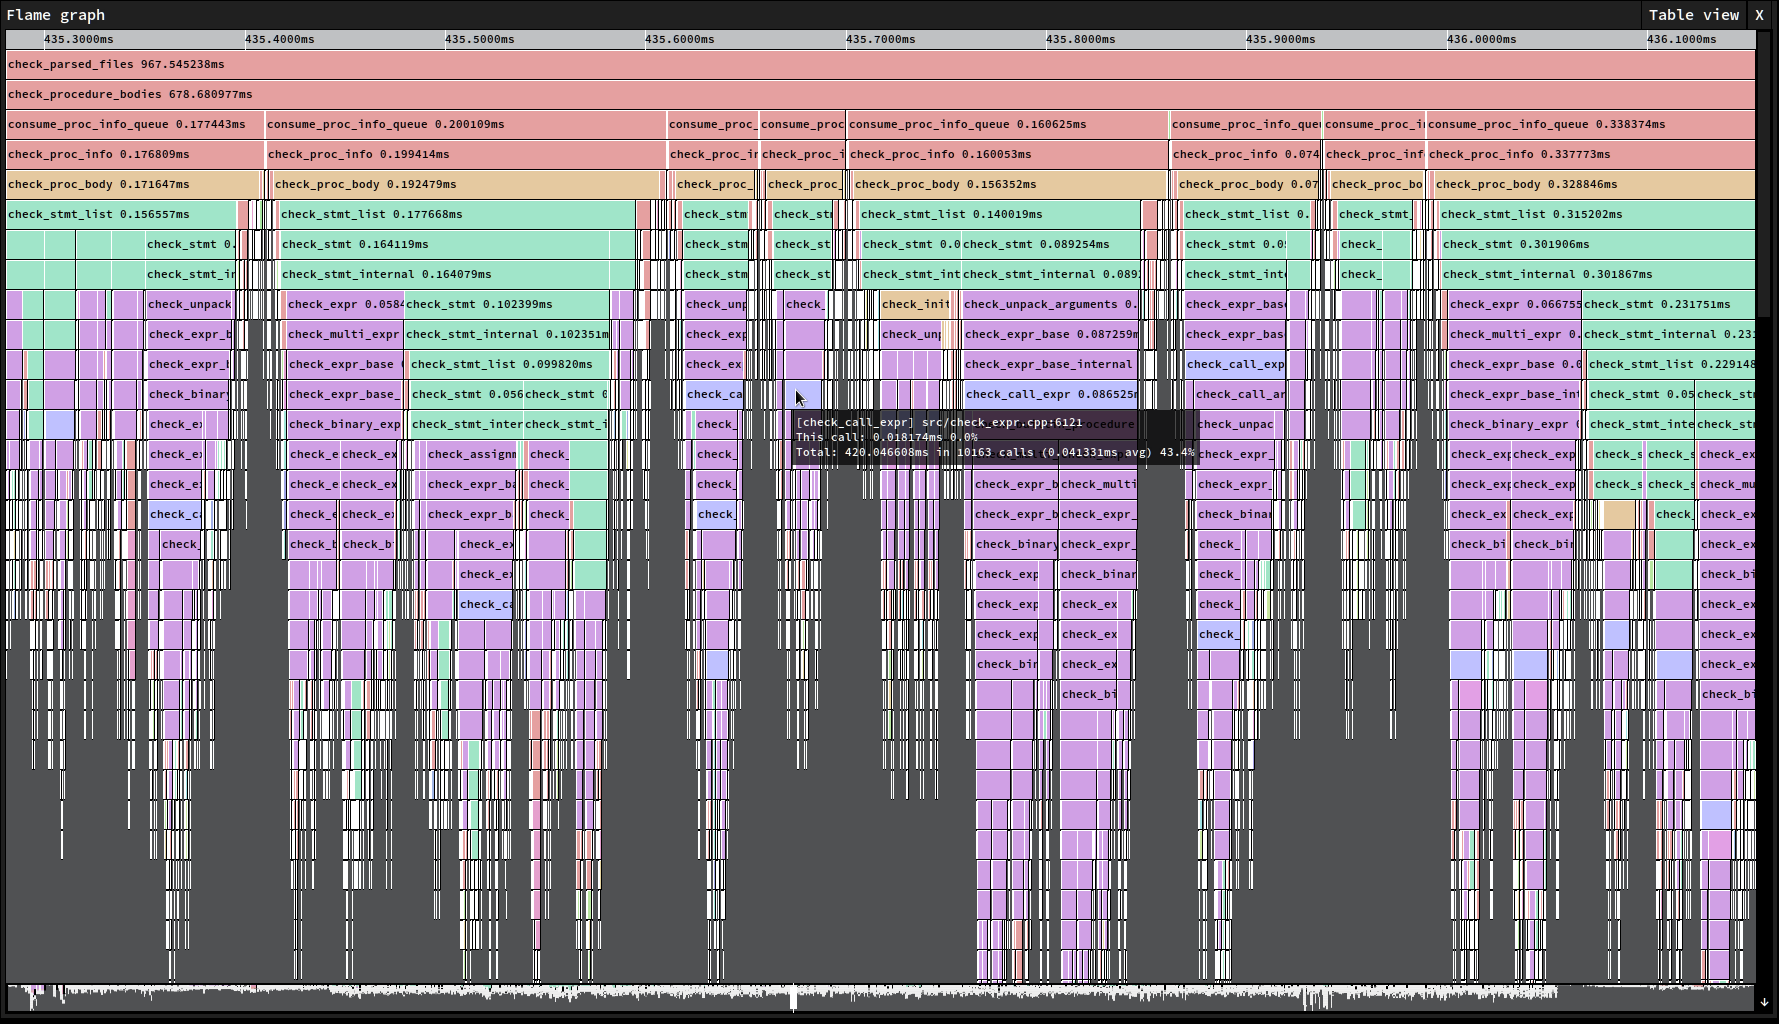
  • Embedded tracing profiler
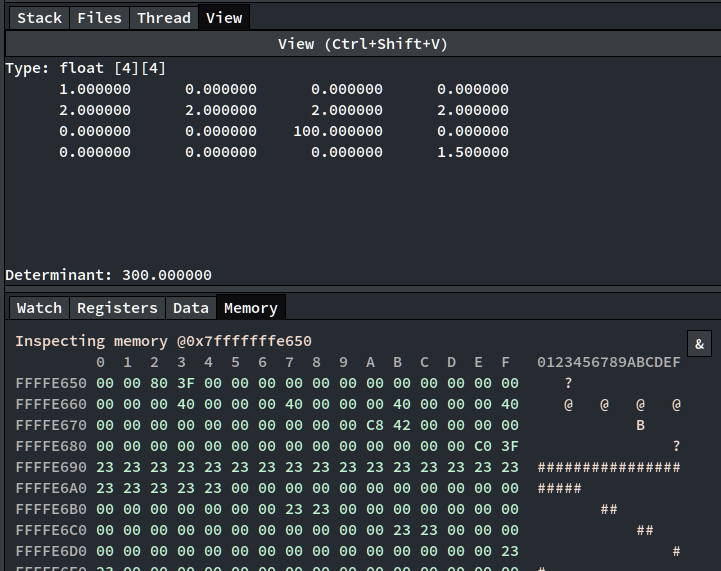
  • Memory window
  • Extended watch expression view (for strings, matrices and base conversion)
  • Waveform viewer
  • Full source code for the pack

Make sure you use the latest version of the extension pack with the latest commit of gf, otherwise you'll likely run into compile or runtime errors!

gf's People

Contributors

cenomla avatar f0rget-the-sad avatar gavinbeatty avatar harsh04081997 avatar hrzlgnm avatar hsnyder avatar iwouldratherusepastebin avatar khvorov45 avatar lefp avatar lionkor avatar mastensg avatar nakst avatar rexim avatar rilysh avatar rsachetto avatar s4my avatar skippuku avatar sqaxomonophonen avatar stomypx avatar thimc avatar

Stargazers

 avatar  avatar  avatar  avatar  avatar  avatar  avatar  avatar  avatar  avatar  avatar  avatar  avatar  avatar  avatar  avatar  avatar  avatar  avatar  avatar  avatar  avatar  avatar  avatar  avatar  avatar  avatar  avatar  avatar  avatar  avatar  avatar  avatar  avatar  avatar  avatar  avatar  avatar  avatar  avatar  avatar  avatar  avatar  avatar  avatar  avatar  avatar  avatar  avatar  avatar  avatar  avatar  avatar  avatar  avatar  avatar  avatar  avatar  avatar  avatar  avatar  avatar  avatar  avatar  avatar  avatar  avatar  avatar  avatar  avatar  avatar  avatar  avatar  avatar  avatar  avatar  avatar  avatar  avatar  avatar  avatar  avatar  avatar  avatar  avatar  avatar  avatar  avatar  avatar  avatar  avatar  avatar  avatar  avatar  avatar  avatar  avatar  avatar  avatar  avatar

Watchers

 avatar  avatar  avatar  avatar  avatar  avatar  avatar  avatar  avatar  avatar  avatar  avatar  avatar  avatar  avatar  avatar  avatar  avatar  avatar  avatar

gf's Issues

An optional simple workflow for loading an executable

While there are use cases for switching symbols in the middle of the debugging session, the "simple man" usage of the debugger usually invovles debugging one executable at a time with one symbol file at a time. As it stands now, the following set of commands is needed to start a debugging session at main:

file       // load the executable
set args   // set the arguments
start      // launch the executable paused so that gf can get access to the pwd
gf-get-pwd // set the pwd
start      // start debugging for real

While the manual control is good for some use cases, I would certainly prefer something simpler. Maybe a simple dialog to create a "run configuration", which adds the above sequence of commands to the config?

Problems with the path to the source files

I'm running the gf2 with arm-none-eabi-gdb-py and gf2 has problems establishing proper paths to the source files.

So the project dir is /home/mc/gits/paw-usb/, the source dir is /home/mc/gits/paw-usb/src and all the compilation happens through the Makefile that lives in /home/mc/gits/paw-usb/src.

I've changed DisplaySetPosition, this line:

gf/windows.cpp

Line 65 in 9996fed

StringFormat(buffer3, 4096, "The file '%s' (from '%s') could not be loaded.", file, originalFile);

I've changed the originalFile to currentFileFull, just for debug purposes, and it prints /home/mc/gits/paw-usb/main.c path. It's missing the src/ part. The full message is:

The file 'main.c' (from '/home/mc/gits/paw-usb/main.c') could not be loaded.

Detect commands accidentally entered into watch window

Occasionally I find myself accidentally typing a command intended for the command textbox into the watch window by mistake. I think certain common commands could be detected and be automatically entered into the command textbox instead.

If you have any common commands you want added to this list, please reply to this thread.

  • b <function name>
  • b <line number>
  • file <symbol file>

Visual feedback for hovered source line

I've recently been had a debugging session where "set next statement" and "run to cursor" where used frequently. It would be really useful if the hovered line was highlighted or indicated in some other way.

Display won't update until a gdb command is inputted when running async commands

whenever I run the async commands (r&, and c&) and either a breakpoint, assert, segfault, etc. is hit nothing gets displayed until I issue any random command to gdb

here's me running the program with r& and hitting a breakpoint but no info being displayed
image

but if I give gdb a command (in this case the gibberish "shoq" to show it doesn't matter what is inputted)
image

Make appimage

Many Linux distributions don't seem to come with a nice way to install the latest version of wxWidgets. An appimage https://appimage.org/ would allow more people to use the program.

g++ 7.5.0 build error

Decided to try this one out but couldn't get passed ./build.sh step. Compiler flags the C99 designator expressions as error, a feature that is only available in C++20. I assume later versions of g++ has this implemented as a non-standard extension.

The locations of the errors are windows.cpp:2332:46 and gf2.cpp:1092:1 with compilation error "sorry, unimplemented: non-trivial designated initializers not supported"

What is the minimum compiler version required?

Format specifiers for the watch window

First of all, the watch window is working great, thank you!

Now, currently if I need to view the value in hex or in binary, I'm forced to use the Console window. It's alright for one-off prints, but if I want to watch the value, it quickly becomes unusable (you probably know what I mean: try having more than a few display-ed structs in gdb). This calls for passing format specifiers (/x, /t) to gdb somehow. As far as I know, this is usually done using the , operator: my_val, x is translated to p/x my_val. But this includes parsing the expression, so be vary! Maybe just a context menu on the values (show in hex, show in binary)?

Step to here

Repeatedly run the "step over" command until the given line is reached. Record the value of every watch expression at each step. Provide methods of viewing the changes to each expression, and the path the instruction pointer took.

Source window scrolling performance

The source window scrolling is noticeably below 60fps. Doesn't seem to be freetype related, as it's laggy both with- and without enabling freetype.

Bit calculator

Interactive bit editor/calculator. Show result in base 10, 16 and float. Similar to the programmer mode in the Windows 7 calculator.

Ability to pan and zoom bitmaps

As it is now, the bitmap window is already quite useful, but for inspecting small bitmaps (such as font glyphs) I usually need to screenshot them and open the screenshot in an image viewer. So an ability to zoom and pan would be greatly appreciated!

Spawn a terminal window for program output

As far as I know, gf currently does not show any output the debugee writes to stdout/stderr. Mixing it with gdbs own output in the Console window would be bad, I think. So, maybe spawn a terminal and redirect stdout/stderr of the debugee there? That's what VS does, IIRC. Or maybe Program output pane?

gdb process crashes when using the find window

Hi,

I've been playing with gf and I'm having a weird issue where the gdb process sometimes crashes when I use the find window.

Basic reproduction steps:

  1. launch gf
  2. load my program with file command
  3. b main
  4. r
  5. F10 a couple times
  6. open the find window with Ctrl-F, but focus back the main window without closing it
  7. gdb process crashes
  8. doing an F10 or sending any other gdb command stops working

I think the crash only happens if the find window looses focus before closing, but I'm not completely sure.

I'm using a tiling window manager and the find window doesn't act as a proper popup, so it's very easy to make it loose focus.

Let me know if you need more info

gdb_stacktrace.txt

Jump to active file on step

There is a bug with the newly introduced directory browser feature. If I select a file, but the execution point is currently in another file, then the gf tries to apply line numbers from one file to another.

For example:

  1. I step into main() in main.c (let's say it's on line 600)
  2. I switch to another file, say other.c
  3. I press F10 to step over one line
  4. gf tries to display other.c:601, intead of switching to main.c:601

I guess to fix this you have to keep track of two files: one which is selected by the user, and one which is dictated by the exection point. Then the first one is updated from the UI (directory browser), and the second one is updated by gdb. Most importantly, if gdb says that the file is different from the user-selected one, you should switch to it.

Switching between source files (tabs)

As it is now, gf only shows the current source file. This leaves the only one way of setting breakpoints in other files: using the gdb console. It's not that bad for a personal project with a dozen files, but becomes increasingly hard to do in larger projects, because you have to remember the filename. Tabs, as I understand, are already implemented in the UI framework (except for scrolling maybe).

You could use info sources to get the source paths.

Run configurations

My typical launch of gf goes like this:

  1. Open gf
  2. Type file /code/my/working/dir/exe-file in the gdb console
  3. Type start /code/my/working/dir/input-file in the gdb console

For one project with one never-changing argument this can easily be automated with a launch script along the lines:
gf2 /code/my/working/dir/exe-file --args /code/my/working/dir/input-file

However, after introducing multple executables with multiple argument combinations, the scripts are not going to help.
Traditionally, you would have some kind of a "run configuration", which specifies the path to the executable, the working directory, program arguments, and the environment variables. These configurations can be then selected from a list. On lauch, either no configuration is selected, or the last one is auto-loaded.

Having something along these lines would be great.

Arrays in the watch window have broken

Expanding any array variable in the watch window shows a python stack trace instead of the actual values:
image

The array preview is shown just fine though:
image

Performing 'ask GDB for PWD' breaks the bitmap viewer

I suspect it got something to do with the fact that the bitmap file is created using a relative path:

FILE *f = fopen(".bitmap.gf", "rb");
    
if (f) {
	fread(bits, 1, stride * height * 4, f);
	fclose(f);
	unlink(".bitmap.gf");
}

Segfault on start

The lastest commit broke something. I recompiled with -O0 -fsanitize and here's the ASAN output:

AddressSanitizer:DEADLYSIGNAL
=================================================================
==14879==ERROR: AddressSanitizer: SEGV on unknown address (pc 0x55e1cff14107 bp 0x7fff541e66e0 sp 0x7fff541e66c0 T0)
==14879==The signal is caused by a READ memory access.
==14879==Hint: this fault was caused by a dereference of a high value address (see register values below).  Dissassemble the provided pc to learn which register was used.
    #0 0x55e1cff14107 in SourceFindEndOfBlock() /home/aolo2/Documents/bin/gf/gf2.cpp:322
    #1 0x55e1cff18d61 in DisplaySetPosition /home/aolo2/Documents/bin/gf/windows.cpp:83
    #2 0x55e1cff2cd62 in WindowMessage(UIElement*, UIMessage, int, void*) /home/aolo2/Documents/bin/gf/gf2.cpp:1186
    #3 0x55e1cfee9bae in UIElementMessage /home/aolo2/Documents/bin/gf/luigi.h:1367
    #4 0x55e1cff105a6 in _UIProcessEvent /home/aolo2/Documents/bin/gf/luigi.h:4542
    #5 0x55e1cff126db in _UIMessageLoopSingle /home/aolo2/Documents/bin/gf/luigi.h:4696
    #6 0x55e1cff0bd51 in UIMessageLoop /home/aolo2/Documents/bin/gf/luigi.h:4207
    #7 0x55e1cff2dc09 in main /home/aolo2/Documents/bin/gf/gf2.cpp:1317
    #8 0x7eff93febd09 in __libc_start_main ../csu/libc-start.c:308
    #9 0x55e1cfee3959 in _start (/home/aolo2/Documents/bin/gf/gf2+0xc959)

AddressSanitizer can not provide additional info.
SUMMARY: AddressSanitizer: SEGV /home/aolo2/Documents/bin/gf/gf2.cpp:322 in SourceFindEndOfBlock()
==14879==ABORTING

p.s. congrats on 100 stars! :D

Debugging program that uses stdin

Is there a reasonable way yet to debug a process that outputs to stdout and reads input from stdin - not unlike an extremely basic ncurses?

I've been reading this #26 and the documentation on log-window, but it doesn't seem suitable for this use case.

Empty command to repeat previous command

This appears to not work correctly in gf - running an empty command seems to change something, but I can't put my finger on what.

After setting a breakpoint, it seems to throw some kind of syntax error:
image

ctx is the name of a local variable.

Here I did a few other things, trying an empty command after each one:
image

It is expected that it should simply repeat the last command I entered.

Using gdb 10.2 on Arch Linux. Let me know if there's any other info I can provide.

Menu button crashes

Hey nakst, I'm getting a crash on the latest version when I click the Menu button.

X Error of failed request:  BadValue (integer parameter out of range for operation)
  Major opcode of failed request:  1 (X_CreateWindow)
  Value in failed request:  0x0
  Serial number of failed request:  237
  Current serial number in output stream:  242

It seems to be caused by this change

I'm not sure what's the intended behavior here, but the docs says width and height should be nonzero:
https://www.x.org/releases/current/doc/libX11/libX11/libX11.html#XCreateWindow

Extended view for selected watch window

Shows extended information about the selected watch entry.
For example, a matrix viewer, text viewer, a bitmap viewer (should this replace the bitmap viewer in the data window?), etc.

Breakpoint indicator doesn't appear when adding a breakpoint to a file not currently being executed

Let's call the file, containing the current execution point "the currenty loaded file".

When I click on the line number to toggle a breakpoint, the part of the gutter around the line number should light up (in red, if using the "Dark" preset). This works only if adding a breakpoint in the currently loaded file. If I switch to another file, and add a breakpoint there, then the gutter doesn't show it until the file is loaded. The breakpoint is in fact added (I can see it in the gdb console), it's just the gutter that doesn't indicate that it is.

Repro:
1. Compile the attached files with debug symbols via gcc -g gf-repro.c -o whatever
2. Launch it in gf via gf2 ./whatever
3. Press ctrl+F5 to step into main
4. Add a breakpoint on line 6 (it works). Remove it
5. Using the Files pane switch to the file gf-repro-other.c and then back to gf-repro.c
6. Try to add a breakpoint again on line 6. This doesn't work

Update: switching to another file and then back makes it so that even the currently loaded file doesn't draw breakpoints correctly (until I do a step).

I'm not sure what causes the issue, but sometimes the gutter doesn't light up in red as it should.

Ability to text-edit the color values

I'm currently messing with the theme editor, trying to duplicate my code editor color scheme. However, the color values are editable only with the color wheel, which does not allow me to reproduce the colors exactly. The .gf_theme.dat file is also binary, so I can't edit it that way. Would be nice if the color values were editable as a regular text field, so that I could just copy-paste the color values.

Ignore users .gdbint file (or provide an option to do so)

As gdb is my primary debugger, I have quite a few options in my .gdbinit. Some of those options (tui new-layout, layout), however, are for working with the builtin TUI. Some others (dissasembly-flavor, print pretty) are useful in gf too.

IMHO, it would be best if gf launched gdb with -nx, ignoring users .gdbinit, and instead maintained its own gdb settings somewhere (in the .project.gf maybe?).

By the way, I must say I LOVE this project! Can't wait for the watch window, but this is strictly better than the TUI already.

Segfault on autocomplete

I've tried using gf on my notebook, and it segfaulted when I pressed tab in the gdb command line. I recompiled without optimizations and ran it under valgrind, here's what's causing the segfault:

==5312== Invalid read of size 1
==5312==    at 0x4D189B0: __strchr_sse2 (strchr.S:24)
==5312==    by 0x11CED1: TabCompleterRun(TabCompleter*, UITextbox*, bool, bool) (gf2.cpp:595)
==5312==    by 0x11FCA6: TextboxInputMessage(UIElement*, UIMessage, int, void*) (windows.cpp:589)
==5312==    by 0x10DAE7: UIElementMessage (luigi.h:1385)
==5312==    by 0x1198E5: _UIWindowInputEvent (luigi.h:3961)
==5312==    by 0x11B4AF: _UIProcessEvent (luigi.h:4528)
==5312==    by 0x11B870: _UIMessageLoopSingle (luigi.h:4592)
==5312==    by 0x119FF6: UIMessageLoop (luigi.h:4215)
==5312==    by 0x125F4E: main (gf2.cpp:1303)
==5312==  Address 0x0 is not stack'd, malloc'd or (recently) free'd

Thought on sponsors?

Dude! I've been using gf for a few days now, and I must say everything else is almsot unusable in comparison.
Now, I don't know what your free time and motivation situation is. With that in mind, I would really want this project not not be abandoned. I'll be glad to drop.. idk $50 a month? just to make sure you keep working on it.

What are your thoughts on this? It's your call, obviously.

Add add a button to or automatically reload source files

Because gf is awesome and very fast, I constantly switch between the editor and the debugger, and the source view in gf is often out of sync, which prevents me from placing breakpoints by line number correctly. Having a button to reload the source would be nice.

Watch window strategy?

Good day Mr. Nakst, the progress so far has been amazing, and gf is already a pleasure to use!

Today I want to talk the watch window. I've compiled v1 of gf, and it seems you went the same way as DDD as far as data display goes. Now, such approach is definitely very useful for visualizing things like linked lists, trees etc, but I think a conventional 3-column view is better suited for more common use-cases. The traditional view can also intuitively be navigated with a keyboard. And, of course, every GUI debugger ever has a watch window, so the UX is well established and there is practically no learning curve for switching to gf.

However, I do feel that the "advanced" view is really helpful in some scenarios. In fact, viewing bitmaps is already a good example: seeing a few bitmaps at once, as well as being able to zoom and pan doesn't feel like something that could be done well in a traditional watch window.

So I propose a split: "watch" tab gets a good-ol' 3-column view, while the "data" tab is where users go to perform advanced data visualization.

What are your (or anyone else's who is reading this) thoughts on this?

Hardware wacthpoint is not deleted

I would expect that upon changing the watched expression or deleting it altogether the assosiated watchpoint should be deleted as well. Right now it stays on, and completely destroys the ability to restart the debugee, because something is writted to the watched address long before hitting main.

Single log window

Instead of having watch logger open in separate data windows, make a single, unified log window. This allows the relative times of logged events to be tracked. It could also contain logs for every time a line is executed (storing also the backtrace and expressions to evaluate), and perhaps also data from the log pipe.

It could allow for sorting and filtering, and possibly even something like SQL queries. And perhaps once there's infrastructure for tables with sorting and filtering, the technology could be used for inspecting an array of structures.

Keyboard shortcut to focus a specific pane

The TAB-based focus system is currently working alright, but with the growing number of windows/panes, cycling between them might start to take very long. I propose a shortcut navigation system, which focuses a specific pane with a key combination (e.g. Alt+1 for source, Alt+2 for watches etc). As for TAB, it should probably only cycle inside the focused pane.

How can I write a hook to display variable number of items in the watch window?

I am trying to write a display hook in python for a dynamic array container (for example std::vector).

The way I understand the hook function is that it is called twice: once to fetch the list of names of the fields, and another time to fetch their respective values.

I would like to display each item in my dynamic array as a separate element in this list of fields. I can't figure out how to change the gf code such that by the time it calls the hook with field = None, I already know the number of elements in my array.

Any help would be greatly appreciated.

Bitmap live update

This one is quite big, because setting the parameters every time is quite tedious. To my understanding, the bitmap data is sent over gdb's MI, which means it's really slow. So I propose a switch (a checkbox) on a bitmap preview, which allows you to toggle live preview on-off. This checkbox can then be off by default.

That's one of those things where having your own debugger instead of gdb would make things so much simpler...

Console window strategy?

Right now, the console window is not like the others: not only does it serve its primary purpose (input-output from gdb), but it has the status square, the Menu button, and the Donate button (questionable desicion to put it there, IMHO).

Currently, the console window is a "last resort" way to tell gdb to do something, when the usual interface and shortcuts are not able to it. For me personally, there are only two cases for using it: placing a breakpoint by function name, and using format specifiers to print a value in hex/binary etc.

Ok, I've lost my train of thought a bit.. Here are my main points:

  1. I think the menu button and the status should be a separate pane
  2. If there are any things you often find yourself doing via the console, it might be time to move them to some separate UI (but not always. For one, a quick print arr[123] is, in my opinion, cleaner than adding the value to the watch window only for it to be left there as garbage)

To sum it up, I guess I'm asking what your thoughts are on the future of the Console window. Is it a "last resort" for things not in the UI or something else?

Recommend Projects

  • React photo React

    A declarative, efficient, and flexible JavaScript library for building user interfaces.

  • Vue.js photo Vue.js

    ๐Ÿ–– Vue.js is a progressive, incrementally-adoptable JavaScript framework for building UI on the web.

  • Typescript photo Typescript

    TypeScript is a superset of JavaScript that compiles to clean JavaScript output.

  • TensorFlow photo TensorFlow

    An Open Source Machine Learning Framework for Everyone

  • Django photo Django

    The Web framework for perfectionists with deadlines.

  • D3 photo D3

    Bring data to life with SVG, Canvas and HTML. ๐Ÿ“Š๐Ÿ“ˆ๐ŸŽ‰

Recommend Topics

  • javascript

    JavaScript (JS) is a lightweight interpreted programming language with first-class functions.

  • web

    Some thing interesting about web. New door for the world.

  • server

    A server is a program made to process requests and deliver data to clients.

  • Machine learning

    Machine learning is a way of modeling and interpreting data that allows a piece of software to respond intelligently.

  • Game

    Some thing interesting about game, make everyone happy.

Recommend Org

  • Facebook photo Facebook

    We are working to build community through open source technology. NB: members must have two-factor auth.

  • Microsoft photo Microsoft

    Open source projects and samples from Microsoft.

  • Google photo Google

    Google โค๏ธ Open Source for everyone.

  • D3 photo D3

    Data-Driven Documents codes.