Giter Site home page Giter Site logo

napjon / krisk Goto Github PK

View Code? Open in Web Editor NEW
118.0 15.0 22.0 1.92 MB

Statistical Interactive Visualization with pandas+Jupyter integration on top of Echarts.

License: BSD 3-Clause "New" or "Revised" License

Python 4.42% JavaScript 1.36% HTML 0.04% Jupyter Notebook 94.18%
data-science data-visualization python dashboard jupyter-notebook echarts interactive-charts

krisk's Introduction

CircleCI PyPI version Coverage Status svg

Overview

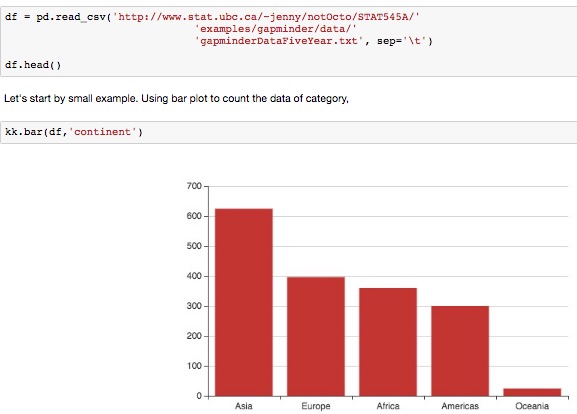
Krisk bring Echarts to Python Data Science Ecosystem, and helpful tools for high level statistical interactive visualization.

Dependencies

  • Python 3.5 (Python 2.7 should be supported, haven't test it yet)
  • Jupyter Notebook 4.2.x
  • Pandas 0.18.x
  • Echarts 3.2.1 (built-in)

Install

pip install jupyter pandas krisk
jupyter nbextension install --py krisk --sys-prefix
jupyter nbextension enable  --py krisk --sys-prefix

Tutorials

What It Does

  • Chart Integration with Jupyter Notebook, widgets, and Dashboard.
  • Statistical interactive visualization
  • Ability backed by Echarts (Toolbox, Transition, Tooltip, etc.)

What It Doesn't Do

Krisk won't implement all features of Echarts. For more advanced usage, Krisk users can use JSON option (or HTML) output produced by Krisk to optimize in Javascript.

Only basic charts are supported for explanation visualization. The plan will support:

  • More complex line, bar, scatter, and histogram.
  • Geoscatter plot
  • Time Series

Of course, contributions are welcome to support all chart types and advanced features.

Motivation for Another Visualization Library

Krisk is targeted for building interactive dashboard application on top of two key components of Jupyter framework, ipywidgets and Jupyter Dashboard.

Krisk is also act as tool to support reproducible chart by utilizing pandas DataFrame as data input.

How to Contribute

To contribute and unit tests your changes, please do the following,

  1. Fork this repository
  2. Clone this repo and do unit test,
pip install coverage pytest
git clone https://github.com/your-username/krisk.git
cd krisk
coverage run --source krisk -m py.test

License

New BSD

krisk's People

Contributors

napjon avatar norecces avatar

Stargazers

 avatar  avatar  avatar  avatar  avatar  avatar  avatar  avatar  avatar  avatar  avatar  avatar  avatar  avatar  avatar  avatar  avatar  avatar  avatar  avatar  avatar  avatar  avatar  avatar  avatar  avatar  avatar  avatar  avatar  avatar  avatar  avatar  avatar  avatar  avatar  avatar  avatar  avatar  avatar  avatar  avatar  avatar  avatar  avatar  avatar  avatar  avatar  avatar  avatar  avatar  avatar  avatar  avatar  avatar  avatar  avatar  avatar  avatar  avatar  avatar  avatar  avatar  avatar  avatar  avatar  avatar  avatar  avatar  avatar  avatar  avatar  avatar  avatar  avatar  avatar  avatar  avatar  avatar  avatar  avatar  avatar  avatar  avatar  avatar  avatar  avatar  avatar  avatar  avatar  avatar  avatar  avatar  avatar  avatar  avatar  avatar  avatar  avatar  avatar  avatar

Watchers

 avatar  avatar  avatar  avatar  avatar  avatar  avatar  avatar  avatar  avatar  avatar  avatar  avatar  avatar  avatar

krisk's Issues

Add Bar Mode for Sequential, Diverging, and Qualitative

add 'mode' as keyword parameter for bar chart.

  • If None, treat the bar mode as "Qualitative", and sort on lexicographical order.
  • If Boolean, treat the bar as "Sequential", whether the order sort ascending.
  • If string, either median or mean and deviation from that value
  • if integer, treat as value and deviate from that value

Add bar_line chart

Adding chart with bar and line with different series but same x-axis. For example,

kk.bar_line(df, x, y_bar, y_line, c=None, .....)

Not support nbconvert

Reproduce:

  1. Use Intro.ipynb
  2. Remove from krisk import init_notebook; init_notebook() since it's not gonna publish to nbviewer.
  3. Use nbconvert to export current page as html

Output:
Javascript part failed to print out.
Console error:
require.min.js:8 Uncaught Error: Script error for: dark
require.min.js:8 Failed to load resource: net::ERR_FILE_NOT_FOUND
...

Expected Output:
Charts should be shown as it run in notebook after exporting.

Possible solution:
It seems like after exporting, it still tries to retrieve source js files from local server and current folder. Is that possible we can define the source files' location as commands in python?

ENV:
Python3.5
Jupyter Notebook 4.2.1
Echarts 3.2.1 (built-in)

Support for Pie Chart

As far as I know, the current package only support line,scatter,bar,bar_line types...Thanks...

Error in Pip Install

I'm having a similar problem to #70 **
Collecting krisk
Using cached krisk-0.3.0.tar.gz
Complete output from command python setup.py egg_info:
Traceback (most recent call last):
File "", line 1, in
File "/private/var/folders/6s/fdz619ns34jfkhhjfqmwb3br0000gn/T/pip-build-x99MZJ/krisk/setup.py", line 2, in
from krisk import version
File "krisk/init.py", line 5, in
import krisk.plot.api as plot
File "krisk/plot/api.py", line 1, in
from krisk.plot.make_chart import make_chart
File "krisk/plot/make_chart.py", line 2, in
from krisk.chart.api import Chart
File "krisk/chart/api.py", line 1, in
from krisk.chart.core import rcParams, Chart
File "krisk/chart/core.py", line 189
SyntaxError: Non-ASCII character '\xef' in file krisk/chart/core.py on line 189, but no encoding declared; see http://python.org/dev/peps/pep-0263/ for details**

The last update doesn't seem to fix this issue.

FileNotFoundError: [Errno 2] No such file or directory: 'C:\\Program Files\\Anaconda3\\lib\\site-packages\\krisk\\static/krisk.js'

hi there

python3.5
win10
pip install krisk

i run this page code, http://nbviewer.jupyter.org/github/napjon/krisk/blob/master/notebooks/Intro.ipynb

when i run , kk.bar(df,'continent')

i got error

---------------------------------------------------------------------------
FileNotFoundError                         Traceback (most recent call last)
C:\Program Files\Anaconda3\lib\site-packages\IPython\core\formatters.py in __call__(self, obj)
    309             method = get_real_method(obj, self.print_method)
    310             if method is not None:
--> 311                 return method()
    312             return None
    313         else:

C:\Program Files\Anaconda3\lib\site-packages\krisk\chart\core.py in _repr_javascript_(self)
    574                                       width=self._size['width'],
    575                                       height=self._size['height']))+\
--> 576                 (self._get_resync_option_strings(self.option))
    577 
    578     def _get_duplicated(self):

C:\Program Files\Anaconda3\lib\site-packages\krisk\chart\core.py in _get_resync_option_strings(self, option)
    553         """Resync Chart option"""
    554 
--> 555         js_template = get_content(JS_TEMPLATE_PATH)
    556         event_template = get_content(EVENT_TEMPLATE_PATH)
    557 

C:\Program Files\Anaconda3\lib\site-packages\krisk\util.py in get_content(filepath)
     13         """Retrieve content from file"""
     14         abs_path = join_current_dir(filepath)
---> 15         with open(abs_path, 'r') as f:
     16                 return f.read()
     17 

FileNotFoundError: [Errno 2] No such file or directory: 'C:\\Program Files\\Anaconda3\\lib\\site-packages\\krisk\\static/krisk.js'

Out[4]:
<krisk.chart.core.Chart at 0x27540c21ba8>

Add formatting option

Now numbers rendered as is, and it doesn't do formatting properly when go as high as hundreds of millions. Should add additional parameters to control how numbers are rendered.

Error in pip install

Collecting risk
Using cached krisk-0.3.0.tar.gz
    Complete output from command python setup.py egg_info:
    Traceback (most recent call last):
      File "<string>", line 1, in <module>
      File "/private/var/folders/c4/yxk5p2k93z53gw5ywq750x3nhlvp8p/T/pip-build-imEuXs/krisk/setup.py", line 2, in <module>
        from krisk import __version__
      File "krisk/__init__.py", line 5, in <module>
        import krisk.plot.api as plot
      File "krisk/plot/api.py", line 1, in <module>
        from krisk.plot.make_chart import make_chart
      File "krisk/plot/make_chart.py", line 2, in <module>
        from krisk.chart.api import Chart
      File "krisk/chart/api.py", line 1, in <module>
        from krisk.chart.core import rcParams, Chart
      File "krisk/chart/core.py", line 189
    SyntaxError: Non-ASCII character '\xef' in file krisk/chart/core.py on line 189, but no encoding declared; see http://python.org/dev/peps/pep-0263/ for details```

Add TimeDelta Support

In Clinical Trial, there are various cases where start date for each patient is different. We have to make baseline date for each patient and measure compliance rate. Timedelta operations can benefit case like this.

Recommend Projects

  • React photo React

    A declarative, efficient, and flexible JavaScript library for building user interfaces.

  • Vue.js photo Vue.js

    🖖 Vue.js is a progressive, incrementally-adoptable JavaScript framework for building UI on the web.

  • Typescript photo Typescript

    TypeScript is a superset of JavaScript that compiles to clean JavaScript output.

  • TensorFlow photo TensorFlow

    An Open Source Machine Learning Framework for Everyone

  • Django photo Django

    The Web framework for perfectionists with deadlines.

  • D3 photo D3

    Bring data to life with SVG, Canvas and HTML. 📊📈🎉

Recommend Topics

  • javascript

    JavaScript (JS) is a lightweight interpreted programming language with first-class functions.

  • web

    Some thing interesting about web. New door for the world.

  • server

    A server is a program made to process requests and deliver data to clients.

  • Machine learning

    Machine learning is a way of modeling and interpreting data that allows a piece of software to respond intelligently.

  • Game

    Some thing interesting about game, make everyone happy.

Recommend Org

  • Facebook photo Facebook

    We are working to build community through open source technology. NB: members must have two-factor auth.

  • Microsoft photo Microsoft

    Open source projects and samples from Microsoft.

  • Google photo Google

    Google ❤️ Open Source for everyone.

  • D3 photo D3

    Data-Driven Documents codes.