Giter Site home page Giter Site logo

nixtla / tsfeatures Goto Github PK

View Code? Open in Web Editor NEW
325.0 8.0 40.0 236 KB

Calculates various features from time series data. Python implementation of the R package tsfeatures.

License: Apache License 2.0

Python 100.00%
time-series features python tsfeatures metrics errors m4 fforma forecasting

tsfeatures's Introduction

Build PyPI version fury.io Downloads Python 3.6+ License: MIT

tsfeatures

Calculates various features from time series data. Python implementation of the R package tsfeatures.

Installation

You can install the released version of tsfeatures from the Python package index with:

pip install tsfeatures

Usage

The tsfeatures main function calculates by default the features used by Montero-Manso, Talagala, Hyndman and Athanasopoulos in their implementation of the FFORMA model.
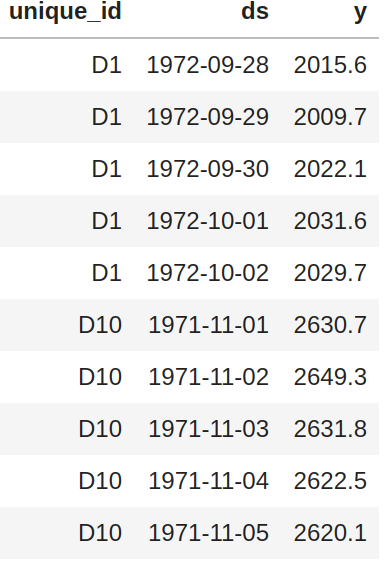
from tsfeatures import tsfeatures

This function receives a panel pandas df with columns unique_id, ds, y and optionally the frequency of the data.

tsfeatures(panel, freq=7)

By default (freq=None) the function will try to infer the frequency of each time series (using infer_freq from pandas on the ds column) and assign a seasonal period according to the built-in dictionary FREQS:

FREQS = {'H': 24, 'D': 1,
         'M': 12, 'Q': 4,
         'W':1, 'Y': 1}

You can use your own dictionary using the dict_freqs argument:

tsfeatures(panel, dict_freqs={'D': 7, 'W': 52})

List of available features

Features
acf_features heterogeneity series_length
arch_stat holt_parameters sparsity
count_entropy hurst stability
crossing_points hw_parameters stl_features
entropy intervals unitroot_kpss
flat_spots lumpiness unitroot_pp
frequency nonlinearity
guerrero pacf_features

See the docs for a description of the features. To use a particular feature included in the package you need to import it:

from tsfeatures import acf_features

tsfeatures(panel, freq=7, features=[acf_features])

You can also define your own function and use it together with the included features:

def number_zeros(x, freq):

    number = (x == 0).sum()
    return {'number_zeros': number}

tsfeatures(panel, freq=7, features=[acf_features, number_zeros])

tsfeatures can handle functions that receives a numpy array x and a frequency freq (this parameter is needed even if you don't use it) and returns a dictionary with the feature name as a key and its value.

R implementation

You can use this package to call tsfeatures from R inside python (you need to have installed R, the packages forecast and tsfeatures; also the python package rpy2):

from tsfeatures.tsfeatures_r import tsfeatures_r

tsfeatures_r(panel, freq=7, features=["acf_features"])

Observe that this function receives a list of strings instead of a list of functions.

Comparison with the R implementation (sum of absolute differences)

Non-seasonal data (100 Daily M4 time series)

feature diff feature diff feature diff feature diff
e_acf10 0 e_acf1 0 diff2_acf1 0 alpha 3.2
seasonal_period 0 spike 0 diff1_acf10 0 arch_acf 3.3
nperiods 0 curvature 0 x_acf1 0 beta 4.04
linearity 0 crossing_points 0 nonlinearity 0 garch_r2 4.74
hw_gamma 0 lumpiness 0 diff2x_pacf5 0 hurst 5.45
hw_beta 0 diff1x_pacf5 0 unitroot_kpss 0 garch_acf 5.53
hw_alpha 0 diff1_acf10 0 x_pacf5 0 entropy 11.65
trend 0 arch_lm 0 x_acf10 0
flat_spots 0 diff1_acf1 0 unitroot_pp 0
series_length 0 stability 0 arch_r2 1.37

To replicate this results use:

python -m tsfeatures.compare_with_r --results_directory /some/path
                                    --dataset_name Daily --num_obs 100

Sesonal data (100 Hourly M4 time series)

feature diff feature diff feature diff feature diff
series_length 0 seas_acf1 0 trend 2.28 hurst 26.02
flat_spots 0 x_acf1 0 arch_r2 2.29 hw_beta 32.39
nperiods 0 unitroot_kpss 0 alpha 2.52 trough 35
crossing_points 0 nonlinearity 0 beta 3.67 peak 69
seasonal_period 0 diff1_acf10 0 linearity 3.97
lumpiness 0 x_acf10 0 curvature 4.8
stability 0 seas_pacf 0 e_acf10 7.05
arch_lm 0 unitroot_pp 0 garch_r2 7.32
diff2_acf1 0 spike 0 hw_gamma 7.32
diff2_acf10 0 seasonal_strength 0.79 hw_alpha 7.47
diff1_acf1 0 e_acf1 1.67 garch_acf 7.53
diff2x_pacf5 0 arch_acf 2.18 entropy 9.45

To replicate this results use:

python -m tsfeatures.compare_with_r --results_directory /some/path \
                                    --dataset_name Hourly --num_obs 100

Authors

tsfeatures's People

Contributors

azulgarza avatar cchallu avatar jmoralez avatar ricardo-olivares-armas avatar tracykteal avatar

Stargazers

 avatar  avatar  avatar  avatar  avatar  avatar  avatar  avatar  avatar  avatar  avatar  avatar  avatar  avatar  avatar  avatar  avatar  avatar  avatar  avatar  avatar  avatar  avatar  avatar  avatar  avatar  avatar  avatar  avatar  avatar  avatar  avatar  avatar  avatar  avatar  avatar  avatar  avatar  avatar  avatar  avatar  avatar  avatar  avatar  avatar  avatar  avatar  avatar  avatar  avatar  avatar  avatar  avatar  avatar  avatar  avatar  avatar  avatar  avatar  avatar  avatar  avatar  avatar  avatar  avatar  avatar  avatar  avatar  avatar  avatar  avatar  avatar  avatar  avatar  avatar  avatar  avatar  avatar  avatar  avatar  avatar  avatar  avatar  avatar  avatar  avatar  avatar  avatar  avatar  avatar  avatar  avatar  avatar  avatar  avatar  avatar  avatar  avatar  avatar  avatar

Watchers

 avatar  avatar  avatar  avatar  avatar  avatar  avatar  avatar

tsfeatures's Issues

Question about frequency

Hi, I have a question about the frequency setting in utils.py.

What does the frequency map mean here? The code says, an hourly data has frequency 24, a daily data has frequency 1, but
why weekly and yearly data all have 1 as frequency?

FREQS = {'H': 24, 'D': 1,
         'M': 12, 'Q': 4,
         'W':1, 'Y': 1}

Thanks in advance.

Use a grouper instead of `unique_id`

In the main feature extract loop, tsfeatures groups by the hard coded unique_id columns, and then applies transforms the grouped data.

ts_features = pool.starmap(partial_get_feats, ts.groupby('unique_id'))

It would be more generic if you could pass in a Grouper to perform the grouping, i.e. at the moment I have to group my data then create a flat column from the multi-index (i.e. a column of tuples)

# group by id and day
grouper = [pd.Grouper(key='id'), pd.Grouper(key='time', freq='1D')]
grouped_data = df.groupby(grouper, group_keys=True)

# join groups, use grouper key as new index
grouped_data = grouped_data.apply(lambda x: x.drop(columns=['id']))
grouped_data = grouped_data.droplevel(-1)

# flatten index to tuples
grouped_data.index = grouped_data.index.to_flat_index()
grouped_data.index.name = 'id'
grouped_data = grouped_data.reset_index()

The issue I've had with that is that I've been experimenting with Dask and data formats like parquet don't seem to support this column type (you can create a Dask data frame from a pandas dataframe that contains tuple columns but so far I've been unable to persist them). I know tsfeatures doesn't support Dask at this stage but I guess it might be on the roadmap?

Custom feature doesn't work

What happened + What you expected to happen

As your doc mentions it should be possible to add custom feature (I copy paste your function from README)
=> but nothing happens after a few longs minutes

Could you please check ?

Versions / Dependencies

0.4.2 (the last one)

Reproduction script

import pandas as pd
import numpy as np
from tsfeatures import tsfeatures

periods = 24
ind = pd.date_range(start='2021-01-01', periods=periods, freq='MS')
vals = np.random.rand(periods)
df = pd.DataFrame({'ds':ind, 'y':vals, 'unique_id':1})

def number_zeros(x, freq):
number = (x == 0).sum()
return {'number_zeros': number}

features_df = tsfeatures(df,freq=12, features=[number_zeros])
features_df

Issue Severity

None

dependencies

I've started working on an adapter for tsfeatures in sktime sktime/sktime#968 but I'm running in some dependencies issues.

The main problem is the strict requirements
e.g. scikit-learn==0.23.1 instead of scikit-learn>=0.23.1 or just scikit-learn.

Also entropy is now deprecated and replaced by https://github.com/raphaelvallat/antropy

[Core] Make the library compatible with AnyDataframe (spark, ray, dask)

Description

Currently, tsfeatures utilizes a map-reduce approach and multiprocessing to compute several features for different time series. However, the implementation is currently only supported for pandas. By incorporating fugue, we can ensure tsfeatures compatibility with spark, ray, and dask.

For reference on how the implementation should look, please see https://github.com/Nixtla/statsforecast/blob/main/statsforecast/core.py#L1784.

Use case

No response

hw_parameters, Param smoothing_slope

Hi Federico,

thank you for this great work. I've got a question about the function hw_parameters, more precisely the parameter 'smoothing_slope':

Since hw_parameters always returns 'nan' for any time series I use, is it possible, that 'smoothing_slope' should be renamed to 'smoothing_trend' ? Because if I do this, hw_parameters returns valid values.

For the parameter names I had a look here:
https://www.statsmodels.org/dev/generated/statsmodels.tsa.holtwinters.ExponentialSmoothing.fit.html#statsmodels.tsa.holtwinters.ExponentialSmoothing.fit

Thank you very much

[Bug] Uninformative `TypeError` using `tsfeatures` when `series_length < 12`

I'm trying to run this on a test series of length 11 and freq='D', and getting TypeError: 'float' object is not subscriptable.

Is this expected/unavoidable? Ideally it could be fixed even if some features must return NaN or similar. Otherwise there could be a more informative error, or just check if the series_length is too small and raise an exception. Here is some code that breaks when the series_length is 11, but works when it's 12.

import numpy as np
import pandas as pd
from tsfeatures import tsfeatures

periods = 11
ind = pd.date_range(start='2000-01-01', periods=periods, freq='D')
vals = np.random.rand(periods)

df = pd.DataFrame({'ds':ind, 'y':vals, 'unique_id':1})
print(f'Inferred freq: {pd.infer_freq(df.ds)}')
print(df.head())

tsfeatures(df)

Output >

Inferred freq: D
          ds         y  unique_id
0 2000-01-01  0.576768          1
1 2000-01-02  0.482616          1
2 2000-01-03  0.848193          1
3 2000-01-04  0.180783          1
4 2000-01-05  0.060860          1

---------------------------------------------------------------------------
RemoteTraceback                           Traceback (most recent call last)
RemoteTraceback: 
"""
Traceback (most recent call last):
  File "/usr/local/Cellar/[email protected]/3.9.4/Frameworks/Python.framework/Versions/3.9/lib/python3.9/multiprocessing/pool.py", line 125, in worker
    result = (True, func(*args, **kwds))
  File "/usr/local/Cellar/[email protected]/3.9.4/Frameworks/Python.framework/Versions/3.9/lib/python3.9/multiprocessing/pool.py", line 51, in starmapstar
    return list(itertools.starmap(args[0], args[1]))
  File "/Users/loganduffy/Code/ts/notebooks/tsdl/lib/python3.9/site-packages/tsfeatures/tsfeatures.py", line 871, in _get_feats
    c_map = ChainMap(*[dict_feat for dict_feat in [func(ts, freq) for func in features]])
  File "/Users/loganduffy/Code/ts/notebooks/tsdl/lib/python3.9/site-packages/tsfeatures/tsfeatures.py", line 871, in <listcomp>
    c_map = ChainMap(*[dict_feat for dict_feat in [func(ts, freq) for func in features]])
  File "/Users/loganduffy/Code/ts/notebooks/tsdl/lib/python3.9/site-packages/tsfeatures/tsfeatures.py", line 539, in pacf_features
    pacf_5 = np.sum(pacfx[1:6] ** 2)
TypeError: 'float' object is not subscriptable
"""

The above exception was the direct cause of the following exception:

TypeError                                 Traceback (most recent call last)
Input In [239], in <cell line: 13>()
     10 print(f'Inferred freq: {pd.infer_freq(df.ds)}')
     11 print(df.head())
---> 13 tsfeatures(df)

File ~/Code/ts/notebooks/tsdl/lib/python3.9/site-packages/tsfeatures/tsfeatures.py:916, in tsfeatures(ts, freq, features, dict_freqs, scale, threads)
    912 partial_get_feats = partial(_get_feats, freq=freq, scale=scale,
    913                             features=features, dict_freqs=dict_freqs)
    915 with Pool(threads) as pool:
--> 916     ts_features = pool.starmap(partial_get_feats, ts.groupby('unique_id'))
    918 ts_features = pd.concat(ts_features).rename_axis('unique_id')
    919 ts_features = ts_features.reset_index()

File /usr/local/Cellar/[email protected]/3.9.4/Frameworks/Python.framework/Versions/3.9/lib/python3.9/multiprocessing/pool.py:372, in Pool.starmap(self, func, iterable, chunksize)
    366 def starmap(self, func, iterable, chunksize=None):
    367     '''
    368     Like `map()` method but the elements of the `iterable` are expected to
    369     be iterables as well and will be unpacked as arguments. Hence
    370     `func` and (a, b) becomes func(a, b).
    371     '''
--> 372     return self._map_async(func, iterable, starmapstar, chunksize).get()

File /usr/local/Cellar/[email protected]/3.9.4/Frameworks/Python.framework/Versions/3.9/lib/python3.9/multiprocessing/pool.py:771, in ApplyResult.get(self, timeout)
    769     return self._value
    770 else:
--> 771     raise self._value

TypeError: 'float' object is not subscriptable

R-Python Comparison

Hi,

In the section "Comparison with the R implementation (sum of absolute differences)" of the README, differences in some features between the Python and R implementations can be seen, however, for other features the differences are 0.

In my own dataset I also observe differences in other features (trend, for example) and I would like to know what these differences are due to and why the results do not match between the two implementations.

Are different implementations being used? I just want to be clear about the reason for the differences.

Thanks for the work on this package!

[Core] Add support for polars

Description

Our codebase primarily relies on pandas for data handling and manipulation tasks. However, we have identified potential performance improvements that could be gained by incorporating support for Polars, a fast DataFrame library implemented in Rust and available in Python.

Polars is designed to outperform pandas in various scenarios and could provide significant speed-ups for our data processing tasks. This can benefit larger datasets and more complex operations, making our toolset more versatile and efficient.

The task would involve reviewing the codebase and integrating the possibility of using Polars as input instead of Pandas. We must ensure the transition is seamless and keeps existing functionalities intact.

This is a substantial task that might require time and careful testing. Any contributors willing to help with this task are welcome. Please feel free to comment below if you'd like to assist or have suggestions on approaching this task.

Use case

No response

Pypi package

Hi Federico,
Thanks for this. Are you planning to make a pypi package for it? I could then create a conda-forge package.

infered frequency

my signal is resampled to every 4H. Although I have made sure to fill all nan values and have ds to include all time indices, tsfeatures cannot infer it properly. If I need to set freq, should I put freq=4 or freq=6? thanks

Structure of df

Hi!

Please, could you add an example of how the input df should look? I don't understand columns ds and y.

Thanks :)

NotImplementedError: AR has been removed from statsmodels

In the heterogeneity function, "AR" function is being used but this has now been replaced with statsmodels.tsa.ar_model.AutoReg. Thanks to update

I'm no expert but I have suggested fix as follows:

from statsmodels.tsa.ar_model import AutoReg
...
    try:
        x_whitened = AutoReg(x, lags=order_ar, trend='c').fit().resid
    except:
        try:
            x_whitened = AutoReg(x, lags=order_ar, trend='n').fit().resid
        except:
            output = {
                'arch_acf': np.nan,
                'garch_acf': np.nan,
                'arch_r2': np.nan,
                'garch_r2': np.nan
            }

            return output

Multiprocessing pool is breaking long shot scripts

On a Fedora system, after about two hours of operation, the pool used to extract features starts hanging open processes, resulting in a significant increase in memory usage.

The solution was to force the pool to close with pool.close(); pool.join():

Screenshot from 2022-12-29 09-21-22

I know it is super strange because the context manager should already do this...

Recommend Projects

  • React photo React

    A declarative, efficient, and flexible JavaScript library for building user interfaces.

  • Vue.js photo Vue.js

    ๐Ÿ–– Vue.js is a progressive, incrementally-adoptable JavaScript framework for building UI on the web.

  • Typescript photo Typescript

    TypeScript is a superset of JavaScript that compiles to clean JavaScript output.

  • TensorFlow photo TensorFlow

    An Open Source Machine Learning Framework for Everyone

  • Django photo Django

    The Web framework for perfectionists with deadlines.

  • D3 photo D3

    Bring data to life with SVG, Canvas and HTML. ๐Ÿ“Š๐Ÿ“ˆ๐ŸŽ‰

Recommend Topics

  • javascript

    JavaScript (JS) is a lightweight interpreted programming language with first-class functions.

  • web

    Some thing interesting about web. New door for the world.

  • server

    A server is a program made to process requests and deliver data to clients.

  • Machine learning

    Machine learning is a way of modeling and interpreting data that allows a piece of software to respond intelligently.

  • Game

    Some thing interesting about game, make everyone happy.

Recommend Org

  • Facebook photo Facebook

    We are working to build community through open source technology. NB: members must have two-factor auth.

  • Microsoft photo Microsoft

    Open source projects and samples from Microsoft.

  • Google photo Google

    Google โค๏ธ Open Source for everyone.

  • D3 photo D3

    Data-Driven Documents codes.