Giter Site home page Giter Site logo

npgrosser / logseq-diagrams-as-code Goto Github PK

View Code? Open in Web Editor NEW
163.0 163.0 10.0 1.68 MB

Logseq plugin that lets you create diagrams from textual representation (aka 'Diagrams as Code'). It supports a wide range of diagram types and languages, including Mermaid, Graphviz, PlantUML, and many more.

License: MIT License

TypeScript 98.85% HTML 0.65% JavaScript 0.50%
asciimath blockdiag d2 diagram erd graphviz kroki logseq mermaid plantuml uml wavedrom

logseq-diagrams-as-code's People

Contributors

avelino avatar dom8509 avatar jheyduk avatar m0wlaue avatar mlthlschr avatar npgrosser avatar

Stargazers

 avatar  avatar  avatar  avatar  avatar  avatar  avatar  avatar  avatar  avatar  avatar  avatar  avatar  avatar  avatar  avatar  avatar  avatar  avatar  avatar  avatar  avatar  avatar  avatar  avatar  avatar  avatar  avatar  avatar  avatar  avatar  avatar  avatar  avatar  avatar  avatar  avatar  avatar  avatar  avatar  avatar  avatar  avatar  avatar  avatar  avatar  avatar  avatar  avatar  avatar  avatar  avatar  avatar  avatar  avatar  avatar  avatar  avatar  avatar  avatar  avatar  avatar  avatar  avatar  avatar  avatar  avatar  avatar  avatar  avatar  avatar  avatar  avatar  avatar  avatar  avatar  avatar  avatar  avatar  avatar  avatar  avatar  avatar  avatar  avatar  avatar  avatar  avatar  avatar  avatar  avatar  avatar  avatar  avatar  avatar  avatar  avatar  avatar  avatar  avatar

Watchers

 avatar  avatar  avatar  avatar

logseq-diagrams-as-code's Issues

Updating Plugin Config

How do I add options to the plugin config?

For example, I added { "commands": { "renderers": ["plantuml", "mermaid"] } } to plugins.edn as shown below and it doesn't seem to take affect.

:logseq-diagrams-as-code {:version "0.0.21", :repo "npgrosser/logseq-diagrams-as-code", :effect false, :theme false
{ "commands": { "renderers": ["plantuml", "mermaid"] } }
}

Can you make Logseq links from diagrams?

e.g. say you have a page [[person]], can you like to [[person]] from inside any of the diorama types? I guess not as the diagrams are rendered totally externally by the webervice.

Publish static pages with diagrams

I use Logseq Publish SPA to publish the resulting pages.

Is it possible to make the diagrams as code plugin work in this context?

I understand some JavaScript files from the plugin should be in the final result, either including them in the uploaded files or (preferably) specifying them as dependencies to download at build time. Perhaps there is a way to specify these dependencies, and I could not find the corresponding documentation.

Am I missing something?

PD: This question is related to another question at the Logseq Publish SPA repo.

Understanding renderer/embed styling

Please can you help me understand what the correct modifications would be to reduce the padding around diagrams?

My preferred diagram type is D2, but I do end up with quite a lot of padding/white space

image

I noticed that when setting the direction to be right - the image would be tiny and unreadable. This lead me to discover that you can click on the embed and add (for example) containerStyle=width: 300px

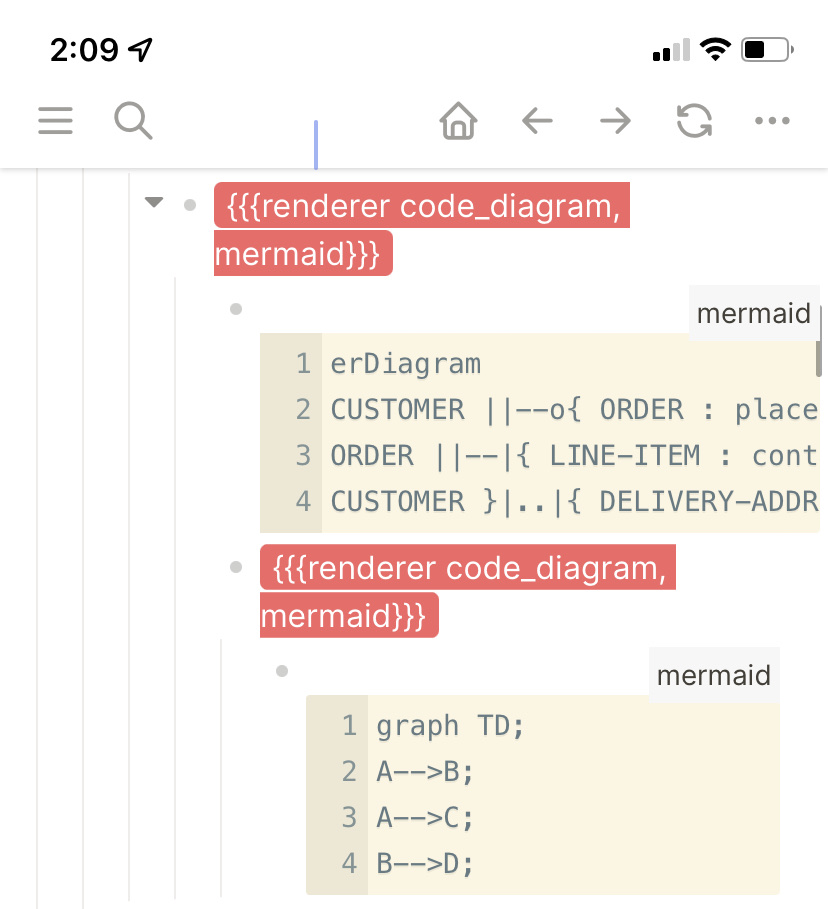
I assumed therefore that if I wanted to modify the padding, I would do containerStyle=width: 300px, padding: 1px as I can see this listed under https://github.com/npgrosser/logseq-diagrams-as-code?tab=readme-ov-file#all-diagram-options

I also tried to edit custom.css to contain

.dac-container-d2 {
    padding: 3px
}

As a final related question, the https://github.com/npgrosser/logseq-diagrams-as-code?tab=readme-ov-file#kroki-diagram-options ability to use diagram themes looks good - but am I correct in understanding that this prevents customising the styling further?
E.G the below does not resize an image for me, but does apply the theme:

{{renderer code_diagram,d2,kroki.diagram.theme=7,containerStyle=width: 500px}}
Edit: I figured out this last part to be {{renderer code_diagram,d2,kroki.diagram.theme=7&containerStyle=width: 500px}}

Many thanks!

Plugin does not render code 😢

Hello,

I would like to make use of this amazing plugin but the graph does not render 😢

  1. Deactivated all plugins
  2. Restart Logseq
  3. Installed Diagrams-as-code
  4. Restart Logseq
  5. Used the shortcut /Create... and pick one type
  6. Example code is inserted but now graph visible
Screen.Recording.2023-03-18.at.11.46.13.mov

Macbook M1 13.2.1 (22D68)
Logseq Version 0.8.18 (0.8.18)
Diagrams as Code 0.0.20

Can't change the style

Hi buddy,
Thanks for your amazing plugin, I like it very much, but only have a little problem.
I followed the instruction and added the following code into file custom.css , but nothing happened.

.dac-container {
  background-color: #eeeeee;
}

Thanks.

Arrow sizes inconsistent on flow charts

Hi,
Please consider this minimal flow chart:

graph TD;
A<-->B;

As you can see if you enter it in Logseq, the opening arrow (A side) is much bigger than the ending one (B side). In fact, ending arrows are so small that they are very difficult to spot.

Would you consider making all arrows the size of the opening ones?

Thanks in advance,

Allow a per-renderer macros file

Hello, and thanks a lot for making this so user-friendly,

Now that kroki and this plugin support tikz, I can put my old diagrams into my notes finally. However, this requires me to copy and paste my boilerplate preamble code (macros.tex) in every cell that I put in the notebook. This is clearly inefficient.

Similar libraries (for instance katex) allow to define preamble. Could this be added to the plugin? I'm thinking maybe another entry to the logseq/settings/logseq-diagrams-as-code.json file named latex_preamble.

This could be extended to a postamble too; which would allow us not to specify a document at all. Always load libraries and macros necessary + \begin{document} in the preamble and a bunch of additional commands plus a \end{document} to the postamble. From that point onwards, all one needs to put in the notes in \begin{tikzfigure} .... \end{tikzfigure}.

Does not render on iOS app

The plugin does not render diagrams on the mobile iOS app (which is currently in beta testing). Screenshot below:

image

Mermaid Gantt doesnt scale with page width

Hi,

When using logseq 0.7.5 and Diagrams as Code 0.0.13 and using standard mermaid syntax like
gantt title A Gantt Diagram dateFormat YYYY-MM-DD section Section A task :a1, 2014-01-01, 30d Another task :after a1 , 200d section Another Task in sec :2014-01-12 , 12d another task : 24d

It doesnt scale with the page width, its always to narrow for anything meaningful to be used in a timeline.
Screenshot 2022-07-09 at 16 32 03

Improve Diagram Scaling

This issue addresses the current limitation where diagrams do not scale with the page width.
The goal is to investigate possible approaches to enhance diagram scaling.

See #6 and #12 (comment)

RackDiag

Hey,

would it be possible to add RackDiag it is also in the Kroki lib.

Thanks

Add an option to embed the generated figures

Hi. Thank you very much for this amazing plugin; especially the new tikz command works really well.

My only problem is that the figures generated are not embedded in the notes it seems. This means that once you publish the graph, the diagrams are not visible (presumably because plugins are not exported by LogSeq for publishing).

But if there was a way to embed the jpg/png/svg generated by kroki; then having the plugin in the published page (or the mobile version) would not be necessary to view the rendered figure; but just for changing it.

View of published graph page
image

Support for org-mode code blocks

Currently the code blocks are added with three backticks which works in logseq but is not valid for an org-mode file. Logseq supports both file formats. It would be good if this could support org mode as well.

#+BEGIN_SRC plantuml
... some code
#+END_SRC

I think you can get the "preferredFormat" from getUserConfig which should allow setting the template.

Looks like it might need the rendering code tweaking so it can find org-mode format as well.

How to edit code inside {{}} ?

After I've created a diagram, how do I edit the diagram metacode inside of the {{}}, for example, to add a title? Once I see a rendered image of the diagram, nothing happens when I click on the block text. I don't know what I should see, but I was expecting the raw markup, like I see in other blocks. Then, in the markup, I thought I'd see the {{}} stuff shown in the README.

If I expand the block, so I see the diagram code -- in my case, the mermaid code -- I still don't see any place to edit {{}}

Kroki request blocked by CORS policy

There is suddenly an issue with accessing the kroki API (which is used for most diagram types).

Access to fetch at 'https://kroki.io/d2/svg/eNqrUNC1U6i0UshIzcnJVyjPL8pJ4QIAP2UGXQ==' from origin 'lsp://logseq.io' has been blocked by CORS policy: No 'Access-Control-Allow-Origin' header is present on the requested resource. If an opaque response serves your needs, set the request's mode to 'no-cors' to fetch the resource with CORS disabled.

Tested with logseq 0.8.16 on Windows 11 and MacOS 13.1

This only happens with the marketplace version of the plugin.
When installing the local build (using 'Load unpacked plugin') everything works as expected.

Support aasvg

Hi, would there be interest in supporting aasvg (which in turn is based off of markdeep as a vendored dependency)? We use it a lot in IETF standards work. I am willing to give it a shot and contribute this if you are up for it.

Umlet Support

Can you add Umlet Diagrams as supported by the Obsidian Kroki Api?

How to submit diagram options to Kroki (eg. graphviz layout)?

Hi,
Thanks for the great plugin. Is there a way to submit diagram options to the Kroki rendering engine? For example, I would like to use a different layout engine for Graphviz (neato rather than the default dot). It looks like Kroki supports this (https://docs.kroki.io/kroki/setup/diagram-options/#_graphviz) but I'm not sure how to set that option from Logseq. Would it be inside the {{}} ? I've tried doing {{renderer code_diagram,graphviz, layout="neato"}} but this doesn't work.
Thanks for your help.

Recommend Projects

  • React photo React

    A declarative, efficient, and flexible JavaScript library for building user interfaces.

  • Vue.js photo Vue.js

    🖖 Vue.js is a progressive, incrementally-adoptable JavaScript framework for building UI on the web.

  • Typescript photo Typescript

    TypeScript is a superset of JavaScript that compiles to clean JavaScript output.

  • TensorFlow photo TensorFlow

    An Open Source Machine Learning Framework for Everyone

  • Django photo Django

    The Web framework for perfectionists with deadlines.

  • D3 photo D3

    Bring data to life with SVG, Canvas and HTML. 📊📈🎉

Recommend Topics

  • javascript

    JavaScript (JS) is a lightweight interpreted programming language with first-class functions.

  • web

    Some thing interesting about web. New door for the world.

  • server

    A server is a program made to process requests and deliver data to clients.

  • Machine learning

    Machine learning is a way of modeling and interpreting data that allows a piece of software to respond intelligently.

  • Game

    Some thing interesting about game, make everyone happy.

Recommend Org

  • Facebook photo Facebook

    We are working to build community through open source technology. NB: members must have two-factor auth.

  • Microsoft photo Microsoft

    Open source projects and samples from Microsoft.

  • Google photo Google

    Google ❤️ Open Source for everyone.

  • D3 photo D3

    Data-Driven Documents codes.