Giter Site home page Giter Site logo

xlsx-chart's Introduction

xlsx-chart

Node.js excel chart builder

Quick start

Install

npm install xlsx-chart

Generate and write chart to file

var XLSXChart = require ("xlsx-chart");
var xlsxChart = new XLSXChart ();
var opts = {
	file: "chart.xlsx",
	chart: "column",
	titles: [
		"Title 1",
		"Title 2",
		"Title 3"
	],
	fields: [
		"Field 1",
		"Field 2",
		"Field 3",
		"Field 4"
	],
	data: {
		"Title 1": {
			"Field 1": 5,
			"Field 2": 10,
			"Field 3": 15,
			"Field 4": 20 
		},
		"Title 2": {
			"Field 1": 10,
			"Field 2": 5,
			"Field 3": 20,
			"Field 4": 15
		},
		"Title 3": {
			"Field 1": 20,
			"Field 2": 15,
			"Field 3": 10,
			"Field 4": 5
		}
	}
};
xlsxChart.writeFile (opts, function (err) {
  console.log ("File: ", opts.file);
});

Generate and download chart data

xlsxChart.generate (opts, function (err, data) {
	res.set ({
	  "Content-Type": "application/vnd.ms-excel",
	  "Content-Disposition": "attachment; filename=chart.xlsx",
	  "Content-Length": data.length
	});
	res.status (200).send (data);
});

Chart types

column, bar, line, area, radar, scatter, pie

Mixing

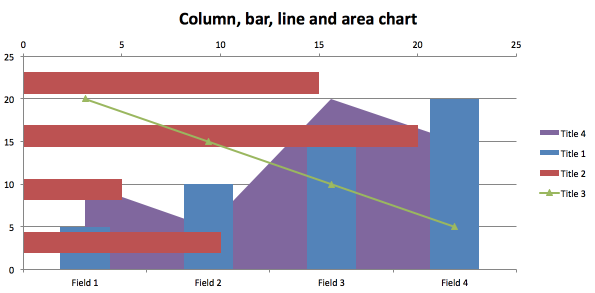
You can mix column, bar, line, area.

Custom template

Default templates: xlsx-chart/template/*.xlsx

var opts = {
	file: "chart.xlsx",
	chart: "column",
	templatePath: __dirname + "/myColumn.xlsx",
	...
};
xlsxChart.writeFile (opts, function (err) {
  console.log ("File: ", opts.file);
});

Multiple charts (one type)

Only column chart. For other types use custom template.

let fs = require ("fs");
let XLSXChart = require ("xlsx-chart");
let xlsxChart = new XLSXChart ();
let opts = {
	charts: [{
		chart: "column",
		titles: [
			"Title 1",
			"Title 2",
			"Title 3"
		],
		fields: [
			"Field 1",
			"Field 2",
			"Field 3",
			"Field 4"
		],
		data: {
			"Title 1": {
				"Field 1": 5,
				"Field 2": 10,
				"Field 3": 15,
				"Field 4": 20
			},
			"Title 2": {
				"Field 1": 10,
				"Field 2": 5,
				"Field 3": 20,
				"Field 4": 15
			},
			"Title 3": {
				"Field 1": 20,
				"Field 2": 15,
				"Field 3": 10,
				"Field 4": 5
			}
		},
		chartTitle: "Title 1"
	}, {
		chart: "column",
		titles: [
			"Title 1",
			"Title 2",
			"Title 3"
		],
		fields: [
			"Field 1",
			"Field 2",
			"Field 3",
			"Field 4"
		],
		data: {
			"Title 1": {
				"Field 1": 5,
				"Field 2": 10,
				"Field 3": 15,
				"Field 4": 20
			},
			"Title 2": {
				"Field 1": 10,
				"Field 2": 5,
				"Field 3": 20,
				"Field 4": 15
			},
			"Title 3": {
				"Field 1": 20,
				"Field 2": 15,
				"Field 3": 10,
				"Field 4": 5
			}
		},
		chartTitle: "Title 2"
	}, {
		chart: "column",
		titles: [
			"Title 1",
			"Title 2",
		],
		fields: [
			"Field 1",
			"Field 2",
			"Field 3",
		],
		data: {
			"Title 1": {
				"Field 1": 15,
				"Field 2": 30,
				"Field 3": 45,
			},
			"Title 2": {
				"Field 1": 5,
				"Field 2": 2,
				"Field 3": 10
			}
		},
		chartTitle: "Title 3"
	}]
};
xlsxChart.generate (opts, function (err, data) {
	fs.writeFileSync ("chart.xlsx", data);
});

Examples

column.js
alt tag
bar.js
alt tag
line.js
alt tag
area.js
alt tag
radar.js
alt tag
scatter.js
alt tag
pie.js
alt tag
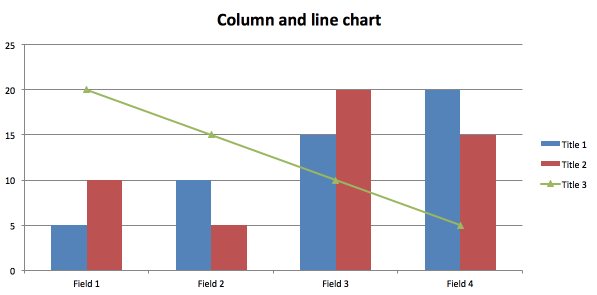
columnLine.js
alt tag
mix.js
alt tag

Author

Dmitriy Samortsev

Copyright and license

MIT

xlsx-chart's People

Contributors

objectum avatar samortsev avatar

Stargazers

 avatar  avatar  avatar  avatar  avatar  avatar  avatar  avatar  avatar  avatar  avatar  avatar  avatar  avatar  avatar  avatar  avatar  avatar  avatar  avatar  avatar  avatar  avatar  avatar  avatar  avatar  avatar  avatar  avatar  avatar  avatar  avatar  avatar  avatar  avatar  avatar  avatar  avatar  avatar  avatar  avatar  avatar  avatar  avatar  avatar  avatar  avatar  avatar  avatar  avatar  avatar  avatar  avatar  avatar  avatar  avatar  avatar  avatar  avatar  avatar  avatar  avatar  avatar  avatar  avatar  avatar  avatar  avatar  avatar  avatar  avatar  avatar  avatar  avatar  avatar  avatar  avatar  avatar  avatar  avatar

Watchers

 avatar  avatar

xlsx-chart's Issues

Define charts save in which sheet

Hello,
I am working on a project and I could see this package. I have multiple charts and my intention is to save each chart in one excel sheet and also add insert the input values of that chart has been made of them into the corresponded sheet. Can I do all of this with XLSX chart?

Many thanks

how to use it with typescript?

I installed it via npm, but I get the following errors:

Compiled with problems:X

ERROR in ./node_modules/assert-plus/assert.js 3:13-30

Module not found: Error: Can't resolve 'assert' in '..\node_modules\assert-plus'
Did you mean './assert'?
Requests that should resolve in the current directory need to start with './'.
Requests that start with a name are treated as module requests and resolve within module directories (node_modules, ..\node_modules).
If changing the source code is not an option there is also a resolve options called 'preferRelative' which tries to resolve these kind of requests in the current directory too.

BREAKING CHANGE: webpack < 5 used to include polyfills for node.js core modules by default.
This is no longer the case. Verify if you need this module and configure a polyfill for it.

If you want to include a polyfill, you need to:
- add a fallback 'resolve.fallback: { "assert": require.resolve("assert/") }'
- install 'assert'
If you don't want to include a polyfill, you can use an empty module like this:
resolve.fallback: { "assert": false }

ERROR in ./node_modules/assert-plus/assert.js 5:13-37

Module not found: Error: Can't resolve 'stream' in '..\node_modules\assert-plus'

BREAKING CHANGE: webpack < 5 used to include polyfills for node.js core modules by default.
This is no longer the case. Verify if you need this module and configure a polyfill for it.

If you want to include a polyfill, you need to:
- add a fallback 'resolve.fallback: { "stream": require.resolve("stream-browserify") }'
- install 'stream-browserify'
If you don't want to include a polyfill, you can use an empty module like this:
resolve.fallback: { "stream": false }

ERROR in ./node_modules/assert-plus/assert.js 7:11-26

Module not found: Error: Can't resolve 'util' in '..\node_modules\assert-plus'

BREAKING CHANGE: webpack < 5 used to include polyfills for node.js core modules by default.
This is no longer the case. Verify if you need this module and configure a polyfill for it.

If you want to include a polyfill, you need to:
- add a fallback 'resolve.fallback: { "util": require.resolve("util/") }'
- install 'util'
If you don't want to include a polyfill, you can use an empty module like this:
resolve.fallback: { "util": false }

ERROR in ./node_modules/backbone/backbone.js

Module not found: Error: Can't resolve 'jquery' in '..\node_modules\backbone'

ERROR in ./node_modules/extsprintf/lib/extsprintf.js 4:17-34

Module not found: Error: Can't resolve 'assert' in '..\node_modules\extsprintf\lib'

BREAKING CHANGE: webpack < 5 used to include polyfills for node.js core modules by default.
This is no longer the case. Verify if you need this module and configure a polyfill for it.

If you want to include a polyfill, you need to:
- add a fallback 'resolve.fallback: { "assert": require.resolve("assert/") }'
- install 'assert'
If you don't want to include a polyfill, you can use an empty module like this:
resolve.fallback: { "assert": false }

ERROR in ./node_modules/extsprintf/lib/extsprintf.js 6:15-30

Module not found: Error: Can't resolve 'util' in '..\node_modules\extsprintf\lib'

BREAKING CHANGE: webpack < 5 used to include polyfills for node.js core modules by default.
This is no longer the case. Verify if you need this module and configure a polyfill for it.

If you want to include a polyfill, you need to:
- add a fallback 'resolve.fallback: { "util": require.resolve("util/") }'
- install 'util'
If you don't want to include a polyfill, you can use an empty module like this:
resolve.fallback: { "util": false }

ERROR in ./node_modules/verror/lib/verror.js 6:15-30

Module not found: Error: Can't resolve 'util' in '..\node_modules\verror\lib'

BREAKING CHANGE: webpack < 5 used to include polyfills for node.js core modules by default.
This is no longer the case. Verify if you need this module and configure a polyfill for it.

If you want to include a polyfill, you need to:
- add a fallback 'resolve.fallback: { "util": require.resolve("util/") }'
- install 'util'
If you don't want to include a polyfill, you can use an empty module like this:
resolve.fallback: { "util": false }

ERROR in ./node_modules/xlsx-chart/chart.js 7:9-22

Module not found: Error: Can't resolve 'fs' in '..\node_modules\xlsx-chart'

ERROR in ./node_modules/xlsx-chart/chart/base.js 11:9-22

Module not found: Error: Can't resolve 'fs' in '..\node_modules\xlsx-chart\chart'

ERROR in ./node_modules/xlsx-chart/chart/columnAvg.js 11:9-22

Module not found: Error: Can't resolve 'fs' in '..\node_modules\xlsx-chart\chart'

ERROR in ./node_modules/xlsx-chart/chart/columnGroup.js 11:9-22

Module not found: Error: Can't resolve 'fs' in '..\node_modules\xlsx-chart\chart'

ERROR in ./node_modules/xlsx-chart/chart/columnGroupAvg.js 11:9-22

Module not found: Error: Can't resolve 'fs' in '..\node_modules\xlsx-chart\chart'

ERROR in ./node_modules/xml2js/lib/parser.js 38:17-47

Module not found: Error: Can't resolve 'timers' in '..\node_modules\xml2js\lib'

BREAKING CHANGE: webpack < 5 used to include polyfills for node.js core modules by default.
This is no longer the case. Verify if you need this module and configure a polyfill for it.

If you want to include a polyfill, you need to:
- add a fallback 'resolve.fallback: { "timers": require.resolve("timers-browserify") }'
- install 'timers-browserify'
If you don't want to include a polyfill, you can use an empty module like this:
resolve.fallback: { "timers": false }

Question about angular compatibility

Hello,

I'm working on an Angular 11 webapp, and iwas looking for a library that could help me to export data as an Excel chart. I found your lib but it's for Node.JS only. I saw on Internet that to be able to use this one in Angular it's necessary to have a*.d.ts file that is used to declare the types of the variables used, etc.

Do you plan to do it ?

Best regards,
Stefan

Does this package still works?

I'm trying some examples.
Generated file has 2 sheets (Chart + Table).
Chart is empty.
Table has the correct info.
Any idea on why the chart does not appear? (trying a Pie chart, but tested others)

generateMult is not available in the package 0.4.2 from NPM

The feature with generation of multiple charts that is mentioned in mult.js (master branch) is absolutely brilliant:

xlsxChart.generate({
   charts: [
      opts1, opt2
   ],
   function (err, data) {}
})

Unfortunately package 0.4.2 available via NPM does not contain the implementation of generateMult in base.js. Although it contains mult.js.
Could you please release this feature.

Each chart on a sheet

Hello,
I want to generate each chart (pie, column, line) on a sheet. Is it possible ??
I want to generate Pie on a sheet, column on a sheet, line on a sheet. How can I do it??
PLZZZZ ANSWER ASAP

'extend' of undefined for Backbone.Model.extend

var XLSXChart = require ("xlsx-chart");

when running the following line the code breaks on the .extend part, stating that the Backbone.Model is undefined. Do you have a clue as to what is happening?

Insert chart in existing xlsx file

Hello,
I wanted to know if it is possible to use this to output chart to be integrated in another xlsx for report.
We have an existing report generated automatically and want to integrate chart along with other informations. How can we do that using xlsx-chart.
Thanks

Resize issue and unable to move the chart

Hi @objectum and @samortsev , I am using xlsx-chart package in node.js to create charts in excel. But I am unable to reduce the size of chart and I want to create a chart in the right side of the sheet. I am unable to do that. So please help me how to do this ASAP. I am using the below code

var fs = require ("fs");
var XLSXChart = require ("./../chart");
var xlsxChart = new XLSXChart ();
var opts = {
titles: [
"Title 1",
"Title 2",
"Title 3"
],
fields: [
"Field 1",
"Field 2",
"Field 3",
"Field 4"
],
data: {
"Title 1": {
"chart": "column",
"Field 1": 5,
"Field 2": 10,
"Field 3": 15,
"Field 4": 20
},
"Title 2": {
"chart": "column",
"Field 1": 10,
"Field 2": 5,
"Field 3": 20,
"Field 4": 15
},
"Title 3": {
"chart": "line",
"Field 1": 20,
"Field 2": 15,
"Field 3": 10,
"Field 4": 5
}
},
chartTitle: "Column and line chart"
};
xlsxChart.generate (opts, function (err, data) {
if (err) {
console.error (err);
} else {
fs.writeFileSync ("columnLine.xlsx", data);
console.log ("columnLine.xlsx created.");
};
});

Getting error when use multiple charts

I have an issue when create multiple charts, can anyone help me..
this is my opts below
`
const opts = {

      charts: [
        {
          chart: 'line',
          titles: ['inside', 'outside'],
          fields: [
            '29-06-2022, 14:15:01',
            '29-06-2022, 14:30:10',
          ],
          data: {
            outside: {
              '29-06-2022, 14:15:01': 44,
              '29-06-2022, 14:30:10': 42,
            },
            inside: {
              '29-06-2022, 14:15:01': 37,
              '29-06-2022, 14:30:10': 35,
            },
          },
          chartTitle: 'Temperature',
        },
        {
          chart: 'column',
          titles: ['inside', 'outside'],
          fields: [
            '29-06-2022, 14:15:01',
            '29-06-2022, 14:30:10',
          ],
          data: {
            outside: {
              '29-06-2022, 14:15:01': 66,
              '29-06-2022, 14:30:10': 67,
            },
            inside: {
              '29-06-2022, 14:15:01': 91,
              '29-06-2022, 14:30:10': 92,
            },
          },
          chartTitle: 'humidity',
        },
      ],
    };`

and i get error like this below:

TypeError: Cannot set properties of undefined (setting 'c:ser') at /Users/haialison/IdeaProjects/digifarm-be/node_modules/xlsx-chart/chart/base.js:509:83 at Function.each (/Users/haialison/IdeaProjects/digifarm-be/node_modules/underscore/underscore-node-f-pre.js:1321:7) at /Users/haialison/IdeaProjects/digifarm-be/node_modules/xlsx-chart/chart/base.js:494:6 at /Users/haialison/IdeaProjects/digifarm-be/node_modules/xlsx-chart/chart/base.js:20:4 at Parser.<anonymous> (/Users/haialison/IdeaProjects/digifarm-be/node_modules/xml2js/lib/parser.js:304:18) at Parser.emit (node:events:390:28) at SAXParser.onclosetag (/Users/haialison/IdeaProjects/digifarm-be/node_modules/xml2js/lib/parser.js:262:26) at emit (/Users/haialison/IdeaProjects/digifarm-be/node_modules/sax/lib/sax.js:624:35) at emitNode (/Users/haialison/IdeaProjects/digifarm-be/node_modules/sax/lib/sax.js:629:5) at closeTag (/Users/haialison/IdeaProjects/digifarm-be/node_modules/sax/lib/sax.js:889:7)

XLSX-CHART cannot graphic simple JSON

I have this JSON:

{ MASCULINO: 36, FEMENINO: 64, 'NO GENERO': 0 }

But the XLSX-CHART cannot graphic it...

const config = {
  chart: 'column',
  titles: ['MASCULINO', 'FEMENINO', 'NO GENERO'],
  fields: ['MASCULINO', 'FEMENINO', 'NO GENERO'],
  data: { MASCULINO: 36, FEMENINO: 64, 'NO GENERO': 0 },
  chartTitle: `Graphic`
};

xlsxChart.generate(config, (err, excel) => {
  response.set({
    'Content-Type': 'application/vnd.ms-excel',
    'Content-Disposition': `attachment; filename=test.xlsx`,
    'Content-Length': excel.length
  });
  response.status(200).send(excel);
});

How can i resolve this?

This is the excel:

CAPTURE EXCEL

Numbers issue for horizontal axis

Hi,

It seems there is an issue with placing numbers for the horizontal axis!
It adds a single quotation (') to the beginning of the first cell in the row.

I came up with a solution by checking the type of field, if it is a number, no need to include the t field. as you see HERE.

I create a pr!

Recommend Projects

  • React photo React

    A declarative, efficient, and flexible JavaScript library for building user interfaces.

  • Vue.js photo Vue.js

    ๐Ÿ–– Vue.js is a progressive, incrementally-adoptable JavaScript framework for building UI on the web.

  • Typescript photo Typescript

    TypeScript is a superset of JavaScript that compiles to clean JavaScript output.

  • TensorFlow photo TensorFlow

    An Open Source Machine Learning Framework for Everyone

  • Django photo Django

    The Web framework for perfectionists with deadlines.

  • D3 photo D3

    Bring data to life with SVG, Canvas and HTML. ๐Ÿ“Š๐Ÿ“ˆ๐ŸŽ‰

Recommend Topics

  • javascript

    JavaScript (JS) is a lightweight interpreted programming language with first-class functions.

  • web

    Some thing interesting about web. New door for the world.

  • server

    A server is a program made to process requests and deliver data to clients.

  • Machine learning

    Machine learning is a way of modeling and interpreting data that allows a piece of software to respond intelligently.

  • Game

    Some thing interesting about game, make everyone happy.

Recommend Org

  • Facebook photo Facebook

    We are working to build community through open source technology. NB: members must have two-factor auth.

  • Microsoft photo Microsoft

    Open source projects and samples from Microsoft.

  • Google photo Google

    Google โค๏ธ Open Source for everyone.

  • D3 photo D3

    Data-Driven Documents codes.