Comments (17)
 YihaoWEI
commented on May 7, 2024
8
YihaoWEI
commented on May 7, 2024
8
Thanks brunoalr! I have already made it realized using .gdbinit inside VSCode. It works very well as usual.
I'm studying inside VSCode to see if it is possible to make it as a plug-in tool.
Hope I can finish it soon :D
from openimagedebugger.
 mwwzbinf
commented on May 7, 2024
1
mwwzbinf
commented on May 7, 2024
1
vscode+wsl2, debug from console, What should I do?

I like image watch very much under windows, but It was very frustrating for me under linux
from openimagedebugger.
 dakhouya
commented on May 7, 2024
1
dakhouya
commented on May 7, 2024
1
@brunoalr @mwwzbinf, It's not a plugin for vscode but I'm working on an integration using devcontainer-features which integrates with devcontainers quite easily. I start the project here: dakhouya/devcontainer-features
It is still a work in progress and I mainly use it to debug c++ code with gbd so maybe there's thing missing for lldb.
References for the devcontainers
https://code.visualstudio.com/docs/devcontainers/containers
https://containers.dev/overview
from openimagedebugger.
 brunoalr
commented on May 7, 2024
brunoalr
commented on May 7, 2024
Hi, @YihaoWEI thanks for getting in touch and using our project, we are really happy to hear that :D
Yes, I think it is possible to package it as a plugin for a few IDEs (VSCode, CLion/AndroidStudio, Atom and whatnot). We have the intention to do so indeed, but we do not have concrete plans yet as we currently do not have enough free time to do so. We also want to explore other types of packaging such as Debian packages.
So, answering your last question directly: contributions are definitely welcome :D It would be really nice to set up an architecture that enables different packaging targets.
Also, I believe OID should work out-of-the-box with VSCode if you add the "source" command to your .gdbinit or .lldbinit file. I will test it as soon as I can and then I will keep you updated.
from openimagedebugger.
 github-actions
commented on May 7, 2024
github-actions
commented on May 7, 2024
Stale issue message
from openimagedebugger.
 wuwuzhijing
commented on May 7, 2024
wuwuzhijing
commented on May 7, 2024
@YihaoWEI
python /path/oid.py --test works well.
Then i tried source /path/oid.py, but got an error:
Any ideas?
from openimagedebugger.
brunoalr
commented on May 7, 2024
@wuwuzhijing please follow the instructions from the readme: https://github.com/OpenImageDebugger/OpenImageDebugger#building-the-open-image-debugger
For gdb, you have to call source /path/oid.py when running gdb or add this line to ~/.gdbinit
from openimagedebugger.
wuwuzhijing
commented on May 7, 2024
@brunoalr
Also added source /path/oid.py to ~/.gdbinit, but no GUI appeared when running gdb(I am sure that Mat in buffer exists).
P.S. I followed the readme very strict. After getting rid of a lot of envirment error, still not working.
from openimagedebugger.
wuwuzhijing
commented on May 7, 2024
@brunoalr
Can you figure out the problem?
from openimagedebugger.
brunoalr
commented on May 7, 2024
@wuwuzhijing I can help :)
I need more information first:
- OID's commit hash
- operating system and version
- gdb version
- lldb version
- python2 and python3 versions
- more detailed reproduction steps and error messages, if possible
(I actually plan to create an issue template to ask for this kind of information :) )
from openimagedebugger.
wuwuzhijing
commented on May 7, 2024
@brunoalr
Thank you for your attention.
basic config
OID commit hash
1ba720cf9ad6ab8e3e0f3455ed41bd337b4e6f74
OS
Ubuntu 20.04.1
gdb version
9.2
python3 version
3.8.8
python2 version
2.7.18
reproduction steps
- build
git clone https://github.com/OpenImageDebugger/OpenImageDebugger.git
cd OpenImageDebugger
git submodule init
git submodule update
mkdir build && cd build
cmake ..
make -j4
make install
- settings
source /mypath/OpenImageDebugger/oid.py - open VSCode and open CMake project
- Set gdb debug file(that is launch.json) as follows:

- Set Breakpoint
- Press F5, debug start
- Press F10, debug step by step. Here, no gui appeared.
If you need more info. , I will add later.
from openimagedebugger.
brunoalr
commented on May 7, 2024
Thanks for the information!
settings
source /mypath/OpenImageDebugger/oid.py
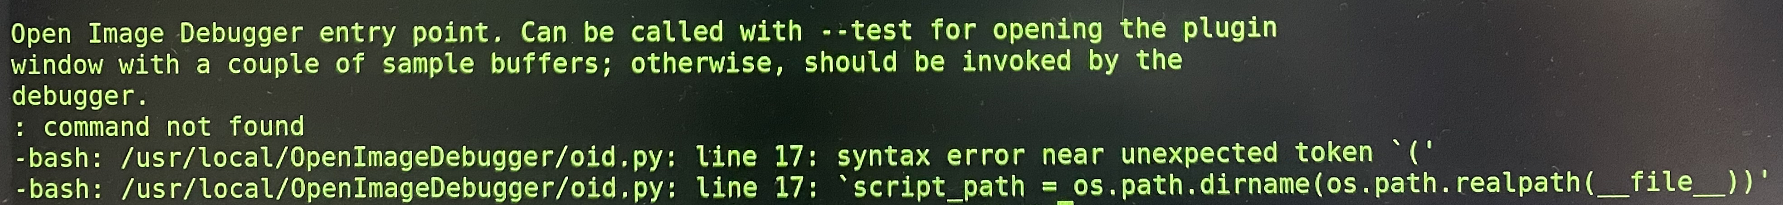
I tried to reproduce it on my machine and I get a similar error messages when calling source oid.py via bash.
source /tmp/OpenImageDebugger/oid.py
/tmp/OpenImageDebugger/oid.py:5: command not found: \nOpen Image Debugger entry point. Can be called with --test for opening the plugin\nwindow with a couple of sample buffers; otherwise, should be invoked by the\ndebugger.\n

^C^C^C/tmp/OpenImageDebugger/oid.py:17: no matches found: os.path.dirname(os.path.realpath(__file__))
/tmp/OpenImageDebugger/oid.py:18: number expected
In this case, source is a gdb command instead of a *sh command. More info here: https://sourceware.org/gdb/onlinedocs/gdb/Command-Files.html
Two things I want to verify:
- Can you run
cat ~/.gdbinitand paste the output here? - After reproduction step 6) can you call
source /mypath/OpenImageDebugger/oid.pyon the gdb console? (I am not familiar with the exact steps to access the gdb console inside Visual Studio)
from openimagedebugger.
wuwuzhijing
commented on May 7, 2024
@brunoalr
Thank you.
cat ~/.gdbinit

gdb console out after 6)

from openimagedebugger.
brunoalr
commented on May 7, 2024
@wuwuzhijing this seems to be right. Were you able see the GUI afterwards?
As far as I remember, there was no need for IDE hooks for OID to work with VSCode, but it is been a while. If I get some free time I will try to debug the TestBench under VSCode - usually I use gdb from the CLI :)
from openimagedebugger.
wuwuzhijing
commented on May 7, 2024
@brunoalr
NO GUI.
I can only try CLI before you figure out the problem of this tool using under VSCode.
from openimagedebugger.
wuwuzhijing
commented on May 7, 2024
@brunoalr
I still wander, now that the source /path/oid.py works unnormal, how did you make it from the CLI? Can you paste a brief step instruction?
from openimagedebugger.
brunoalr
commented on May 7, 2024
Interesting idea! I will take a look at it when I have time.
from openimagedebugger.
Related Issues (20)
- Late initialization of image structs HOT 3
- An error occurred while compiling HOT 6
- Windows version crushes with error message: The procedure entry point ?edit@QAbs......... HOT 1
- AttributeError: 'NoneType' object has no attribute 'GetSelectedTarget' HOT 4
- Eigen matrices are not working, python crashes in gdb (solution is a one liner) HOT 4
- Error while building with Qt < 5.11 HOT 6
- Invalid plotting of OpenCV matrices HOT 4
- OpenCV matrix inside `std::vector` is not displayed in LLDB HOT 3
- Add support for newer lldb API HOT 1
- Solve LGTM alerts
- Add support for pdb
- Fine tune activity bot
- Remove qmake support in September 2021
- Eclipse IDE and embedded image processing projects debuging (MCU) HOT 1
- create a new Qt Widgets Application instead of the current plug-in HOT 2
- cannot debug and continuing report waitforbyteswirtten HOT 1
- Add observable symbols in (this) class.
- how to build on HOT 1
- Add support to VSCode WSL remote HOT 10
- Cannot view Eigen::MatrixXf when using CodeLLDB HOT 7
Recommend Projects
-
 React
React
A declarative, efficient, and flexible JavaScript library for building user interfaces.
-
Vue.js
🖖 Vue.js is a progressive, incrementally-adoptable JavaScript framework for building UI on the web.
-
 Typescript
TypeScript is a superset of JavaScript that compiles to clean JavaScript output.
-
TensorFlow
An Open Source Machine Learning Framework for Everyone
-
Django
The Web framework for perfectionists with deadlines.
-
 Laravel
A PHP framework for web artisans
-
D3
Bring data to life with SVG, Canvas and HTML. 📊📈🎉
-
Recommend Topics
-
javascript
JavaScript (JS) is a lightweight interpreted programming language with first-class functions.
-
web
Some thing interesting about web. New door for the world.
-
server
A server is a program made to process requests and deliver data to clients.
-
Machine learning
Machine learning is a way of modeling and interpreting data that allows a piece of software to respond intelligently.
-
Visualization
Some thing interesting about visualization, use data art
-
Game
Some thing interesting about game, make everyone happy.
Recommend Org
-
Facebook
We are working to build community through open source technology. NB: members must have two-factor auth.
-
Microsoft
Open source projects and samples from Microsoft.
-
Google
Google ❤️ Open Source for everyone.
-
Alibaba
Alibaba Open Source for everyone
-
D3
Data-Driven Documents codes.
-
Tencent
China tencent open source team.
from openimagedebugger.