predictionmachines / interactivedatadisplay Goto Github PK
View Code? Open in Web Editor NEWInteractive Data Display for JavaScript
Home Page: http://predictionmachines.github.io/InteractiveDataDisplay
License: Other
Interactive Data Display for JavaScript
Home Page: http://predictionmachines.github.io/InteractiveDataDisplay
License: Other

![dependabot[bot] avatar](https://avatars.githubusercontent.com/in/29110?v=4 "dependabot[bot]")


Open sample samples/viewer/Band.html.
Unlock navigation (on right navigation panel).
Add a probe on chart.
Now you can zoom a chart regardless of the position of cursor (left panel, right panel, under the chart).
It is expected that you can zoom chart only when the cursor is on chart.
expected:
The page is loaded
actual:
the page is blank
Hence when IDD package is used from another component through bower, the dependencies are not installed.
Now idd.markers.uncertain.js contains 3 similar marker shapes:
InteractiveDataDisplay.Markers.shapes["boxwhisker"] = InteractiveDataDisplay.BoxWhisker;
 InteractiveDataDisplay.Markers.shapes["boxnowhisker"] = InteractiveDataDisplay.BoxNoWhisker;
 InteractiveDataDisplay.Markers.shapes["whisker"] = InteractiveDataDisplay.Whisker;
They can be combined into a single shape,
@ElenaPochernina Please see https://github.com/predictionmachines/InteractiveDataDisplay/wiki/Area:
I would like to have a chart with a legend, where legend shows color palette.
The palette itself has an axis with ticks.
I want to make that ticks smaller than ticks of the chart's axes.
Now it is impossible, since tick size is a global settings which cannot be tuned for an individual axis.
These settings are in idd.settings.js, InteractiveDataDisplay.tickLength.

When I pull the first probe it isn't visible under the cursor (it disappears until I put it on chart). Other probes (second, third etc) works as they should.
As an end-user of the ChartViewer,
I want it to retain certain settings which I change during my interaction with the ChartViewer, such as
so that when I reload the page (or leave and then return) I would see the same settings.
Repro: open http://predictionmachines.github.io/InteractiveDataDisplay/all-samples.html in a chromium-based browser, select some text, try dragging a cart.
Observed: mouse cursor turns into "text selection" cursor

Expected: mouse cursor either does not change at all or change into something appropriate.
As a developer using IDD,
I want that if my IDD plot instance has text label element (the element can have any placement of left, top, right, bottom), it is included to the exported SVG for this plot,
so that I get SVG image identical to the original plot.
The page https://predictionmachines.github.io/InteractiveDataDisplay/sample-dynline.html does not show dynamically changing plot.
The bower documentation: https://github.com/bower/spec/blob/master/json.md#main
In particular, it is said Only one file per filetype.
The "main" of IDD's bower.json includes two *.js files.
DOM plot doesnt update attribute data-idd-origin, when IDD API is used(method add).
Simple markers looks wrong in Chrome browser.

Chrome Version 45.0.2454.93 m
Removing plots causes the following code to execute:
var removeLegendItem = function (i) {
                    var legend = plotLegends[i];
                    plotLegends.splice(i, 1);
                    removeLegend(legend);
                    legend.plot.host.unbind("childrenChanged", childrenChangedHandler);
                    legend.plot.host.unbind("visibleChanged", visibleChangedHandler);
                    if (legend.onLegendRemove) legend.onLegendRemove();
                    legend[0].innerHTML = "";
                    if (isCompact) legend.removeClass("idd-legend-item-compact");
                    else legend.removeClass("idd-legend-item");
                    _jqdiv[0].removeChild(legend[0]);
                    var childDivs = legend.plot.children;
                    childDivs.forEach(function (childPlot) {
                        for (var j = 0, len = plotLegends.length; j < len; j++)
                            if (plotLegends[j].plot === childPlot) {
                                removeLegendItem(plotLegends[j]);
                            }
                    });
                    legend[0].style = "display: none";
                    if (plotLegends.length == 0) divStyle.display = "none";
                };
                for (var i = 0, len = plotLegends.length; i < len; i++)
                    if (plotLegends[i].plot === params.plot) {
                        removeLegendItem(i);
                        break;
The bold line causes error in IE11 and Edge:
SCRIPT5045: Assignment to read-only properties is not allowed in strict mode
idd.js (2177,21)
See https://travis-ci.org/itislab/InteractiveDataDisplay/builds/122745386
E.g. Band.ts references utils.ts however file actually named Utils.ts
All Axes has "remove" method it their API which should be called in order to delete axis. However, it will not remove axis's div from plot. You need to manually call "plot.removeDiv(axisDiv)" to finally remove all axis contents from plot, which is not at least documented.
In Geographical heatmap sample (http://predictionmachines.github.io/InteractiveDataDisplay/sample-geoheatmap.html) heatmap plot and vertical axis doesn't have Mercator transform as YDataTransform and thus placed incorrectly on map.
How to reproduce:
markers.draw({x:[1,2,3], y:[1,2,3]}). You should see three markers in a chart.markers.draw({x:[], y:[]).Expected: chart without any marker
Observed: three markers; same image as after step 2.
Workaround: To clear markers, call markers.getContext(true). This is safe since has no side effects except clearing the screen.
Run grunt jasmine and open test/SpecRunner.html.
The output is:
InteractiveDataDisplay.Plot should remove plots when corresponding dom elements are removed
Expected 0 to be 1.
Error: Expected 0 to be 1.
    at stack (http://localhost:6822/ext/jasmine/lib/jasmine-core/jasmine.js:1482:17)
    at buildExpectationResult (http://localhost:6822/ext/jasmine/lib/jasmine-core/jasmine.js:1452:14)
    at Spec.Env.expectationResultFactory (http://localhost:6822/ext/jasmine/lib/jasmine-core/jasmine.js:583:18)
    at Spec.addExpectationResult (http://localhost:6822/ext/jasmine/lib/jasmine-core/jasmine.js:324:34)
    at Expectation.addExpectationResult (http://localhost:6822/ext/jasmine/lib/jasmine-core/jasmine.js:533:21)
    at Expectation.toBe (http://localhost:6822/ext/jasmine/lib/jasmine-core/jasmine.js:1406:12)
    at plot.onChildrenChanged (http://localhost:6822/test/plotTests.js:43:40)
    at addChild (http://localhost:6822/dist/idd.js:987:18)
    at http://localhost:6822/dist/idd.js:550:32
    at Array.forEach (native)
Error: Timeout - Async callback was not invoked within timeout specified by jasmine.DEFAULT_TIMEOUT_INTERVAL.
Error: Timeout - Async callback was not invoked within timeout specified by jasmine.DEFAULT_TIMEOUT_INTERVAL.
    at http://localhost:6822/ext/jasmine/lib/jasmine-core/jasmine.js:1812:23
As a user of IDD I want markers to be rendered in a web worker on a background and navigation using the previously rendered image so that I could use IDD to interactively (with smooth navigation) display 10k of petals (i.e. uncertain size of markers).
In a similar way it is done for the heatmap plot.
See https://github.com/predictionmachines/InteractiveDataDisplay/blob/master/src/css/chartViewer.css
It contains styles for html and body elements therefore I cannot include it to my html page without overriding these styles explicitly otherwise it changes appearance of my page.
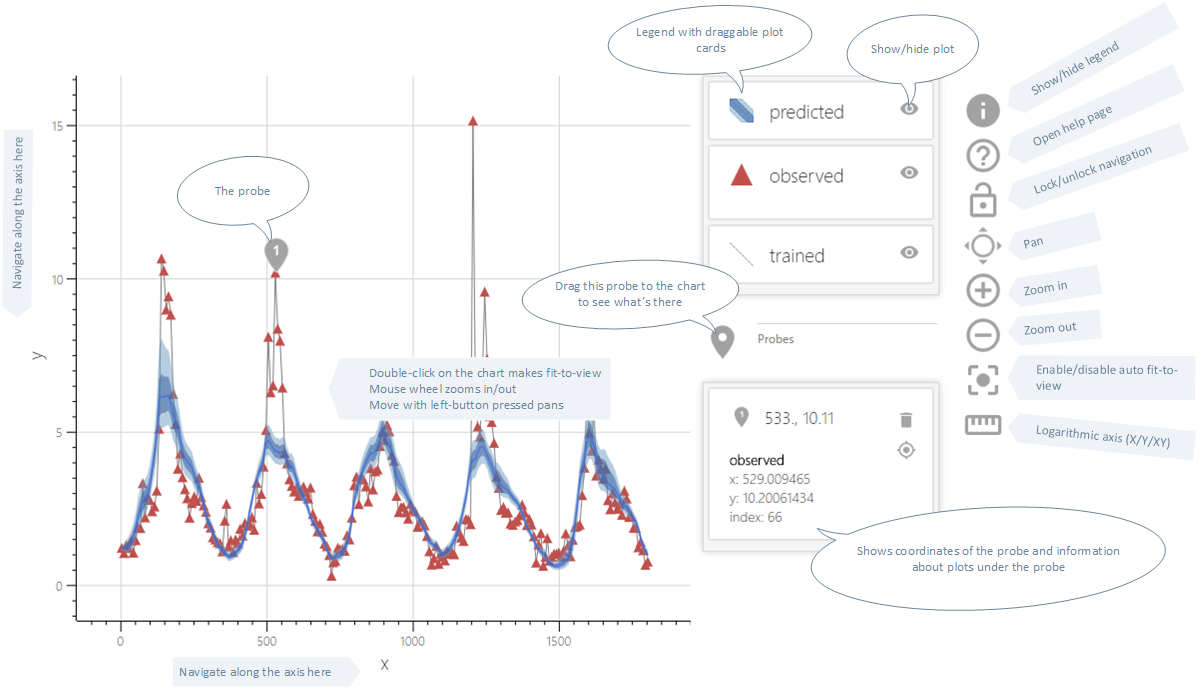
samples/viewer/Combine three plots with NPZ data.htmlExpected: the probe with number 1 is created and shown on the probes panel with details about the marker.
Observed:

After panning:

Heatmap SVG has the same resolution as an original IDD heatmap.
As IDD user, I want to see high-resolution SVG heatmap even if the original IDD heatmap is low-resolution. So I propose generating a high-resolution heatmap when exporting SVG.
Open samples/Color uncertain data.html.

The drawing values don't normalize to range [0,1].
Expected:

I suggest to add a markdown file(s) describing all available plot types and their settings.
As IDD chart user, I want the legend control that is drawn inside the chart and above all plots to become fully (incl. palettes) transparent when the mouse cursor is outside the legend control and fully opaque on mouse hover, so that I could see the data below the legend control and still able to see what the legend shows me.
Two improvements:
At http://predictionmachines.github.io/InteractiveDataDisplay:
Make "More samples..." more visible: larger margins and probable larger.
At http://predictionmachines.github.io/InteractiveDataDisplay/all-samples.html:
Be more descriptive. E.g. "Bull-eyes" says nothing; it should be "Uncertain data series shown as bull-eyes" with some short text description below the title.
Use flex-box for layout of samples.
Expected: the "x" label on the horizontal axis is fully visible
Observed: the "x" label is visible partially

Open samples/viewer/Error Bars.html.
Expected: entire markers are within the visible region.
Observed: some whiskers go outside the visible region.
This is because the shape doesn't override getBoundingBox method to include length of the markers.

How to reproduce:
Expected: Coordinates of the cursor should be like "0.75, 0.69" for the given axis ranges.
Observed: Coordinates are of maximum double precision. See the screenshot:

Problem:
IDD Axis is really slow, especially in IE/Edge.
For example, try profile "samples/Navigation%20Panel.html". In Edge on my machine I see that at least 52% of Inclusive CPU (%) is consumed by axis' updatePlotsOutput -> measure.
It should be investigated if the div positioning takes too much or the iterative tick selection algorithm is too heavy.
IDD Axis cannot be transformed to SVG in general due to it can contain any HTML as labels.
For example, log axis uses HTML to render exponential form of a value.
Solution:
The axis is rendered completely to canvas with additional renderer of a snapshot to SVG which re-uses the canvas-based layout. We could take font settings from CSS style to make labels customizable. Or probably use SVG as the only renderer at all.
There are two sides of the issue:
markers()) do not add the data-idd-plot attribute when constructing div for a plot. In this case, the plot is not duplicated but in the DOM the plot host element has no attribute. This is not good because: this.markers = function (name, data, titles) {
var plot = this.get(name);
if (!plot) {
var div = $("<div></div>")
.attr("data-idd-name", name)
.appendTo(this.host);
plot = new InteractiveDataDisplay.Markers(div);
this.addChild(plot);
}
if (data !== undefined) {
plot.draw(data, titles);
}
return plot;
}; polyline()) add the attribute. In this case it is detected by the IDD infrastructure and it initializes an extra copy of Plot instance; so the single DOM element has two logical plots. And they both appear in the legend. this.polyline = function (name, data) {
var plot = this.get(name);
if (!plot) {
var div = $("<div></div>")
.attr("data-idd-name", name)
.attr("data-idd-plot", "polyline")
.appendTo(this.host);
plot = new InteractiveDataDisplay.Polyline(div, this.master);
this.addChild(plot);
}
if (data !== undefined) {
plot.draw(data);
}
return plot;
}; How to reproduce
Open samples\Add and Remove plots using API.html and click the button Add Chart, then Draw polyline.
The single call
chart.polyline("polyline", { y: [0.1, 0.2, 0.0, 0.3, 0.2, 0.1, 0.3] });
causes two plots for a single DOM element.

Expected: the plot has colors, as when open in Edge
Observed: the plot is black

Plot has two events of children change notification InteractiveDataDisplay.Event.childrenChanged and plot.onChildrenChanged implemented in different notification techniques.
e.g. See line 572 of idd.base.js
            this.fireChildrenChanged({ type: "add", plot: childPlot });
this.onChildrenChanged({ type: "add", plot: childPlot });I propose to show nearest exact point among input data series for the probe location in probe text and visually on a chart:

@ElenaPochernina, I see that in the NavigationPanel there is no "remove" method (or "destroy", "dispose") which would unsubscribe it from events and clear the DOM object.
In the sample you just create an object and don't even keep the reference to it. Still I might want to remove the panel if show it dynamically on my page.
        $(document).ready(function () {
            var chart = InteractiveDataDisplay.asPlot($("#chart"));
            var navigation = $('#navigationPanel');
            InteractiveDataDisplay.NavigationPanel(chart, navigation);
The suggestion is to add the NavigationPanel.remove() method which unsubscribe it from events and clears the DOM object.
@ElenaPochernina
Try this in IDD 1.2.0:
<body>
    <div id="chart" data-idd-plot="figure" data-idd-legend="legend" style="width: 800px; height: 600px;">
        <div id="grid" data-idd-plot='grid' data-idd-placement='center' data-idd-style='stroke: DarkGray; thickness: 1px'></div>
        <div id="axis1" data-idd-axis="numeric" data-idd-placement="bottom"></div>
        <div id="axis2" data-idd-axis="numeric" data-idd-placement="left"></div>

        <div data-idd-name="bars" data-idd-plot="markers"></div>
        <div id="legend" data-idd-placement='center' style="float: right"></div>
    </div>
</body>
</html>
with code
        $(document).ready(function () {
            var bars = InteractiveDataDisplay.asPlot("chart").get("bars");
            var figure = InteractiveDataDisplay.asPlot("chart")


            var bottomAxis = figure.getAxes("bottom")[0];
            var leftAxis = figure.getAxes("left")[0];

            // If you need grid lines on the background:
            var grid = figure.get("grid");
            grid.xAxis = bottomAxis;
            grid.yAxis = leftAxis;


            // Enables navigation by setting navigation gesture source:
            var gestureSource = InteractiveDataDisplay.Gestures.getGesturesStream(figure.centralPart);
            // If you need navigation over axes:
            var bottomAxisGestures = InteractiveDataDisplay.Gestures.applyHorizontalBehavior(InteractiveDataDisplay.Gestures.getGesturesStream(bottomAxis.host));
            var leftAxisGestures = InteractiveDataDisplay.Gestures.applyVerticalBehavior(InteractiveDataDisplay.Gestures.getGesturesStream(leftAxis.host));

            figure.navigation.gestureSource = gestureSource.merge(bottomAxisGestures.merge(leftAxisGestures));

            var x = new Array(N);
            var y = new Array(N);
            var color = new Array(N);

            var colorPalette = InteractiveDataDisplay.ColorPalette.parse("#69D2E7,#A7DBD8,#E0E4CC,#F38630,#FA6900");

            for (var i = 0; i < N; i++) {
                y[i] = Math.random() * N - N / 2;
                color[i] = y[i];
            }
            bars.draw({ y: y, color: color, colorPalette: colorPalette, , shadow: 'grey' },
                { color: "rate" });
        });
And I get

How to reproduce:
Expected:
It is seen from the image that the range of y is about 0..15 and it seems that 10-8 is too much.
Touch devices don't support fit to view using double tap.
Drag and drop doesn't work with touch events. See sample with ChartViewer.
How to reproduce:
Open samples/Nested Charts.html
Observed:
The nested chart is transparent

Expected:
The nestsed chart should have white background ("white" is taken from the appropriate CSS class).
https://github.com/predictionmachines/InteractiveDataDisplay/wiki/Markers
Please add expected structure for the sizePalette
In different browser it looks in different way, but still incorrectly: layout is shifted, some parts disappear.
How to reproduce
samples/viewer/Error Bars.html in Chrome

Expected: The preview should look similar to the browser window.
Observed: The preview image has following issues:
Open samples/DOM elements in a plot.html.
Observed:
When I hover the mouse pointer over the label "Start of the curve" it doesn't become bold.
Expected:
It must become bold because there is an appropriate CSS style in the HTML file:
    <style>
        .idd-dom-marker:hover
        {
            font-weight:bold;
        }
    </style>
It seems that the same problem is with NestedChartAsDomPlot.html: the nested chart doesn't reacts on navigation gestures but propagates them through to the outer plot.
When creating InteractiveDataDisplay.ColorPaletteViewer for an absolute palette with custom range, it is still shown with range from 0 to 1.
var paletteViewer = new InteractiveDataDisplay.ColorPaletteViewer(
    divElement,
    InteractiveDataDisplay.ColorPalette.parse("reg,green,blue").absolute(-10, 10),
    {
        axisVisible: true,
        width: 180,
        height: 10
    });
Pass null to the constructor function and then assign the palette to the created instance:
var paletteViewer = new InteractiveDataDisplay.ColorPaletteViewer(
    divElement,
    null,
    {
        axisVisible: true,
        width: 180,
        height: 10
    });
paletteViewer.palette = InteractiveDataDisplay.ColorPalette.parse("reg,green,blue").absolute(-10, 10);
The widget InteractiveDataDisplay.ColorPaletteViewer is constructed from a palette, but assigns the given parameter to an inner field after a while; still it is used before assignment:
InteractiveDataDisplay.ColorPaletteViewer = function (div, palette, options) {
...
     function addAxis() {
...
        if (_palette && !_palette.isNormalized) // Take axis values from fixed palette
            _axis.update({ min: _palette.range.min, max: _palette.range.max });
...
    }
...
    if (_axisVisible)
        addAxis();
...
    var _palette = palette;
...
Travis build fails with "No tag found that was able to satisfy ~2.3.5"
This is about SVGjs
The ChartViewer's PlotRegistry duplicates the registry of IDD and can be eliminated.
A declarative, efficient, and flexible JavaScript library for building user interfaces.
🖖 Vue.js is a progressive, incrementally-adoptable JavaScript framework for building UI on the web.
TypeScript is a superset of JavaScript that compiles to clean JavaScript output.
An Open Source Machine Learning Framework for Everyone
The Web framework for perfectionists with deadlines.
A PHP framework for web artisans
Bring data to life with SVG, Canvas and HTML. 📊📈🎉
JavaScript (JS) is a lightweight interpreted programming language with first-class functions.
Some thing interesting about web. New door for the world.
A server is a program made to process requests and deliver data to clients.
Machine learning is a way of modeling and interpreting data that allows a piece of software to respond intelligently.
Some thing interesting about visualization, use data art
Some thing interesting about game, make everyone happy.
We are working to build community through open source technology. NB: members must have two-factor auth.
Open source projects and samples from Microsoft.
Google ❤️ Open Source for everyone.
Alibaba Open Source for everyone
Data-Driven Documents codes.
China tencent open source team.