Giter Site home page Giter Site logo

qgis / qgis-js Goto Github PK

View Code? Open in Web Editor NEW
160.0 13.0 8.0 2.43 MB

QGIS core ported to WebAssembly to run it on the web platform

Home Page: https://qgis.github.io/qgis-js

License: GNU General Public License v2.0

CMake 30.64% C++ 7.19% Perl 7.36% HTML 6.30% Shell 0.47% TypeScript 44.46% CSS 3.44% Batchfile 0.15%
qgis webassembly qgis-js

qgis-js's Introduction

🧪 QGIS tests Docker Status Build Status OpenSSF Scorecard OpenSSF Best Practices 🪟 MingW64 Windows 64bit Build DOI

QGIS is a full-featured, user-friendly, free-and-open-source (FOSS) geographical information system (GIS) that runs on Unix platforms, Windows, and MacOS.

Features

1. Flexible and powerful spatial data management

  • Support for raster, vector, mesh, and point cloud data in a range of industry-standard formats
    • Raster formats include: GeoPackage, GeoTIFF, GRASS, ArcInfo binary and ASCII grids, ERDAS Imagine SDTS, WMS, WCS, PostgreSQL/PostGIS, and other GDAL supported formats.
    • Vector formats include: GeoPackage, ESRI shapefiles, GRASS, SpatiaLite, PostgreSQL/PostGIS, MSSQL, Oracle, WFS, Vector Tiles and other OGR supported formats.
    • Mesh formats include: NetCDF, GRIB, 2DM, and other MDAL supported formats.
    • Point-cloud format: LAS/LAZ and EPT datasets.
  • Data abstraction framework, with local files, spatial databases (PostGIS, SpatiaLite, SQL Server, Oracle, SAP HANA), and web services (WMS, WCS, WFS, ArcGIS REST) all accessed through a unified data model and browser interface, and as flexible layers in user-created projects
  • Spatial data creation via visual and numerical digitizing and editing, as well as georeferencing of raster and vector data
  • On-the-fly reprojection between coordinate reference systems (CRS)
  • Nominatim (OpenStreetMap) geocoder access
  • Temporal support

Example: Temporal animation

Example: Temporal animation

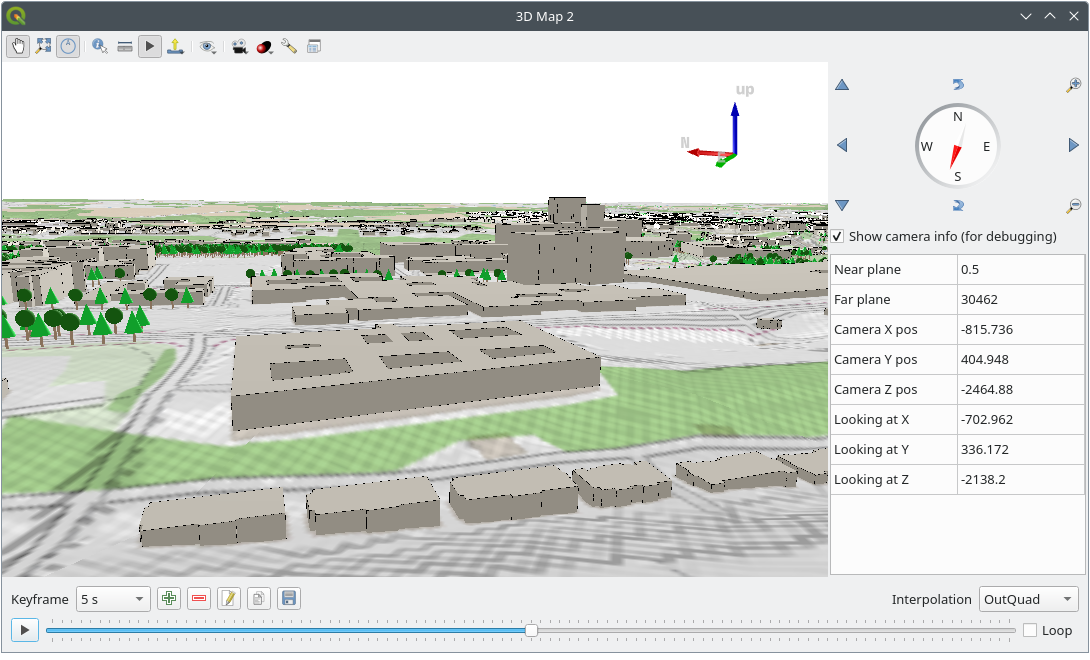
Example: 3D map view

Example: 3D map view

2. Beautiful cartography

  • Large variety of rendering options in 2D and 3D
  • Fine control over symbology, labeling, legends and additional graphical elements for beautifully rendered maps
  • Respect for embedded styling in many spatial data sources (e.g. KML and TAB files, Mapbox-GL styled vector tiles)
  • In particular, near-complete replication (and significant extension) of symbology options that are available in proprietary software by ESRI
  • Advanced styling using data-defined overrides, blending modes, and draw effects
  • 500+ built-in color ramps (cpt-city, ColorBrewer, etc.)
  • Create and update maps with specified scale, extent, style, and decorations via saved layouts
  • Generate multiple maps (and reports) automatically using QGIS Atlas and QGIS Reports
  • Display and export elevation profile plots with flexible symbology
  • Flexible output direct to printer, or as image (raster), PDF, or SVG for further customization
  • On-the-fly rendering enhancements using geometry generators (e.g. create and style new geometries from existing features)
  • Preview modes for inclusive map making (e.g. monochrome, color blindness)

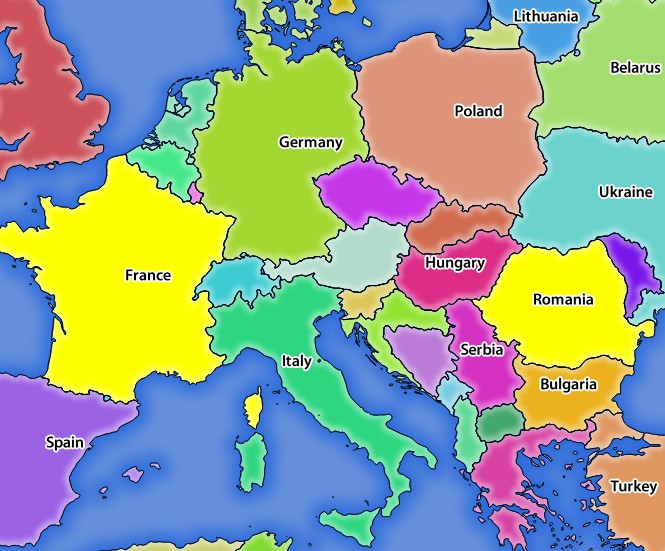
Example: Map of Bogota, Colombia in the style of Starry Starry Night, by Andrés Felipe Lancheros Sánchez

Map of Bogota, Colombia in the style of Starry Starry Night

For more maps created with QGIS, visit the QGIS Map Showcase Flickr Group.

QGIS Map Showcase

3. Advanced and robust geospatial analysis

  • Powerful processing framework with 200+ native processing algorithms
  • Access to 1000+ processing algorithms via providers such as GDAL, SAGA, GRASS, OrfeoToolbox, as well as custom models and processing scripts
  • Geospatial database engine (filters, joins, relations, forms, etc.), as close to datasource- and format-independent as possible
  • Immediate visualization of geospatial query and geoprocessing results
  • Model designer and batch processing

Example: Travel isochrones

Example: Travel isochrones

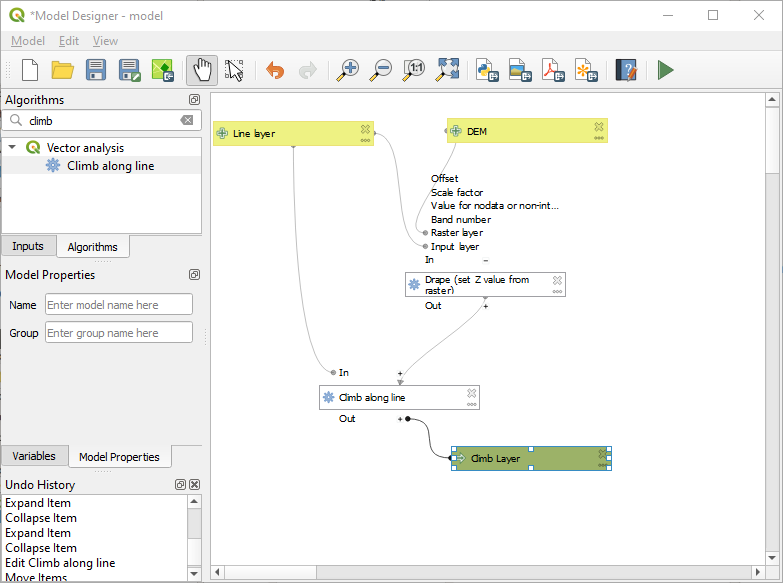
Example: Model designer

Example: model designer

4. Powerful customization and extensibility

  • Fully customizable user experience, including user interface and application settings that cater to power-users and beginners alike
  • Rich expression engine for maximum flexibility in visualization and processing
  • Broad and varied plugin ecosystem that includes data connectors, digitizing aids, advanced analysis and charting tools, in-the-field data capture, conversion of ESRI style files, etc.
  • Style manager for creating, storing, and managing styles
  • QGIS style hub for easy sharing of styles
  • Python and C++ API for standalone (headless) applications as well as in-application comprehensive scripting (PyQGIS)

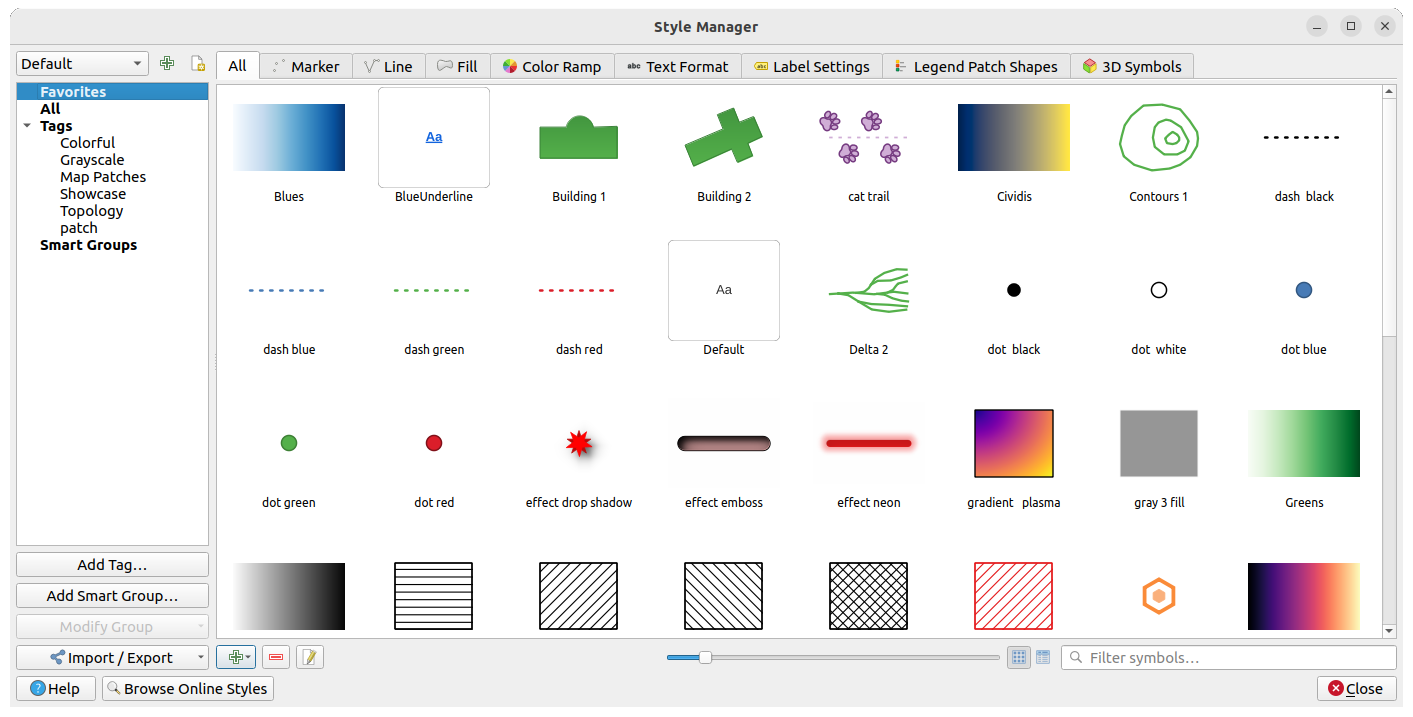
Example: Style manager

Example: Style manager

Example: Plugins

Example: Plugins

5. QGIS Server

Headless map server -- running on Linux, macOS, Windows, or in a docker container -- that shares the same code base as QGIS.

  • Industry-standard protocols (WMS, WFS, WFS3/OGC API for Features and WCS) allow plug-n-play with any software stack
  • Works with any web server (Apache, nginx, etc) or standalone
  • All beautiful QGIS cartography is supported with best-in-class support for printing
  • Fully customizable with Python scripting support

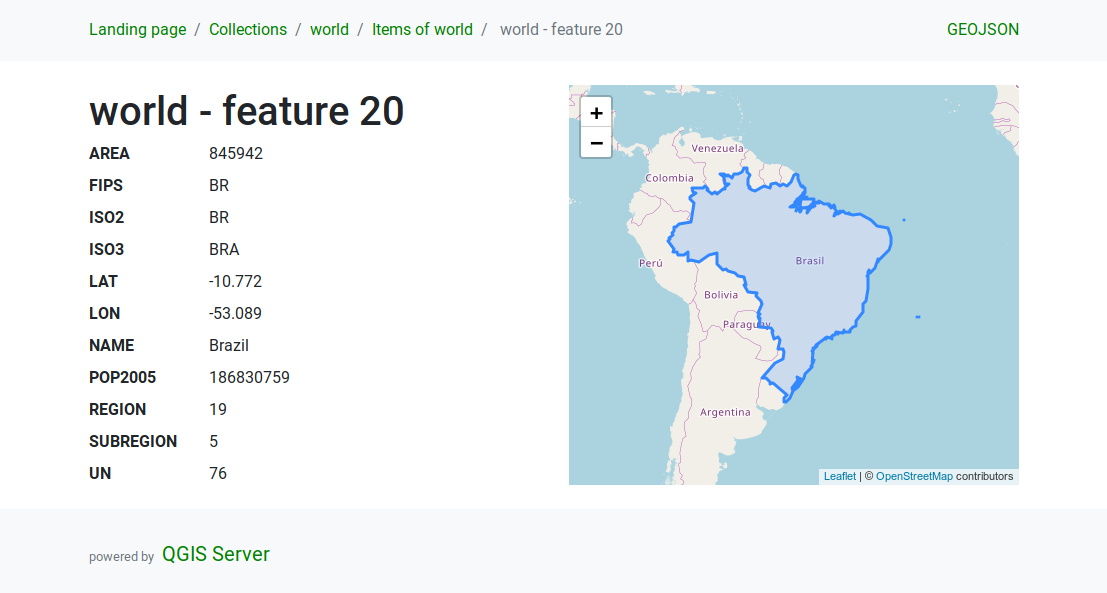
Example: QGIS server WMS response

Example: QGIS Server response to a WMS request

Example: QGIS server WFS response

Example: QGIS Server response to a WFS Feature request

Under the hood

QGIS is developed using the Qt toolkit and C++, since 2002, and has a pleasing, easy to use graphical user interface with multilingual support. It is maintained by an active developer team and supported by vibrant community of GIS professionals and enthusiasts as well as geospatial data publishers and end-users.

Versions and release cycle

QGIS development and releases follow a time based schedule/roadmap. There are three main branches of QGIS that users can install. These are the Long Term Release (LTR) branch, the Latest Release (LR) branch, and the Development (Nightly) branch.

Every month, there is a Point Release that provides bug-fixes to the LTR and LR.

Free and Open Source

QGIS is released under the GNU Public License (GPL) Version 2 or any later version. Developing QGIS under this license means that you can (if you want to) inspect and modify the source code and guarantees that you, our happy user will always have access to a GIS program that is free of cost and can be freely modified.

QGIS is part of the Open-Source Geospatial Foundation (OSGeo), offering a range of complementary open-source GIS software projects.

Installing and using QGIS

Precompiled binaries for QGIS are available at the QGIS.org download page. Please follow the installation instructions carefully.

The building guide can be used to get started with building QGIS from source.

For installation of QGIS Server, see its getting started documentation.

Documentation

A range of documentation is available. This includes:

Help and support channels

There are several channels where you can find help and support for QGIS:

  • Using the QGIS community site
  • Joining the qgis-users mailing list
  • Chatting with other users real-time. Please wait around for a response to your question as many folks on the channel are doing other things and it may take a while for them to notice your question. The following paths all take you to the same chat room:
    • Using an IRC client and joining the #qgis channel on irc.libera.chat.
    • Using a Matrix client and joining the #qgis:osgeo.org room.
  • At the GIS stackexchange or r/QGIS reddit, which are not maintained by the QGIS team, but where the QGIS and broader GIS community provides lots of advice
  • Other support channels

Get involved with the community

Bug reporting and bug fixing

You can help us by submitting bug reports or fixing bugs in the QGIS bug tracker.

New features and enhancements

If you wish to contribute patches you can:

  1. fork the project
  2. make your changes
  3. commit to your repository
  4. and then create a pull request.

The development team can then review your contribution and commit it upstream as appropriate.

If you commit a new feature, add [FEATURE] to your commit message AND give a clear description of the new feature. The label Needs documentation will be added by maintainers and will automatically create an issue on the QGIS-Documentation repo, where you or others should write documentation about it.

For large-scale changes, you can open a QEP (QGIS Enhancement Proposal). QEPs are used in the process of creating and discussing new enhancements or policy for QGIS.

Translations

Please help translate QGIS to your language. At this moment about forty languages are already available in the Desktop user interface and about eighty languages are available in transifex ready to be translated.

The translation process is managed by the Translation Team and all the activities are done under the Transifex platform.

Other ways to contribute

If you are not a developer, there are many other possibilities that do not require programming skills to help QGIS to evolve. Check our project homepage for more information.

qgis-js's People

Contributors

amuedespacher avatar boardend avatar wonder-sk avatar

Stargazers

 avatar  avatar  avatar  avatar  avatar  avatar  avatar  avatar  avatar  avatar  avatar  avatar  avatar  avatar  avatar  avatar  avatar  avatar  avatar  avatar  avatar  avatar  avatar  avatar  avatar  avatar  avatar  avatar  avatar  avatar  avatar  avatar  avatar  avatar  avatar  avatar  avatar  avatar  avatar  avatar  avatar  avatar  avatar  avatar  avatar  avatar  avatar  avatar  avatar  avatar  avatar  avatar  avatar  avatar  avatar  avatar  avatar  avatar  avatar  avatar  avatar  avatar  avatar  avatar  avatar  avatar  avatar  avatar  avatar  avatar  avatar  avatar  avatar  avatar  avatar  avatar  avatar  avatar  avatar  avatar  avatar  avatar  avatar  avatar  avatar  avatar  avatar  avatar  avatar  avatar  avatar  avatar  avatar  avatar  avatar  avatar  avatar  avatar  avatar  avatar

Watchers

 avatar  avatar  avatar  avatar  avatar  avatar  avatar  avatar  avatar  avatar  avatar  avatar  avatar

qgis-js's Issues

integrating qgis into expressJs based web application for tiff images

I am working on an expressJS based web application which is primarily intended to object detection from tiff images. As of now, i am using openseadragon for loading the tiff images inside the application but it takes too much time. So i had a thought of using QGIS interface inside my application for loading the tiff images.
can anyone help with this?

Colors in QGIS wasm in chromium look less bright (washed out)

grafik

It seems like Chrome does some color management which results in slightly dumper (less vivid) colors - when compared to QGIS Desktop and Firefox wasm rendering. One can see at in the blue of the rivers or the orange tones of the polygons above the shaded relief.

This is more an observation and not so much a bug.

@boardend : how to you transfer the rendered images from QGIS wasm to OpenLayers? As a JPEG or PNG encoded file? Can we influence color management in chrome?

Vector / raster tiles layer throws error when rendering

Rendering of vector tiles or raster tiles throws a RuntimeError "operation does not support unaligned accesses"

First there are a couple of suspicious warnings from QgsNetworkAccessManager code:

qgis-js.js:1631 qt.core.qobject.connect: QObject::connect(QgsNetworkAccessManager, Unknown): invalid nullptr parameter
qgis-js.js:1631 qt.core.qobject.connect: QObject::connect(QgsNetworkAccessManager, QgsNetworkAccessManager): invalid nullptr
qgis-js.js:1631 qt.core.qobject.connect: QObject::connect(QgsNetworkAccessManager, Unknown): invalid nullptr parameter

In case of raster tile layer: (wms provider with xyz service type)

qgis-js.worker.js:68 RuntimeError: operation does not support unaligned accesses
    at QBasicMutex::lockInternal(int) (qgis-js.wasm:0x1b4a57)
    at QRecursiveMutex::tryLock(int) (qgis-js.wasm:0x1b48f4)
    at QgsNetworkAccessManager::setupDefaultProxyAndCache(Qt::ConnectionType) (qgis-js.wasm:0x581770)
    at QgsNetworkAccessManager::instance(Qt::ConnectionType) (qgis-js.wasm:0x57f546)
    at QgsTileCache::tile(QUrl const&, QImage&) (qgis-js.wasm:0x1884371)
    at QgsWmsProvider::draw(QgsRectangle const&, int, int, QgsRectangle&, double&, QgsRasterBlockFeedback*) (qgis-js.wasm:0x194d54e)
    at QgsWmsProvider::readBlock(int, QgsRectangle const&, int, int, void*, QgsRasterBlockFeedback*) (qgis-js.wasm:0x1953332)
    at QgsRasterDataProvider::block(int, QgsRectangle const&, int, int, QgsRasterBlockFeedback*) (qgis-js.wasm:0xd2108a)
    at non-virtual thunk to QgsRasterDataProvider::block(int, QgsRectangle const&, int, int, QgsRasterBlockFeedback*) (qgis-js.wasm:0xd22314)
    at QgsSingleBandColorDataRenderer::block(int, QgsRectangle const&, int, int, QgsRasterBlockFeedback*) (qgis-js.wasm:0xd86462)

In case of vector tile layer:

qgis-js.worker.js:68 RuntimeError: operation does not support unaligned accesses
    at QBasicMutex::lockInternal(int) (qgis-js.wasm:0x1b4a57)
    at QRecursiveMutex::tryLock(int) (qgis-js.wasm:0x1b48f4)
    at QgsNetworkAccessManager::setupDefaultProxyAndCache(Qt::ConnectionType) (qgis-js.wasm:0x581770)
    at QgsNetworkAccessManager::instance(Qt::ConnectionType) (qgis-js.wasm:0x57f546)
    at QgsTileDownloadManagerWorker::queueUpdated() (qgis-js.wasm:0xa2df28)
    at QtPrivate::QSlotObject<void (QgsTileDownloadManagerWorker::*)(), QtPrivate::List<>, void>::impl(int, QtPrivate::QSlotObjectBase*, QObject*, void**, bool*) (qgis-js.wasm:0xa2dbae)
    at QMetaCallEvent::placeMetaCall(QObject*) (qgis-js.wasm:0xe9091)
    at QObject::event(QEvent*) (qgis-js.wasm:0xebd08)
    at QCoreApplicationPrivate::notify_helper(QObject*, QEvent*) (qgis-js.wasm:0xb65fe)
    at QCoreApplication::notify(QObject*, QEvent*) (qgis-js.wasm:0xb66c5)

Demo-Viewer - Input for preview timeout doesn't allow keyboard input

image

In the above window, the input text widget where one can enter a preview timeout value, the widget doesn't allow keyboard input. Only the Arrow up/down widgets work. To change the value from 200 to 300ms would mean a hundred klicks, because the step is one millisecond.

Loading expressions throws RuntimeError

When using a QGIS project containing vector tiles layer with a couple of styling rules, it failed to load with this RuntimeError:

qgis-js.wasm:0x56fcf5 Uncaught (in promise) RuntimeError: memory access out of bounds
    at QgsExpressionNodeFunction::QgsExpressionNodeFunction(int, QgsExpressionNode::NodeList*) (qgis-js.wasm:0x56fcf5)
    at exp_parse(expression_parser_context*) (qgis-js.wasm:0x54bcd8)
    at parseExpression(QString const&, QString&, QList<QgsExpression::ParserError>&) (qgis-js.wasm:0x54e28d)
    at QgsExpression::QgsExpression(QString const&) (qgis-js.wasm:0x55145b)
    at QgsProperty::loadVariant(QVariant const&) (qgis-js.wasm:0x9d9bd2)
    at QgsPropertyCollection::loadVariant(QVariant const&, QMap<int, QgsPropertyDefinition> const&) (qgis-js.wasm:0x9dfd97)
    at QgsAbstractPropertyCollection::readXml(QDomElement const&, QMap<int, QgsPropertyDefinition> const&) (qgis-js.wasm:0x9dce89)
    at QgsSymbolLayerUtils::loadSymbolLayer(QDomElement&, QgsReadWriteContext const&) (qgis-js.wasm:0x447961)
    at QgsSymbolLayerUtils::loadSymbol(QDomElement const&, QgsReadWriteContext const&) (qgis-js.wasm:0x4455a1)
    at QgsSymbolLayerUtils::loadSymbols(QDomElement&, QgsReadWriteContext const&) (qgis-js.wasm:0x45d3f7)

QgsExpressionNodeFunction tries to lock a recursive mutex, maybe that's the reason (possibly related to #3 which also fails when locking mutex, but with a different error message)

Loading a project fails with RuntimeError: index out of bounds

Here's the test project: test_project.zip

Loading it will emit this error:

Uncaught (in promise) RuntimeError: index out of bounds
    loadProject https://qgis-js.dev.schmuki.io/assets/wasm/qgis-js.js line 6867 > Function:8
    <anonymous> https://qgis-js.dev.schmuki.io/assets/index-5d3bd54b.js:120
    r https://qgis-js.dev.schmuki.io/assets/index-5d3bd54b.js:1
    n https://qgis-js.dev.schmuki.io/assets/index-5d3bd54b.js:1
    async* https://qgis-js.dev.schmuki.io/assets/index-5d3bd54b.js:120
[qgis-js.wasm:5700853:1](https://qgis-js.dev.schmuki.io/assets/wasm/qgis-js.wasm)
    <anonymous> https://qgis-js.dev.schmuki.io/assets/index-5d3bd54b.js:120
    AsyncFunctionThrow self-hosted:856

Initial high CPU load on Firefox

When Firefox is loading the qgis-js WebAssembly module, one core is 100% busy for some time. This is likely something FF does internally when loading such a large .wasm module:

  • The high CPU load goes towards zero after some time (~4min on my machine). The website is still working/responsive after that and stays idle when doing more render calls
  • The same thing happens with the 0.0.3 version, see https://boardend.github.io/qgis-js-baseline/
  • The same thing happens if I just return 0 in the main function
  • This behavior was observed in FF on Ubuntu Wayland and X11, also on FF on Windows 11
  • FF profiler only shows that the PollWrapper is busy polling
  • Hard to judge, but it seems that other larger Qt projects show similar behavior, although not as extreme as in qgis-js:

Can projects ship thier own fonts?

This question came up by @andreasneumann while testing out some own projects. See the notes in the Qt6 WebAssembly reference for context.

A real cool solution would be the proposed Local Font Access API by Google. Qt did some integration, but the API is only available in Chromium based browsers and behind a flag for the time of writing. So probably not the solution for qgis-js.

What we could do is to scan the uploaded folder for any known/supported font file extensions and add those via addApplicationFontFromData to the runtime.

Support for FeatureInfo (Identify tool)

It would be good if there could be feature info support (Identify tool) in the JS-QGIS API.

QGIS has different identify-tools modes:

  • Current layer
  • Top-Down, Stop at first
  • Top-down (and return results for all layers)
  • Interactive layer choice

grafik

For the web mapping context I think that the middle two versions (Top-Down, Stop at first; Top-down) would make most sense.

It would be great if this could support the QGIS expression engine and HTML for the display of feature info. See the "Display" section in the Layer properties:

grafik

That way we can be really flexible, with the mixture of HTML and QGIS expression support.

Make map view more responsive (larger map view) - or full-screen mode

It would be great to have either a "full-screen" mode or a more responsive map view.

On my relatively large screen I only get a small map view - see screenshot below

grafik

Alternatively (or in addition) it would be cool to have a "full-screen" button for the map.

Of course this is all "low priority" - but maybe not that hard to implement.

Loading a WMS/WMTS layer causes infinite loop

If the QGIS project uses a WMS / WMTS layer, the project loading will get stuck, with this warning being emitted all the time:

QEventLoop::WaitForMoreEvents is not supported on the main thread without asyncify

This is likely due to the fact that the WMS provider is doing a synchronous blocking GetCapabilities call in the constructor.

Opacity change latency

Hello, I have been tinkering with the repo and was seeing how it can do with layered historical imagery for comparing effects of flooding https://max-mapper.github.io/journal/maps/?repo=max-mapper/journal/mapdata/ec-floods

One issue is an adjustment to a single layer opacity e.g.

layer.opacity = 50 // WebGLTileLayer
source.clear(); // QgisXYZDataSource
layer.getRenderer().clearCache(); 
layer.changed();

... causes a full re-render which can take many seconds, especially on Android. I was just curious if there is a way to cache or avoid the rerender and make opacity adjustments feel instant. Thank you for any advice!

Raster layer with a remote COG fails to load

When using a QGIS project that contains a cloud-optimized GeoTIFF (COG) on a remote server, it fails with a runtime error:

qgis-js.wasm:0x4792c6f Uncaught (in promise) RuntimeError: memory access out of bounds
    at strlen (qgis-js.wasm:0x4792c6f)
    at std::__2::basic_string<char, std::__2::char_traits<char>, std::__2::allocator<char>>::basic_string[abi:v15006]<std::nullptr_t>(char const*) (qgis-js.wasm:0x932371)
    at CPLString::CPLString(char const*) (qgis-js.wasm:0x23aeac1)
    at cpl::VSICurlHandle::GetFileSizeOrHeaders(bool, bool) (qgis-js.wasm:0x242d5d3)
    at cpl::VSICurlHandle::GetFileSize(bool) (qgis-js.wasm:0x244222a)
    at cpl::VSICurlHandle::Exists(bool) (qgis-js.wasm:0x242f73e)
    at cpl::VSICurlFilesystemHandlerBase::Stat(char const*, stat*, int) (qgis-js.wasm:0x243cb26)
    at VSIStatExL (qgis-js.wasm:0x23e16c8)
    at GDALOpenInfo::GDALOpenInfo(char const*, int, char const* const*) (qgis-js.wasm:0x3d7e2c7)
    at GDALOpenEx (qgis-js.wasm:0x3db2ab9)

We are using our custom implementation of /vsicurl that uses emscripten's fetch API to do the requests.

It is strange that it crashes on some string construction. In the gdal sandbox this works fine (https://github.com/wonder-sk/wasm-gdal-sandbox), but the whole test case there runs in a worker thread because of the blocking networking calls.

qgis-js/utils - loadRemoteProjects cannot handle basePaths

When running a website on a different base path than root (e.g. "/qgis-demo"), loading remote projects does not work; it always expects files to be located at "/projects".

Steps to reproduce:

  • Set up e.g. a Vue.js app with Vite, configure a base path
  • Install and set up qgis-js and @qgis-js/utils
  • Use the useProjects composable to load remote projects
  • Try to open a remote project

Actual result:

Expected result:

  • Projects should be able to be opened also when running on a base path. This could e.g. be configured through an .env variable, or through a setting when using the useProject hook

Update to latest QGIS version

At the time of writing we are on QGIS 3.32.1 and the newest version would be 3.36.3

We should find a way to update to the latest QGIS version periodically (or even better automatically)

Currently we have some nasty patches in build/vcpkg-ports/qgis-qt6, which (will probably) prevent a smooth update to the latest QGIS version. We should move as much as possible upstream and bring the rest in a form, so that it is easily updatable

Layer opacity below 1 results in unwanted graying effect

When setting the opacity of a map layer to some value below 1 (e.g. 0.5), the map layer is displayed in a gray-ish color.

Steps to reproduce:

Actual result:

  • Map layer is displayed with a grayish tint.

Expected result:

  • When reducing the layer opacity, the layer should maintain its original color quality, becoming more transparent without a gray overlay. The colors should remain true to their original hue, and only in terms of transparency.

Tested both with the sample project "village" and an own QGIS project.

Example:
Opacity = 1:
opacity-1

Opacity < 1:
opacity-below-1

Make sure labels and symbols do not get cut off in XYZ Tiles mode

If a label or a map symbol (e.g. a point marker) ends up being near the edge of a tile, it may get cut off: it only shows in one tile, but not on the neighboring tile.

QGIS server users also have this problem, and they set non-zero tile buffer (e.g. 100 pixels) in project settings:

image

QGIS server code then takes care of expanding the extent to add the extra buffer, something like this:

int tileBufferPixels = QgsProject::instance()->readNumEntry( QStringLiteral( "WMSTileBuffer" ), QStringLiteral( "/" ), 0 );
double buffer = tileBufferPixels * tileExtentWidthMapUnits / tileWidthPixels;
mapSettings.setExtentBuffer( buffer );

QGIS layers within layer groups with visibility=false cannot be displayed

If a QGIS project has a layer group set to visible==false, setting the visibility of the individual layers to true in QGIS-js does not render the layers on the map.

Steps to reproduce:

  • Create a QGIS project
  • Create a layer group with at least one layer, and set it to invisible (via the checkbox in the layer list)
  • Open the QGIS project with QGIS-js (e.g. on demo site)
  • Try to switch on the layer that is in the group

Actual result:

  • Layer is not displayed on the map

Expected result:

  • Layer is displayed on the map

Example:
(last two layers should render a choropleth map)
qgis-js-invisible_layers

@qgis-js/utils is not usable for external projects

Importing import { useProjects } from "@qgis-js/utils" only works when the internal Vite configuration is in place. Otherwise Vite will report:

Could not resolve "public/projects"

    node_modules/@qgis-js/utils/dist/qgis-js-utils.js:340:8:
      340 │         "public/projects"
          ╵         ~~~~~~~~~~~~~~~~~

  You can mark the path "public/projects" as external to exclude it from the bundle, which will
  remove this error. You can also add ".catch()" here to handle this failure at run-time instead of
  bundle-time.

This doesn't make sense for external usage. Will have to find another solution or remove this feature from the @qgis-js/utils package.

Reported by @amuedespacher, CC @andreasneumann

Map themes in QGIS should be exposed to the JS API

The JS interface should support the following functionality:

  • listing of all map themes in the project
  • switch visibility of layers and styles according to a map theme provided in the API

That way we can add predefined combinations of layer visibilities and/or style combinations without having the user to switch many layers one after the other.

grafik

See also QgsMapThemeCollection Class

OpenLayers Integration: Remove XYZ Debug mode

Based on the feedback of Andreas Hocevar, we should remove the debug mode in QgisXYZDataSource and use createImageBitmap(imageData) directly and apply it with imageTile.setImage(imageBitmap) to get rid of the unnecessary 2D context creation.

OpenLayers Integration: Larger tile sizes for higher resolution monitors

It would be useful to render larger tiles for high-dpi monitors.

One could have a switch depending on the screen size. E.g. when a browser window is larger than 2000 px on either width or height, then the tile size could switch from 256 px tiles to 512 px tiles.

of course, this is also low priority.

Relative SVG files do not render

The attached project uses SVG files for rendering points. The SVG files are in a subfolder and are attached as relatives paths. However, they don't render correctly, but the question mark replacement symbol is shown instead.

This is how they should render:

grafik

and this is how they render in qgis-wasm:

grafik

Is this an issue with the epxression engine or relativ paths treatment, or the wasm file system?

qgis-js/utils - loadLocalProject does not handle promise rejections

Steps to reproduce:

  • Use the loadLocalProject function of @qgis-js/utils
  • When the system dialog to select a folder pops up, cancel it

Actual result:

  • Error "Uncaught (in promise) DOMException: The user aborted a request." appears
  • Rejected promise is not handled

Expected result:

  • Promise rejection is handled

Hints:

const loadLocalProject = async (): Promise<LocalProject> => {
  try {
    const entries: LocalEntries = await openLocalDirectory({
      recursive: true,
      mode: "read",
    }) as LocalEntries;
    const localProject = new LocalProject(fs, entries);
    return localProject;
  } catch (error) {
    console.error(error);
    throw error;
  }
};
  • This would allow to better handle e.g. user abortions in the UI.

Global Variables not supported

Many global variables are not supporte, such as:

  • @map_scale
  • @qgis_platform
  • @qgis_os_name
  • @qgis_locale
  • @qgis_release_name
  • @qgis_version

etc.

Tested with writing out the variables with COALESCE in a label.

See also issue #26

Recommend Projects

  • React photo React

    A declarative, efficient, and flexible JavaScript library for building user interfaces.

  • Vue.js photo Vue.js

    🖖 Vue.js is a progressive, incrementally-adoptable JavaScript framework for building UI on the web.

  • Typescript photo Typescript

    TypeScript is a superset of JavaScript that compiles to clean JavaScript output.

  • TensorFlow photo TensorFlow

    An Open Source Machine Learning Framework for Everyone

  • Django photo Django

    The Web framework for perfectionists with deadlines.

  • D3 photo D3

    Bring data to life with SVG, Canvas and HTML. 📊📈🎉

Recommend Topics

  • javascript

    JavaScript (JS) is a lightweight interpreted programming language with first-class functions.

  • web

    Some thing interesting about web. New door for the world.

  • server

    A server is a program made to process requests and deliver data to clients.

  • Machine learning

    Machine learning is a way of modeling and interpreting data that allows a piece of software to respond intelligently.

  • Game

    Some thing interesting about game, make everyone happy.

Recommend Org

  • Facebook photo Facebook

    We are working to build community through open source technology. NB: members must have two-factor auth.

  • Microsoft photo Microsoft

    Open source projects and samples from Microsoft.

  • Google photo Google

    Google ❤️ Open Source for everyone.

  • D3 photo D3

    Data-Driven Documents codes.