Our mission is to make an automated bearing testing system and to create a model in order to execute in a scheduled maintenance system. The goal is to find the more convenient algorithm to make some predictions about this system.
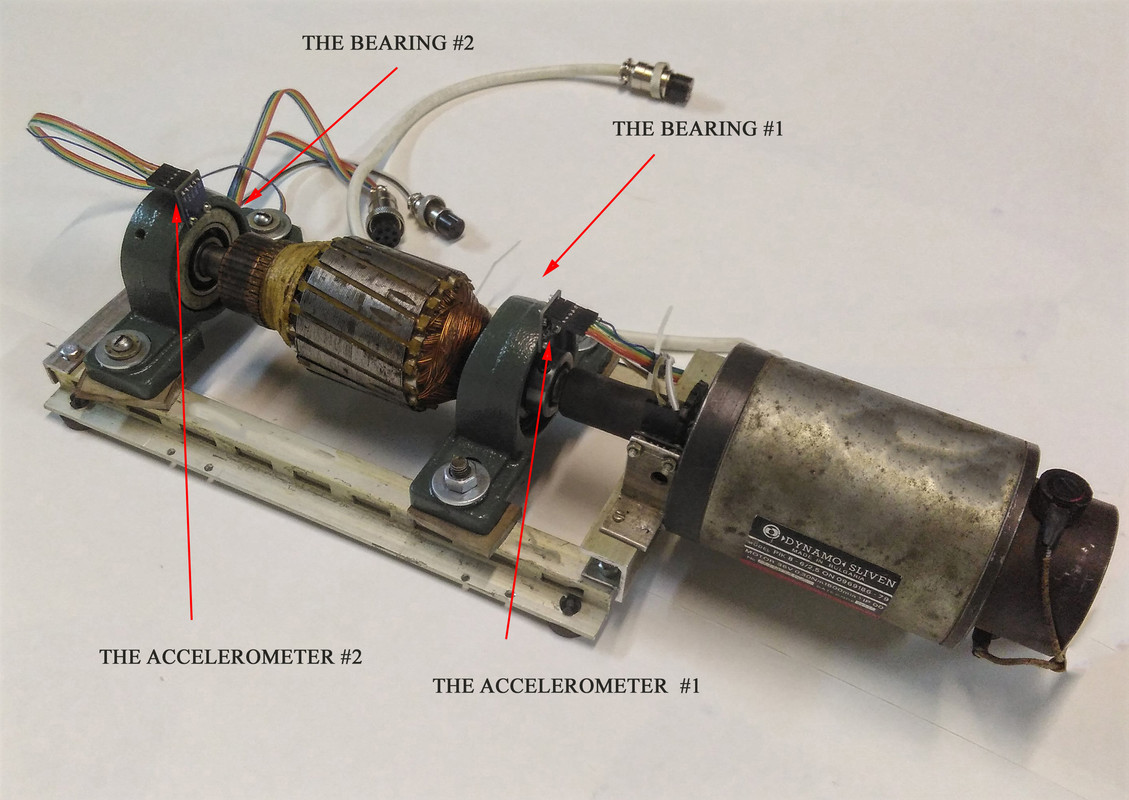
- For the experiments device shown on the picture was constructed. Two bearings were installed on the shaft. The rotation speed changed from 0 to 1500 rpm, was held for 10 seconds, and decreased to 250 rpm.
- The shaft was rotated using an DC motor connected to the shaft through a coupling. A radial load of 3.5 kg is applied to the shaft using a balanced weight. The bearings were mounted on the shaft as shown in Figure 1.
- GY-61 ADXL3353 accelerometers were mounted on the bearing housing
- The sensor location is also shown in Figure.
- The recording was saved along the x, y, z axes.
- bearing_signals.csv. Contains signals recordings.
- bearing_classes.csv. Classes whole or defective for every bearing.
- Anne Jungers (@Annejungers)
- Hoang Minh (@Minh6019)
- Minh Hien (@minhhienvo368)
- Quinten (@QuintenMM)
Below are provided the steps that were followed for this project. Each step and classifiers have their own document.
- Data visualization: ploting data to detect missing values, outliers, data relations and usefulness of features


We detected the outliers of data in Hertz[Hz] column, the majority data in this column distributes from 0 to 25.5

- Preprocessing: with the knowledge acquired with the preceding step, apply preprocessing of data including dealing with missing values, drop unuseful features and build new features
-
Option 1:
- Feature selection: 5 new representative features (i.e. min, max, median, std, mean) derived from the orginal features (timestamp, a1_x, a2_x, a1_y, a2_y, a1_z, a2_z, hz, w). We have 45 features.
- Target: status of bearings
-
Option 2:
- Feature selection: 12 representative features (i.e. min, max, median, std, entropy, impulse factor, margin factor, frequency center, mean_square_frequency, root_mean_square_frequency, root_variance_frequency,crest_factor) derived from the orginal features (a1_x, a2_x, a1_y, a2_y, a1_z, a2_z, hz: range of (24-25.5))
- Target: status of bearings {1: good, 0: bad}
-
- Classifier: build classifiers based on the preprocessed data using a variety of techniques
-
Option 1: 45 features
Classifier Test Parameter F1-score CV_ROC_AUC_score KNN k=5 0.95 0.94 KNN with validation k=5 0.95 0.94 KNN with GridSearchCV k=1 0.95 0.94 Random Forest with GridSearchCV k=100,200 0.95 1.0 
-
Option 2: 84 features
Classifier Test Parameter F1-Score CV_ROC_AUC_score KNN k=5 0.91 0.89 KNN with validation k=5 0.91 0.84 KNN with GridSearchCV k=4 0.91 0.87 Random Forest with GridSearchCV K=100,200 0.87 0.95 
- Contains all of the jupyter's notebooks including classifiers, preprocessing and data visualization
File Description plot folder Contains plots' images 1.challenge-classification_01.ipynb Python code written in "Jupyter Notebook"
Code used to get the data ready for Machine Learning.2.challenge-classification_02.ipynb Python code written in "Jupyter Notebook"
More in depth version.3.README.md Information on the assignment
- Install Python and clone this repository
- Install required Python modules with pip install -r requirements.txt to run the jupyter's notebooks just go with jupyter notebook