r-spatial / leafem Goto Github PK
View Code? Open in Web Editor NEWleaflet extensions for mapview
Home Page: https://r-spatial.github.io/leafem/
License: Other
leaflet extensions for mapview
Home Page: https://r-spatial.github.io/leafem/
License: Other


On a recently updated system with GDAL3/PROJ6, this currently fails:
destfile = tempfile(fileext = ".gpkg")

st_write(st_as_sf(gadmCHE), dsn = destfile)

leaflet() %>%
  addTiles() %>%
  leafem::addLocalFile(destfile)
with:
Error in CPL_proj_is_valid(p4s) :
  Expecting a single string value: [type=character; extent=3].
In addition: Warning message:
In if (is.na(x)) NA_crs_ else if (inherits(x, "crs")) x else if (is.numeric(x)) CPL_crs_from_epsg(as.integer(x)) else if (is.character(x)) { :

 Error in CPL_proj_is_valid(p4s) :
  Expecting a single string value: [type=character; extent=3].
, because:
prj = gdalUtils::gdalsrsinfo(file, o = "proj4")gives:
 prj
[1] ""                                    "+proj=longlat +datum=WGS84 +no_defs"
[3] ""
This could be solved substituting:
prj = gdalUtils::gdalsrsinfo(file, o = "proj4") with, for example,
prj = sp::CRS(rgdal::ogrInfo(file)$p4s)Although this would require adding rgdal as an import, I think it would also allow to more easily introduce PROJ6 workflows based on WKT strings (r-spatial/discuss#28)
When I load package leafem, I get this message:
Loading required package: leafem
The legacy packages maptools, rgdal, and rgeos, underpinning the sp package,
which was just loaded, will retire in October 2023.
Please refer to R-spatial evolution reports for details, especially
https://r-spatial.org/r/2023/05/15/evolution4.html.
It may be desirable to make the sf package available;
package maintainers should consider adding sf to Suggests:.
The sp package is now running under evolution status 2
     (status 2 uses the sf package in place of rgdal)
This is a continuation of parts of r-spatial/mapview#305
The intent is to have a new method to use https://github.com/GeoTIFF/georaster-layer-for-leaflet to enable rendering of largish raster data.
This is currently limited to files, i.e. no in-memory objects are supported so far.
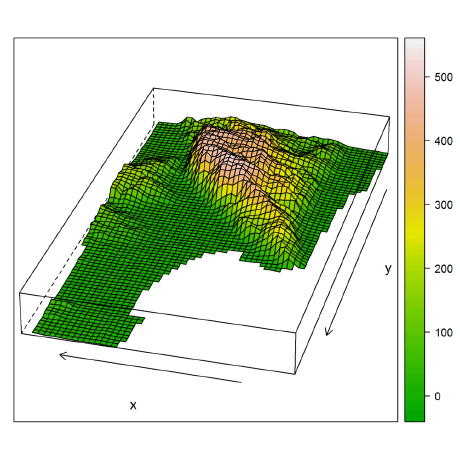
This is what we currently have
library(leaflet)
library(leafem)
library(stars)

# tst = read_stars("/media/timpanse/d8346522-ef28-4d63-9bf3-19fec6e13aab/bu_lenovo/software/data/global_elevation_0.tif")
tst = read_stars("/home/timpanse/software/data/srtm_39_03.tif")
st_is_longlat(tst)

if (!st_is_longlat(tst)) {
  tst = st_warp(tst, crs = 4326)
}

tst_ds = stars:::st_downsample(tst, n = 1)
dim(tst_ds)

fl = tempfile(fileext = ".tif")
write_stars(tst_ds, dsn = fl)

options(viewer = NULL)

leaflet() %>%
  addProviderTiles("Esri.WorldImagery") %>%
  leafem:::addGeotiff(
    file = fl
    , group = "test"
    , layerId = "testid"
    , resolution = 96
    , opacity = 1
    , colorOptions = leafem:::colorOptions(
      palette = viridisLite::inferno
      , breaks = seq(
        min(tst[[1]], na.rm = TRUE)
        , max(tst[[1]], na.rm = TRUE)
        , 500
      )
    )
  )
which yields:

and zoomed in:

I just tried to test the PR #9 with addStarsImage, which is not working unfortunately.
I had to use project = FALSE, as with project = TRUE I get this error:
Error in .Call("_sf_CPL_proj_direct", PACKAGE = "sf", from_to, pts, keep) :
Incorrect number of arguments (3), expecting 2 for '_sf_CPL_proj_direct'
Same error occurs for the addStarsImage example:
library(stars)
library(leaflet)
library(leafem)

tif = system.file("tif/L7_ETMs.tif", package = "stars")
x = read_stars(tif)
leaflet() %>%
  addProviderTiles("OpenStreetMap") %>%
  addStarsImage(x, project = TRUE)
Hello!
An error occurs if argument colorOptions is not given when opacity is. Here is an example from the help file:
 library(leaflet)
 library(leafem)
 library(stars)

  tif = system.file("tif/L7_ETMs.tif", package = "stars")
  x1 = read_stars(tif)
  x1 = x1[, , , 3] # band 3

  leaflet() %>%
    addTiles() %>%
    leafem:::addGeoRaster(
      x1
      , opacity = 1
    )

##   Error in evalAll(list) :
##    promise already under evaluation: recursive default argument reference or earlier problems?
The same error arises if both opacity and colorOptions are not specified. This is with R 4.0.4 and leafem 0.1.3 on Windows.
Thanks!
My aim is to make a shiny app with a map displaying raster data, which can be updated by the user, using sliders (or similar) to input the parameters for changing the raster. I want the changes to take effect when an "update" button is pressed, rather than when the slider is moved. In practical use, the user may be zoomed on a particular location when they wish to make a change and update the map. When I run the below app and click to update the map, the map always zooms back out to show the full extent of the raster. I was under the impression that using the leafletProxy() command would leave the zoom etc., intact, however that doesn't seem to happen. In this code, I have tried to save the viewing parameters of the map, then update the raster, then revert to the saved viewing params, however it still zooms out. Is there a way to get setview() to work in this context, please?
Reprex:
library(stars)
library(leaflet)
library(viridis)
library(RColorBrewer)
library(scales)
library(lattice)
library(raster)
library(rgdal)
library(leafem)
library(shiny)
library(shinyjs)
x<-raster(res=0.0006, xmn=1.153975, xmx=3.663575, ymn=47.84775, ymx=49.49975)
values(x)[]<-rnorm(length(values(x)), 50)
ui <- fluidPage(
titlePanel("Tabsets"),
sidebarLayout(
sidebarPanel(

  br(),

  sliderInput("n1",
              "Slider1",
              value = 0.1,
              min = 0,
              max = 1),

  br(),
  actionButton("B1", "Update Map")

),

mainPanel(

  tabsetPanel(type = "tabs",
              tabPanel("My Interactive map1's name",
                       div(class="outer",

                           leafletOutput("map", width=800, height=800)
                       ))
  )

)
)
)
server <- function(input, output, session) {
output$map <- renderLeaflet({
leaflet() %>%
addTiles() %>%
leafem:::addGeoRaster(x,
group = "My_raster",
layerId = NULL,
resolution = 96,
opacity = 0.7,
zoom = 10,
colorOptions = leafem:::colorOptions(
palette = inferno,
breaks = seq(x@data@min, x@data@max, 0.5),
na.color = "transparent"
)
) %>%
  addLegend(pal=colorNumeric(inferno(256), values(x),
                             na.color = "transparent"), values = values(x), title = "My_raster", position = "bottomleft")%>%
  addLayersControl(overlayGroups = c("My_raster")) %>%
  setView(lng = 2.35, lat = 48.86, zoom = 10)
  })
observeEvent(input$B1,{ ### run this sub-routine when the button, "B1", is clicked
x<-x*input$n1 ### Update the raster (do anything using slider inputs) before the plotting
savedZoom<-input$map_zoom
savedBounds<-input$map_bounds
savedCenter<-input$map_center

leafletProxy("map") %>% ### meant to update the map, without altering anything else, e.g. zoom, etc.

  leafem:::addGeoRaster(x,
                        group = "My_raster",
                        layerId = NULL,
                        resolution = 96,
                        opacity = 0.7,
                        colorOptions = leafem:::colorOptions(
                          palette = inferno,
                          breaks = seq(x@data@min, x@data@max, 0.5),
                          na.color = "transparent"
                        )
  )%>%

  clearControls()%>%
  addLegend(pal=colorNumeric(inferno(256), values(x),
                             na.color = "transparent"), values = values(x), title = "My_raster", position = "bottomleft")%>%
  leaflet::setView(lng=savedCenter$lng, lat=savedCenter$lat, zoom=savedZoom) # This should make the map view revert to saved params
})
}
shinyApp(ui=ui,server=server)
Maybe I overlooked it, but there does not seem to be a pane option for addStarsImage?
I've just tried the following to no avail:
library(leafem)
library(leaflet)
url_rivers = "https://vector-tiles-data.s3.eu-central-1.amazonaws.com/rivers_africa.pmtiles"
leaflet() %>%
  addTiles() %>%
  addPMPolylines(
    url = url_rivers
    , layerId = "rivers"
    , group = "rivers"
    , style = paintRules(
      layer = "rivers_africa"
      , color = "blue"
    )
  ) %>%
  setView(24, 2.5, 4)
f_rivers = basename(url_rivers)
if (!file.exists(f_rivers)) {
  download.file(url_rivers, f_rivers)
}
leaflet() %>%
  addTiles() %>%
  addPMPolylines(
    # url = paste0("pmtiles://", f_rivers)
    url = f_rivers
    , layerId = "rivers"
    , group = "rivers"
    , style = paintRules(
      layer = "rivers_africa"
      , color = "blue"
    )
  ) %>%
  setView(24, 2.5, 4)
I know that hosting pmtiles locally can work: protomaps/PMTiles#234
Thoughts @tim-salabim or anyone? Would be super useful if possible and imagine it would work as a simple solution when shipping a .pmtiles file alongside a map for a quick solution.
Trying to install the leafem package with R 3.6.1 using RStudio Version 1.1.456 with Anaconda 3 results in the following installation error:
ERROR: lazy loading failed for package 'leafem'
* removing 'path/Anaconda3/envs/rstudio/lib/R/library/leafem'
Warning in install.packages :
installation of package ‘leafem’ had non-zero exit status
This behaviour does not occur in R version 3.6.3 (2020-02-29) using RGui.
I'm sorry, some of the output is in German, I hope the issue is clear nonetheless.
> install.packages("leafem")
There is a binary version available but the source version is later:
binary source needs_compilation
leafem 0.1.3 0.1.6 FALSE
installing the source package ‘leafem’
trying URL 'https://cran.rstudio.com/src/contrib/leafem_0.1.6.tar.gz'
Content type 'application/x-gzip' length 3203539 bytes (3.1 MB)
downloaded 3.1 MB
"path\user\Documents"
CMD.EXE wurde mit dem oben angegebenen Pfad als aktuellem Verzeichnis gestartet.
UNC-Pfade werden nicht unterstützt.
Stattdessen wird das Windows-Verzeichnis als aktuelles Verzeichnis gesetzt.
* installing *source* package 'leafem' ...
** Paket 'leafem' erfolgreich entpackt und MD5 Summen überprüft
** using staged installation
** R
** inst
** byte-compile and prepare package for lazy loading
ERROR: lazy loading failed for package 'leafem'
* removing 'path/Anaconda3/envs/rstudio/lib/R/library/leafem'
Warning in install.packages :
installation of package ‘leafem’ had non-zero exit status
The downloaded source packages are in
‘path\user\AppData\Local\Temp\Rtmpys7GRL\downloaded_packages’
Hello,
I noticed that by using the addLogo function within a shiny app, the logo appears after the first button click and disappear in subsequent clicks. Please find the reprex below:
library(shiny)
library(leaflet)

r_colors <- rgb(t(col2rgb(colors()) / 255))
names(r_colors) <- colors()

ui <- fluidPage(
  leafletOutput("mymap"),
  p(),
  actionButton("recalc", "New points")
)

server <- function(input, output, session) {

  points <- eventReactive(input$recalc, {
    cbind(rnorm(40) * 2 + 13, rnorm(40) + 48)
  }, ignoreNULL = FALSE)

  output$mymap <- renderLeaflet({
    leaflet() %>%
      addProviderTiles(providers$Stamen.TonerLite,
                       options = providerTileOptions(noWrap = TRUE)
      ) %>%
      addMarkers(data = points()) %>%
      leafem::addLogo(
        img = "https://upload.wikimedia.org/wikipedia/commons/f/f7/AWI_Logo_2017.svg",
        url = "http://www.awi.de/",
        position = "bottomleft",
        alpha = 0.3, width = 120, height = 120,
        # offset.x = 30, offset.y = 30
      )
  })
}

shinyApp(ui, server)
Is it a shiny-specific question, or the addLogo function may need to consider this in the future?
Cheers,
Ahmed
I have a Shiny app with a list of rasters that plot to leaflet map on a loop, when I do
                 for(i in 1:length(rastit)){

                      leafletProxy("map") %>%
                       leafem::addGeoRaster(rastit[[i]], opacity=0.8,layerId = paste0("ras", i),
                           colorOptions = colorOptions(palette=colores, breaks=breaks, na.color = "transparent"),
                               options=tileOptions(updateWhenZooming = FALSE), group="BioVolume", autozoom=FALSE)
                            }
the map still autozooms to the last plotted raster. Even if I fitBounds() after each call, it will still end up overriding that and zooming to the raster.
Any solution or workaround for this?
hello
thank you for this great package
is there a way to add footnotes (free text) below the map? I want to put it side by side with a logo (one at the bottom left, the other at the bottom right.)
thank you!
Is it possible to edit the label? So the tooltip not only displays only the value of the field, but also other information or more than one field.
Hi
Thanks for the package, so useful!
I'm struggling to map COG (Cloud Optimised Geotiff) layers using leafem::addCOG. The function example works for me, but I can't get my own COG rasters to be shown. Is there any trick on how to prepare them?
For example, this online COG (https://frodriguezsanchez.net/img/prueba.tif) passes the validation here and can be mapped nicely e.g. in https://cogeo.org/map (see here). But I can't get it to be shown in R:
library(leaflet)
library(leafem)

leaflet() |>
  addTiles() |>
  addCOG(url = "https://frodriguezsanchez.net/img/prueba.tif")
I can visualise the layer if I use addGeotiff with file (not url) argument:
leaflet() |>
  addTiles() |>
  addGeotiff(file = "/vsicurl/https://frodriguezsanchez.net/img/prueba.tif")
Is there any trick to make COGs work in leaflet? Thanks!
Created on 2022-10-11 with reprex v2.0.2
sessioninfo::session_info()
#> ─ Session info ───────────────────────────────────────────────────────────────
#>  setting  value
#>  version  R version 4.2.1 (2022-06-23)
#>  os       Ubuntu 20.04.5 LTS
#>  system   x86_64, linux-gnu
#>  ui       X11
#>  language en_GB:en
#>  collate  en_GB.UTF-8
#>  ctype    en_GB.UTF-8
#>  tz       Europe/Madrid
#>  date     2022-10-11
#>  pandoc   2.19.2 @ /usr/lib/rstudio/bin/quarto/bin/tools/ (via rmarkdown)
#>
#> ─ Packages ───────────────────────────────────────────────────────────────────
#>  package     * version    date (UTC) lib source
#>  assertthat    0.2.1      2019-03-21 [1] RSPM (R 4.1.0)
#>  base64enc     0.1-3      2015-07-28 [1] RSPM (R 4.1.0)
#>  chromote      0.1.1      2022-09-07 [1] RSPM (R 4.2.0)
#>  class         7.3-20     2022-01-16 [2] CRAN (R 4.2.1)
#>  classInt      0.4-8      2022-09-29 [1] RSPM (R 4.2.0)
#>  cli           3.4.1      2022-09-23 [1] RSPM (R 4.2.0)
#>  codetools     0.2-18     2020-11-04 [2] CRAN (R 4.2.1)
#>  crosstalk     1.2.0      2021-11-04 [1] RSPM (R 4.1.0)
#>  curl          4.3.3      2022-10-06 [1] RSPM (R 4.2.0)
#>  DBI           1.1.3      2022-06-18 [1] RSPM (R 4.2.0)
#>  digest        0.6.29     2021-12-01 [1] RSPM (R 4.1.0)
#>  dplyr         1.0.10     2022-09-01 [1] RSPM (R 4.2.0)
#>  e1071         1.7-11     2022-06-07 [1] RSPM (R 4.2.0)
#>  evaluate      0.17       2022-10-07 [1] CRAN (R 4.2.1)
#>  fansi         1.0.3      2022-03-24 [1] CRAN (R 4.1.2)
#>  fastmap       1.1.0      2021-01-25 [1] RSPM (R 4.1.0)
#>  fs            1.5.2      2021-12-08 [1] RSPM (R 4.1.0)
#>  generics      0.1.3      2022-07-05 [1] RSPM (R 4.2.0)
#>  glue          1.6.2      2022-02-24 [1] RSPM (R 4.1.0)
#>  highr         0.9        2021-04-16 [1] RSPM (R 4.1.0)
#>  htmltools     0.5.3      2022-07-18 [1] RSPM (R 4.2.0)
#>  htmlwidgets   1.5.4      2021-09-08 [1] RSPM (R 4.1.0)
#>  httr          1.4.4      2022-08-17 [1] RSPM (R 4.2.0)
#>  jsonlite      1.8.2      2022-10-02 [1] RSPM (R 4.2.0)
#>  KernSmooth    2.23-20    2021-05-03 [2] CRAN (R 4.2.1)
#>  knitr         1.40       2022-08-24 [1] RSPM (R 4.2.0)
#>  later         1.3.0      2021-08-18 [1] RSPM (R 4.1.0)
#>  lattice       0.20-45    2021-09-22 [2] CRAN (R 4.2.1)
#>  leafem      * 0.2.0.9011 2022-10-11 [1] Github (r-spatial/leafem@1ec57b4)
#>  leaflet     * 2.1.1      2022-03-23 [1] RSPM (R 4.2.0)
#>  lifecycle     1.0.3      2022-10-07 [1] CRAN (R 4.2.1)
#>  magrittr      2.0.3      2022-03-30 [1] RSPM (R 4.2.0)
#>  mime          0.12       2021-09-28 [1] RSPM (R 4.1.0)
#>  pillar        1.8.1      2022-08-19 [1] RSPM (R 4.2.0)
#>  pkgconfig     2.0.3      2019-09-22 [1] RSPM (R 4.1.0)
#>  png           0.1-7      2013-12-03 [1] RSPM (R 4.1.0)
#>  processx      3.7.0      2022-07-07 [1] RSPM (R 4.2.0)
#>  promises      1.2.0.1    2021-02-11 [1] RSPM (R 4.1.0)
#>  proxy         0.4-27     2022-06-09 [1] RSPM (R 4.2.0)
#>  ps            1.7.1      2022-06-18 [1] RSPM (R 4.2.0)
#>  purrr         0.3.5      2022-10-06 [1] RSPM (R 4.2.0)
#>  R.cache       0.16.0     2022-07-21 [1] RSPM (R 4.2.0)
#>  R.methodsS3   1.8.2      2022-06-13 [1] RSPM (R 4.2.0)
#>  R.oo          1.25.0     2022-06-12 [1] RSPM (R 4.2.0)
#>  R.utils       2.12.0     2022-06-28 [1] RSPM (R 4.2.0)
#>  R6            2.5.1      2021-08-19 [1] RSPM (R 4.1.0)
#>  raster        3.6-3      2022-09-18 [1] RSPM (R 4.2.0)
#>  Rcpp          1.0.9.4    2022-10-09 [1] local
#>  reprex        2.0.2      2022-08-17 [1] RSPM (R 4.2.0)
#>  rlang         1.0.6      2022-09-24 [1] RSPM (R 4.2.0)
#>  rmarkdown     2.17       2022-10-07 [1] CRAN (R 4.2.1)
#>  rstudioapi    0.14       2022-08-22 [1] RSPM (R 4.2.0)
#>  sessioninfo   1.2.2      2021-12-06 [1] RSPM (R 4.1.0)
#>  sf            1.0-8      2022-07-14 [1] CRAN (R 4.2.1)
#>  sp            1.5-0      2022-06-05 [1] RSPM (R 4.2.0)
#>  stringi       1.7.8      2022-07-11 [1] RSPM (R 4.2.0)
#>  stringr       1.4.1      2022-08-20 [1] RSPM (R 4.2.0)
#>  styler        1.7.0      2022-03-13 [1] RSPM (R 4.1.0)
#>  terra         1.6-17     2022-09-10 [1] CRAN (R 4.2.1)
#>  tibble        3.1.8      2022-07-22 [1] RSPM (R 4.2.0)
#>  tidyselect    1.1.2      2022-02-21 [1] RSPM (R 4.1.0)
#>  units         0.8-0      2022-02-05 [1] RSPM (R 4.2.0)
#>  utf8          1.2.2      2021-07-24 [1] RSPM (R 4.1.0)
#>  vctrs         0.4.2      2022-09-29 [1] RSPM (R 4.2.0)
#>  webshot       0.5.4      2022-09-26 [1] RSPM (R 4.2.0)
#>  webshot2      0.1.0      2022-05-18 [1] RSPM (R 4.2.0)
#>  websocket     1.4.1      2021-08-18 [1] RSPM (R 4.1.0)
#>  withr         2.5.0      2022-03-03 [1] RSPM (R 4.1.0)
#>  xfun          0.33       2022-09-12 [1] RSPM (R 4.2.0)
#>  xml2          1.3.3      2021-11-30 [1] RSPM (R 4.1.0)
#>  yaml          2.3.5      2022-02-21 [1] RSPM (R 4.1.0)
#>
#>  [1] /home/frs/R/x86_64-pc-linux-gnu-library/4.0
#>  [2] /opt/R/4.2.1/lib/R/library
#>
#> ──────────────────────────────────────────────────────────────────────────────I was surprised to find that installing tmap also depends on installing mapdeck. This is a pretty hefty dependency for what seems to be a relatively low level (and very used and highly handy) package.
It also seems mapdeck is only used in a couple of non mission-critical places: https://github.com/r-spatial/leafem/search?q=mapdeck&unscoped_q=mapdeck
I therefore suggest moving it to a Suggests. Plan to put in a PR doing just that.
Context: trying to reduce build times of geocomputation with R on GH Actions, currently over an hour! https://github.com/Robinlovelace/geocompr/issues/546
👋🏽 I maintain the cran checks badges. Please change to the new cran checks badge URL (e.g., https://badges.cranchecks.info/worst/dplyr.svg). Old badges at (e.g. https://cranchecks.info/badges/worst/dplyr) will be unavailable as of Jan 1st 2023.
Hello.
I'm trying to use the interactive option from leaflet while rendering a flatgeobuf file from leafem::addFgb, but I'm not getting the desired result:
library(sf)
library(leaflet)
library(leafem)

leaflet() %>%
      addTiles() %>%
      leafem::addFgb(url = "https://raw.githubusercontent.com/flatgeobuf/flatgeobuf/3.0.1/test/data/UScounties.fgb",
                               options = pathOptions(interactive = FALSE)
                )
Instead of using through pathOptions I also tried to use it as option = list(interactive = FALSE), but the layer is still emitting mouse events (hover and click).
Is there anything I'm missing here, or this option is not implemented?
Thank you for this package. It would be nice to update the package to use terra instead of raster, specifically the function "addImageQuery".
library(terra)
library(leaflet)
library(leafem)
library(plainview)

r <- rast(system.file("ex/elev.tif", package="terra"))
leaflet() %>%
    addRasterImage(r, group="elevation",  layerId="elevation") %>%
    addImageQuery(raster::raster(r), type='mousemove', layerId='elevation')%>%
    addMouseCoordinates()
Hi, i have the following RGB image:

The visualization its the result of this code:
plotRGB(brick(r,g,b))
Note plotRGB its not performing stretching.
And if i run this code, with default stretching:
m <- leaflet() %>%
  setView(lng=IPEX12.latlong$longitud, lat=IPEX12.latlong$latitud, zoom = 20)  %>%
  addProviderTiles(providers$Esri.WorldImagery) %>%
  addRasterRGB(brick(b,g,r))
m
The result is:

my question is if addRasterRGB can be used without stretching so that the result is the same as plotRGB
I tried the following without succes:
addRasterRGB(brick(b,g,r),quantiles = NULL, domain = NULL)
Thanks!.
Hello :)
I am using addlogo from Leafem on a leaflet map. This works as intended in my R function to produce a map with the logo. Let's say a parameter in the function is (ECDC or WHO). If WHO is selected a leaflet map with a WHO logo in the top right hand corner appears. If ECDC is selected a leaflet map with the ECDC logo appears. This works correctly if I run the function in Rstudio.
If I add this function to my shiny app, along with addlogo, the ability for the function to render new plots according to input is lost.
Do you have an examples of using addlogo in a shinyapp where an input changes the logo for the leaflet map produced?
Thank you
I'm testing addCOG with some data I have in an AWS S3 bucket. I tried to follow to the examples on other issues but cannot get a colored map, all I can get is a gray scale.
url <- 'https://chelsa-chile.s3.amazonaws.com/monthly/pet/CHELSA_pet_v2.1_19790201.tif'

min_scale = 0; max_scale = 1
js_scale = paste0("function (values) {
                    var scale = chroma.scale(['white', '#22c7e8']).domain([", min_scale, ",", max_scale, "]);
                    var val = values[0];
                    if (val === 0) return;
                    if (val < 0) return;
                    return scale(val).hex();
                    }")

leaflet(options = leafletOptions(attributionControl = FALSE)) %>%
  setView(lng =-70.09635, lat =  -33.01703, zoom = 4) %>%
  addProviderTiles("Esri.WorldImagery", group = "esri") %>%
  addMapPane("cog", zIndex = 500) %>%
  leafem:::addCOG(
    url = url
    , group = "PET"
    , opacity = 0.7
    , options = list(pane = "cog")
    # , resolution = 96
    , autozoom = FALSE
    , colorOptions = colorOptions(
      palette = terrain.colors(256)
    )
    , pixelValuesToColorFn = JS(js_scale)
  ) %>%
  addMouseCoordinates() %>%
  addLayersControl(
    baseGroups = c("esri")
    , overlayGroups =  c("PET")
  )
Also, I developed a shiny app to test addCOG and addGeoRaster which is in https://frzambra.shinyapps.io/visraster_app/
Any thoughts?
addImageQuery only works when I initially generate the map (see code block 1). However, the map is first generated and then modified with leafletProxy to add the raster and image query, the raster is added to the map but the query does not work (see code block 2).
Code block 1 (addImageQuery works):
library(leaflet)
library(plainview)
library(leafem)
library(shiny)

ui <- fluidPage(
  fluidRow(
    leafletOutput("map")
  )
)

server <- function(input, output) {
  output$map <- renderLeaflet({
    leaflet() %>%
      addProviderTiles("OpenStreetMap") %>%
      addRasterImage(poppendorf[[1]], project = TRUE, group = "poppendorf",
                     layerId = "poppendorf") %>%
      addImageQuery(poppendorf[[1]], project = TRUE,
                            layerId = "poppendorf",position="bottomleft",prefix = "") %>%
      addLayersControl(overlayGroups = "poppendorf")
  })
}

shinyApp(ui, server)
Code block 2 (raster added on click, addImageQuery does not work):
library(leaflet)
library(plainview)
library(leafem)
library(shiny)

ui <- fluidPage(
  fluidRow(
    leafletOutput("map")
  )
)

server <- function(input, output) {
  output$map <- renderLeaflet({
    leaflet() %>%
      addProviderTiles("OpenStreetMap") %>%
      setView(11.2,49.73,12)
  })

  counter <- reactiveValues(
    counter = 0
  )

  observeEvent(input$map_click,{
    counter$counter <- counter$counter + 1
    if (counter$counter == 1) {
      leafletProxy("map") %>%
        addRasterImage(poppendorf[[1]], project = TRUE, group = "poppendorf",
                       layerId = "poppendorf") %>%
        addImageQuery(poppendorf[[1]], project = TRUE,
                      layerId = "poppendorf",position="bottomleft",prefix = "") %>%
        addLayersControl(overlayGroups = "poppendorf")

    }
  })
}

shinyApp(ui, server)
Does anyone know a way to get the addImageQuery function to work with a leafletProxy call?
Hi,
while working on PR #2 , I noticed that some other functions may need to be moved to leafem from mapview. In particular, I think that both addExtent and addStaticLabels should be moved here (besides mapview::addStarsImage() that should already be dealt with in #1)
Since I'd like the functionality (allowing me to change a dependency within a package from mapview to the "lighter" leafem) I could draft a PR for this, if you wish.
Let me know,
Lorenzo
I tried installaling {leafem}, both from CRAN and from github, and it fails everytime.
> install.packages("leafem")

Installation du package dans ‘/home/joel/R/x86_64-pc-linux-gnu-library/4.1’
(car ‘lib’ n'est pas spécifié)
essai de l'URL 'https://cloud.r-project.org/src/contrib/leafem_0.1.6.tar.gz'
Content type 'application/x-gzip' length 3203539 bytes (3.1 MB)
==================================================
downloaded 3.1 MB

* installing *source* package ‘leafem’ ...
** package ‘leafem’ successfully unpacked and MD5 sums checked
** using staged installation
** R
** inst
** byte-compile and prepare package for lazy loading
double free or corruption (out)
Aborted (core dumped)
ERROR: lazy loading failed for package ‘leafem’
* removing ‘/home/joel/R/x86_64-pc-linux-gnu-library/4.1/leafem’

The downloaded source packages are in
	‘/tmp/RtmpHDKkt5/downloaded_packages’
Message d'avis :
Dans install.packages("leafem") :
  installation of package ‘leafem’ had non-zero exit status
Here is the output of sessionInfo:
R version 4.1.2 (2021-11-01)
Platform: x86_64-pc-linux-gnu (64-bit)
Running under: Ubuntu 20.04.3 LTS

Matrix products: default
BLAS:   /usr/lib/x86_64-linux-gnu/blas/libblas.so.3.9.0
LAPACK: /usr/lib/x86_64-linux-gnu/lapack/liblapack.so.3.9.0

locale:
 [1] LC_CTYPE=fr_FR.UTF-8       LC_NUMERIC=C
 [3] LC_TIME=fr_FR.UTF-8        LC_COLLATE=fr_FR.UTF-8
 [5] LC_MONETARY=fr_FR.UTF-8    LC_MESSAGES=fr_FR.UTF-8
 [7] LC_PAPER=fr_FR.UTF-8       LC_NAME=C
 [9] LC_ADDRESS=C               LC_TELEPHONE=C
[11] LC_MEASUREMENT=fr_FR.UTF-8 LC_IDENTIFICATION=C

attached base packages:
[1] stats     graphics  grDevices utils     datasets  methods   base

loaded via a namespace (and not attached):
[1] compiler_4.1.2 tools_4.1.2 Hi everyone,
The raster package announced it has been superseded by the "terra" package.
https://cran.r-project.org/web/packages/raster/index.html
Could addRasterRGB function support object in terra package in future?
Such as SpatRaster created by terra::rast() .
Thank you.
When checking the package without suggested package (as CRAN now routinely does), we get
Running examples in ‘leafem-Ex.R’ failed
The error most likely occurred in:

> ### Name: addReactiveFeatures
> ### Title: Add a reactive layer to map.
> ### Aliases: addReactiveFeatures
>
> ### ** Examples
>
> library(leaflet)
> library(leafem)
> library(sf)
Linking to GEOS 3.11.1, GDAL 3.6.4, PROJ 9.1.1; sf_use_s2() is TRUE
> library(geojsonsf)
>
> # create some random data
> che = st_as_sf(gadmCHE)
> pts = st_as_sf(st_sample(che, 200))
Error in st_segmentize.sfc(st_as_sfc(bb), units::set_units(1, "degree",  :
  package lwgeom required, please install it first
Calls: st_as_sf ... st_poly_sample -> st_bbox -> st_segmentize -> st_segmentize.sfc
Execution halted
* checking PDF version of manual ... OK
* DONE

Status: 1 ERROR, 1 NOTE
I could work on this in sf, but am not sure what to do-probably st_sample should fail anyway in this case (when working with geodetic coordinates) . The example should be conditional to lwgeom being present.
I'd like to have a different logo (or legend) depending on which baselayer is selected. (Is there a way to do this already?).
In Shiny, when using addPolygons() from leaflet, you can perform actions when a shape is clicked by using observeEvent on input$mapname_shape_click. However, when using addFgb(), clicking on the polygons doesn't register as a click event. It'd be really nice if this was possible. I switched over to addFgb() in a Shiny app - it significantly speeds up the plotting of large files, which is great, but it breaks functionality that depends on input$map_shape_click, and I'm struggling to find a suitable work-around.
Here's an example to demonstrate. Using a set of polygons, I plot half with addFgb()(blue) and half with addPolygons() (red). I set an observeEvent() on input$map_shape_click which creates a notification. Clicking on the red polygons (the ones created with addPolygons()) triggers the event, while clicking on the blue polygons (the ones created with addFgb()) doesn't.
library(leafem)
library(leaflet)
library(shiny)
library(terra)

# load in sample data
shp_path <- system.file("ex/lux.shp", package="terra")
shp <- vect(shp_path)
shp_ext <- unname(as.vector(ext(shp)))

# save out half of the features as a .fgb
fgb_path <- tempfile(fileext = ".fgb")
writeVector(shp[1:6,], fgb_path, filetype = "FlatGeobuf")

ui <- fluidPage(leafletOutput("map"))

server <- function(input, output){
  output$map <- renderLeaflet({
    leaflet("map") %>%
      fitBounds(shp_ext[1], shp_ext[3], shp_ext[2], shp_ext[4]) %>%
      addTiles(group = "Streets") %>%
      # plot half of the features with 'addFgb()' and half with 'addPolygons()'
      addFgb(fgb_path, fill = TRUE, fillColor = "blue", fillOpacity = 0.2) %>%
      addPolygons(data = shp[7:12], color = "red")
  })

  # show a notification when a shape is clicked
  observeEvent(input$map_shape_click, {
    showNotification("click registered", type = "error", duration = NULL)
  })
}

shinyApp(ui = ui, server = server)
Thanks for the great package!
This is likely misunderstanding on my part, but I was hoping to add multiple logos for two oranisations to my leaflet map.
I had assumed that something like this would give the desired result...
library(leaflet)
library(leafem)

img <- "https://www.r-project.org/logo/Rlogo.svg"

leaflet() %>%
  addTiles() %>%
  addLogo(img, url = "https://www.r-project.org/logo/") %>%
  addLogo(img, url = "https://www.r-project.org/logo/", offset.y = 100)
However, this only produces one logo. Is there a way to add more?
Cheers,
Hugh
Negative coordinates lose their sign.
library(leafem)
clip2sfc(" lon: -46.41847 | lat: -20.41248 | zoom: 3 ", clipboard = FALSE)
#> Geometry set for 1 feature
#> Geometry type: POINT
#> Dimension:     XY
#> Bounding box:  xmin: 46.41847 ymin: 20.41248 xmax: 46.41847 ymax: 20.41248
#> Geodetic CRS:  WGS 84
#> POINT (46.41847 20.41248)
Created on 2021-08-13 by the reprex package (v2.0.0)
Hi leafem Team!
I'm wondering how can I try a COG RGB image (S2 or drone) base on your solution of leafem:::addCog. I have already work around single bands but I cant find any example using COG with RGB and other parameters like bands selection layers or stretching.
I have a multi band 9 layers of sentinel 2
sr = 'https://storage.googleapis.com/terramodels-prod/raster/BLACK_GLACIER/ANDES/SR/SR_S2SR_T19HCD_2019-01-01.tif'

leaflet(options = leafletOptions(attributionControl = FALSE)) %>%
  setView(lng =-70.09841, lat = -33.037, zoom = 13) %>%
  addTiles(group = "osm") %>%
  addMapPane("cog", zIndex = 500) %>%
  leafem:::addCOG(
    url = sr,
    group = "RGB", opacity = 0.7,
    options = list(pane = "cog"),
    resolution = 16,
    autozoom = FALSE,
    rgb = TRUE
    # , colorOptions = colorOptions(
    #   palette = grDevices::hcl.colors(3, "Inferno")
    #   , breaks = seq(0, 1, 0.2)
    #   , domain = c(0, 100)
    #   , na.color = "#ff00ff88"
    # )
    # , pixelValuesToColorFn = JS(js_scale)
  ) %>%

  # addMouseCoordinates() %>%
  addLayersControl(
    baseGroups = c("esri")
    , overlayGroups =  c("RGB")
  )
Best regards!
Following the example in #25 where viridisLite::inferno is used in the colorOptions, what is the best way to add a legend with that palette?
I've tried:
pal <- colorNumeric(viridisLite::inferno, domain = values(myraster),
                    na.color = "transparent")
 addLegend(pal = pal, values = values(myraster))
as well as
addLegend(pal = viridisLite::inferno, values = values(myraster))
And neither work.
When opened in a browser the following .Rmd fails with
Fetch API cannot load file:///C:/Users/Tim/Desktop/test_georaster_files/stars-0.0.1/stars_layer.tif. URL scheme must be "http" or "https" for CORS request. ---
title: "Some title"
author: "Some author"
date: "Some date"
output:
html_document:
self_contained: false
---
```{r setup, include=FALSE}
knitr::opts_chunk$set(echo = TRUE)
```
```{r geotiff}
library(stars)
library(leaflet)
library(leafem)
tif = system.file("tif/L7_ETMs.tif", package = "stars")
(x1 = read_stars(tif))
strs = st_warp(x1, crs = 4326)
fl = tempfile(fileext = ".tif")
write_stars(strs, fl)
pal = grDevices::colorRampPalette(hcl.colors(9, "viridis"))
colops = colorOptions(
palette = pal
, domain = c(-1, 1)
, na.color = "#bebebe"
, breaks = NULL
)
ndvi = function(x) (x[4] - x[3]) / (x[4] + x[3])
leaflet() %>%
addTiles() %>%
addGeotiff(
file = fl
, group = "stars"
, resolution = 64
, arith = ndvi
, colorOptions = colops
)
```
If self_contained: true it works as apparently all attachements are being included in the html document. This is fine for small images, but will fail miserably for even medium sized tif filesf I fear.
To get this to work we need the latest dev version of leafem:
remotes::install_github("r-spatial/leafem")I assume that this isn't working because the .Rmd is not served via localhost. Not sure how to solve this...
Hi,
I just tried to add labels which extend over multiple lines to a map with addStaticLabels. Therefore I added the HTML tag <br> to the labels and marked them as HTML via htmltools::HTML. However, it did not work out and the full label was added to the map (see second example). I then tested the same approach with the addLabelOnlyMarkers function of leaflet and it worked.
# attach packages
library("sf")
#> Linking to GEOS 3.8.0, GDAL 3.0.4, PROJ 7.0.0
library("leaflet")
library("leafem")

# attach data
inp = read_sf(system.file("shape/nc.shp", package="sf"))[1:3, ]

# this works when using addLabelOnlyMarkers
xy = st_centroid(inp) %>% st_coordinates() %>% as.data.frame()
#> Warning in st_centroid.sf(inp): st_centroid assumes attributes are constant over
#> geometries of x
xy$label <- paste0("HERE IS <br> ", inp$NAME)

lopts = labelOptions(noHide = TRUE,
                     direction = 'top',
                     textOnly = TRUE)
leaflet(inp) %>%
  addProviderTiles("OpenStreetMap") %>%
  addFeatures(.) %>%
  addLabelOnlyMarkers(map = ., lng = xy[["X"]], lat = xy[["Y"]],
                      label = lapply(xy$label, htmltools::HTML),
                      labelOptions = lopts)
# ... but does not work when using leafem::addStaticLabels
leaflet(inp) %>%
  addProviderTiles("OpenStreetMap") %>%
  addFeatures(.) %>%
  leafem::addStaticLabels(map = .,
                          label = lapply(xy$label, htmltools::HTML),
                          labelOptions = lopts)
I just have taken a look at the addStaticLabels function and the reason why my approach did not work is that the labels are converted to character before they are passed on to the addLabelOnlyMarkers function.
map = leaflet::addLabelOnlyMarkers(map,
                                   lng = mat[, 1],
                                   lat = mat[, 2],

                                   label = as.character(label),

                                   group = group,
                                   layerId = layerId,
                                   labelOptions = dots)
Is there a reason why the labels have to be converted to character? If the as.character would be removed HTML tags could be used to format the labels.
Created on 2021-10-27 by the reprex package (v2.0.1)
After much trial and error using code from issue #25, I can't get NA values in my raster to be transparent.
Here's example code. Option A uses addGeotiff and option B uses addRasterImage.
Raster file available at: https://drive.google.com/file/d/1QbpOUPy_thsonsefdSZrEl2K1VDY0slw/view?usp=sharing
addGeotiff greatly improves raster load time for my application. I appreciate the work that's gone into development.
library(leaflet)
library(leafem)
library(raster)

raster_path <- "C:/Users/Derek/Google Drive/RCrk/BSU_ScholorWorks_Archive/Pierson_RCrk_Soil-C-modeling_data/Spatial Data/Spatial forcing rasters/RCrk_MAST_estimate.tif"

# Create leaflet map and set map location + zoom
map <- leaflet() %>%
  addProviderTiles("Esri.WorldImagery",
                   group = "Esri.WorldImagery",
                   options = providerTileOptions(opacity = 1)) %>%
  setView(lng = -116.75, lat = 43.16, zoom = 11)

# OPTION A
### Adding raster using addGeotiff
map %>% addGeotiff(raster_path,
           colorOptions = colorOptions(
            palette = colorRampPalette(c("#05475e", "#faff78", "#ff9a00", "#ff3500"))(100) ,
             breaks = c(5:15),
             na.color = "transparent"),
           opacity = 1,
           group = "MAST")

# OPTION B
### Adding raster using addRasterImage
# Load raster and make a color palette
raster_img <- raster(raster_path)
raster_vals <- values(raster_img)
MAST_pal <- colorBin(palette = c("#05475e", "#faff78", "#ff9a00", "#ff3500"),
                     domain = raster_vals,
                     bins = c(5:15),
                     pretty = TRUE,
                     na.color = "transparent")
# Add raster to map
map %>% addRasterImage(raster_img, colors = MAST_pal, opacity = 1, group = "MAST")
A continuation from https://twitter.com/_davecooley/status/1316992144226144256
A function to read and render mbtiles files or their respective folder structure version (.pbf files) should be easy enough... With mapview in mind, the hard thing is to create these tiles on the fly from a e.g. sf object. tippecanoe is fast but for "deep zoom" scenarios it is still way too slow. Running in background doesn't help as the leaflet copies the folder(s) on map creation to a different place so every tile set created afterwards is lost. Maybe this could be somehow addressed in htmlwidgets?
In any case, here's what I have so far:
library(sf)
library(leaflet)
library(htmlwidgets)
library(htmltools)
library(mapboxapi)
library(processx)

url = "https://raw.githubusercontent.com/bjornharrtell/flatgeobuf/3.0.1/test/data/UScounties.fgb"

tst = st_read(url)
tst = tst[, -5] # tippecanoe has a problem with the NAME column (not being proper utf8)

fldr = tempfile()
fl = tempfile(fileext = ".geojson")
st_write(tst, fl, append = FALSE)

system.time({
    st_write(
        tst
        , dsn = fldr
        , driver = "MVT"
        , dataset_options = c(
            "FORMAT=DIRECTORY"
            , "COMPRESS=NO"
            , "MAXZOOM=10"
        )
        , delete_dsn = TRUE
    )
})

dir.create(fldr)
command = sprintf(
    "tippecanoe -zg -f -pC -e %s %s"
    , fldr
    , fl
)
system.time({
    system(command)
})

system.time({
    processx::run(
        "tippecanoe"
        , args = c("-z 10", "-f", "-pC", "-e", fldr, fl)
    )
})

p = processx::process$new(
    "tippecanoe"
    , args = c("-z 10", "-f", "-pC", "-e", fldr, fl)
)
p$is_alive()

leafgrid = htmlDependency(
    name = "Leaflet.VectorGrid"
    , version = "1.3.0"
    , src = c(href = "https://unpkg.com/leaflet.vectorgrid@latest/dist/")
    , script = "Leaflet.VectorGrid.bundled.js"
)

registerPlugin <- function(map, plugin) {
    map$dependencies <- c(map$dependencies, list(plugin))
    map
}

tiledDataDependency <- function(tiles_dir) {
    htmltools::htmlDependency(
        name = basename(tiles_dir),
        version = "0.0.1",
        src = c(file = tiles_dir)
    )
}


leaflet() %>%
    addTiles() %>%
    registerPlugin(leafgrid) %>%
    registerPlugin(tiledDataDependency(fldr)) %>%
    setView(lng = -105.644, lat = 51.618, zoom = 3) %>%
    onRender(
        paste0(
            "function(el, x) {
                var pbfLayer = L.vectorGrid.protobuf('lib/"
                , basename(fldr)
                , "-0.0.1/{z}/{x}/{y}.pbf');
                pbfLayer.addTo(this);
            }"
        )
    ) %>%
leafem::addMouseCoordinates()@trafficonese would you mind having a look into making addImageQuery work for multiple layers? As in
library(leaflet)
library(leafem)
library(plainview)

leaflet() %>%
  addProviderTiles("OpenStreetMap") %>%
  addRasterImage(poppendorf[[1]], project = TRUE, group = "poppendorf1",
                 layerId = "poppendorf1") %>%
  addImageQuery(poppendorf[[1]], project = TRUE,
                layerId = "poppendorf1") %>%
  addRasterImage(poppendorf[[4]], project = TRUE, group = "poppendorf2",
                 layerId = "poppendorf2") %>%
  addImageQuery(poppendorf[[4]], project = TRUE,
                layerId = "poppendorf2") %>%
  addLayersControl(overlayGroups = c("poppendorf1", "poppendorf2"))
At the moment, this only shows the image query values for layerId "poppendorf2". I've just pushed an update which registers the data arrays for the two layers with the map (I know the names are messed up....) but I cannot figure out how to adjust either addImageQuery-bindings.js or joda.js to properly read /display the arrays for both layerIds.
Your help would be much appreciated!
When trying to set fillColor in addFgb(), the polygons are not colored...
library(leaflet)
library(leafem)
library(sf)
#> Linking to GEOS 3.8.0, GDAL 3.1.2, PROJ 7.0.0

fgb_file <- tempfile(fileext = ".fgb")
st_write(mapview::franconia, fgb_file)

leaflet() %>%
  addTiles() %>%
  leafem::addFgb(fgb_file, fillColor = "red", color = "black", weight = 1) %>%
  leafem::addMouseCoordinates() %>%
  setView(10.8, 49.8, 7)
I would expect to see a map like this
# expected
leaflet() %>%
  addTiles() %>%
  addPolygons(data = mapview::franconia, fillColor = "red", color = "black", weight = 1)
Ps. Loving the fgb functionality, really helpful for larger datasets!
pps. If fgb_file points to an empty file, the r session crashes (at least in RStudio).
leaflet() %>%
addFgb(file = "totally-not-existing.fgb")leafem/inst/htmlwidgets/lib/FlatGeoBuf/fgb.js
Line 132 in 0016ec1
I can recommend eslint. :)
As stated in the title, I need to be able to remove a GeoRaster and replace it with a different one in a shiny app. Is there a way to do this?
I'm quite sure it's a problem with my machine, but I'm a loss in understanding the possible solution
 *** caught segfault ***
address (nil), cause 'unknown'

Traceback:
 1: CPL_crs_from_input(x)
 2: make_crs(paste0("EPSG:", x))
 3: st_crs.numeric(3857)
 4: sf::st_crs(3857)
 5: eval(exprs[i], envir)
 6: eval(exprs[i], envir)
 7: sys.source(codeFile, env, keep.source = keep.source, keep.parse.data = keep.parse.data)
 8: doTryCatch(return(expr), name, parentenv, handler)
 9: tryCatchOne(expr, names, parentenv, handlers[[1L]])
10: tryCatchList(expr, classes, parentenv, handlers)
11: tryCatch(expr, error = function(e) {    call <- conditionCall(e)    if (!is.null(call)) {        if (identical(call[[1L]], quote(doTryCatch)))             call <- sys.call(-4L)        dcall <- deparse(call, nlines = 1L)        prefix <- paste("Error in", dcall, ": ")        LONG <- 75L        sm <- strsplit(conditionMessage(e), "\n")[[1L]]        w <- 14L + nchar(dcall, type = "w") + nchar(sm[1L], type = "w")        if (is.na(w))             w <- 14L + nchar(dcall, type = "b") + nchar(sm[1L],                 type = "b")        if (w > LONG)             prefix <- paste0(prefix, "\n  ")    }    else prefix <- "Error : "    msg <- paste0(prefix, conditionMessage(e), "\n")    .Internal(seterrmessage(msg[1L]))    if (!silent && isTRUE(getOption("show.error.messages"))) {        cat(msg, file = outFile)        .Internal(printDeferredWarnings())    }    invisible(structure(msg, class = "try-error", condition = e))})
12: try(sys.source(codeFile, env, keep.source = keep.source, keep.parse.data = keep.parse.data))
13: loadNamespace(package = package, lib.loc = lib.loc, keep.source = keep.source,     keep.parse.data = keep.parse.data, partial = TRUE)
14: withCallingHandlers(expr, packageStartupMessage = function(c) tryInvokeRestart("muffleMessage"))
15: suppressPackageStartupMessages(loadNamespace(package = package,     lib.loc = lib.loc, keep.source = keep.source, keep.parse.data = keep.parse.data,     partial = TRUE))
16: code2LazyLoadDB(package, lib.loc = lib.loc, keep.source = keep.source,     keep.parse.data = keep.parse.data, compress = compress, set.install.dir = set.install.dir)
17: tools:::makeLazyLoading("leafem", "/usr/local/share/public/R_library/00LOCK-leafem/00new",     keep.source = FALSE, keep.parse.data = FALSE, set.install.dir = "/usr/local/share/public/R_library/leafem")
An irrecoverable exception occurred. R is aborting now ...
Segmentation fault
ERROR: lazy loading failed for package ‘leafem’
* removing ‘/usr/local/share/public/R_library/leafem’
* restoring previous ‘/usr/local/share/public/R_library/leafem’
Warning in install.packages :
  installation of package ‘leafem’ had non-zero exit status
In #25 I've been keeping track of the development for the new js functionality to add geotiff data to a leaflet map. The API has changed enough so that most examples over there won't work anymore. Hence, dev-tracking will continue here.
The "new" API has a few advantages over the old one:
addGeotiff as opposed to addGeorasterarith argument as opposed to some string representationarithMath. functions (https://twitter.com/TimSalabim3/status/1301078413315317761) though we are still using the evil eval in one place... to be addressedaddRGB (for both stars and raster objects). We set rgb to TRUE in addGeotiff and the specified bands will be used to create a RGB image (again, this happens in the browser - no pre-calculation in R)Examples to follow...
Hi I came across this issue #15 when troubleshoot my current issue with ImageQuery; thought I'll give this a try and see if this is a feature problem or that I should seek for workaround. My Shiny app starts out displaying a RasterLayer and the user can "update" the RasterLayer by, say moving the slider left or right. In my Shiny code, since I use renderLeaflet, my idea is that everytime user move the slider, a new leaflet map is created with the raster values updated. However, the ImageQuery doesn't update according to this new raster and leaflet map. Here's a simplified example of the problem:
library(leaflet)
library(plainview)
library(leafem)
library(shiny)

ras <- poppendorf[[1]]

ui <- fluidPage(
  fluidRow(
    sliderInput("factor", "Factor for raster values",
                min = 0.5, max = 2, value = 1),
    leafletOutput("map")
  )
)

server <- function(input, output) {
  output$map <- renderLeaflet({
    ras1 <- ras * input$factor

    leaflet() %>%
      addRasterImage(ras1, project = TRUE, group = "poppendorf",
                     layerId = "poppendorf") %>%
      addImageQuery(ras1, project = TRUE,
                    layerId = "poppendorf",position="bottomleft",prefix = "") %>%
      addLayersControl(overlayGroups = "poppendorf")

  })
}

shinyApp(ui, server)
The shiny app starts out with a leaflet map with raster. Mouseover shows the values are around 9000 something. Now when I slide to factor of 2, the raster values would be updated to 18000 something. However, when mouseover the layer, those values remain at 9000 something. It seems like ImageQuery retains its memory even if a new leaflet map is created and a new raster is used. Is this an expected behaviour? Am I doing my leaflet right? (I'm relatively new to this...)
Thanks!
Ben
From @nekronaut r-spatial/mapview#290:
I am trying to save mapview generated maps including local images to html, using addLogo and mapshot. Although locally saved images are displayed in the viewer/browser, they are not saved to file. Let me demonstrate...
Saving these examples from the documentation work, but they use remote images. For simplicity's sake, I prefer using mapview syntax, but I have also tried leaflet notation:
library(mapview)
library(leaflet)
library(leafem)

#mapview syntax
m1 <- mapview(breweries)
m1 <- addLogo(m1, "https://jeroenooms.github.io/images/banana.gif",
        position = "bottomleft",
        offset.x = 5,
        offset.y = 40,
        width = 100,
        height = 100)
mapshot(m1, url = paste0(getwd(), "\\test1.html"))

#leaflet syntax
img <- "https://www.r-project.org/logo/Rlogo.svg"
m2 <- leaflet() %>%
        addTiles() %>%
        addLogo(img, url = "https://www.r-project.org/logo/")
mapshot(m2, url = paste0(getwd(), "\\test2.html"))
Unfortunately, no such luck when using locally saved images:
download.file(url="https://www.r-project.org/logo/Rlogo.svg", destfile=paste0(getwd(), "\\Rlogo.svg")

#mapview syntax
m3 <- mapview(breweries)
m3 <- addLogo(m3, paste0(getwd(), "\\Rlogo.svg"),
        src = "local",
        position = "bottomleft",
        offset.x = 5,
        offset.y = 40,
        width = 100,
        height = 100)
mapshot(m3, url = paste0(getwd(), "\\test3.html"))

#leaflet syntax
m4 = leaflet() %>%
       addTiles() %>%
       addLogo(paste0(getwd(), "\\Rlogo.svg"), src = "local")
mapshot(m4, url = paste0(getwd(), "\\test4.html"))
I have looked at the available documentation as well as here and here. Is this a bug, or am I missing something?
First of all, thanks so much for providing the leafem package -- it offers wonderful and elegant functionality for leaflet maps.
I'm not sure if this is a bug or a feature request for leafem, but wanted to let you know about an issue I'm having with the addImageQuery function. I'm writing a shiny app that generates a raster based on user input, and I would like to add this raster to a leaflet map and then have the raster values be displayed using addImageQuery.
So far I've only been able to use the addImageQuery function when I initially generate the map (see example in code block 1). However, when I first generate the map and then use leafletProxy to add the raster and image query, the raster is added to the map but the query does not work (see example in code block 2).
Code block 1 (addImageQuery works):
library(leaflet)
library(plainview)
library(leafem)
library(shiny)

ui <- fluidPage(
  fluidRow(
    leafletOutput("map")
  )
)

server <- function(input, output) {
  output$map <- renderLeaflet({
    leaflet() %>%
      addProviderTiles("OpenStreetMap") %>%
      addRasterImage(poppendorf[[1]], project = TRUE, group = "poppendorf",
                     layerId = "poppendorf") %>%
      addImageQuery(poppendorf[[1]], project = TRUE,
                            layerId = "poppendorf",position="bottomleft",prefix = "")
  })
}

shinyApp(ui, server)
Code block 2 (raster added on click, addImageQuery produces a small "bubble" in the bottom left corner but does not display any values):
library(leaflet)
library(plainview)
library(leafem)
library(shiny)

ui <- fluidPage(
  fluidRow(
    leafletOutput("map")
  )
)

server <- function(input, output) {
  output$map <- renderLeaflet({
    leaflet() %>%
      addProviderTiles("OpenStreetMap") %>%
      setView(11.2,49.73,12)
  })

  counter <- reactiveValues(
    counter = 0
  )

  observeEvent(input$map_click,{
    counter$counter <- counter$counter + 1
    if (counter$counter == 1) {
      leafletProxy("map") %>%
        addRasterImage(poppendorf[[1]], project = TRUE, group = "poppendorf",
                       layerId = "poppendorf") %>%
        addImageQuery(poppendorf[[1]], project = TRUE,
                      layerId = "poppendorf",position="bottomleft",prefix = "")

    }
  })
}

shinyApp(ui, server)
It would be great to have addImageQuery work with leafletProxy calls.
I am having issues with transparent colors for the NA values in the raster (GeoTIFF). I tried different values for na.color = "transparent" and all gave the same black result, using CRAN (v 0.1.6) and dev (SHA1 660d988) being the same in this regard.
library(leaflet)
library(leafem)

leaflet() %>%
        addProviderTiles("Esri.WorldImagery") %>%
        addGeotiff(
          url = "https://peter.solymos.org/testapi/amro1k.tif",
          project = FALSE,
          opacity = 0.8,
          colorOptions = colorOptions(
             palette = hcl.colors(50, palette = "inferno"),
             domain = c(0, 0.62),
             na.color = "transparent"))
Is there a way in leafem::addLogo to open the url in a new tab, a.k.a. target='_blank' ?
Hi thanks for the nice tool! Can you please add a line
if( strip !==null) strip.remove();
(see image below) To avoid error if the DOM element is not present? Thanks

Consider an a update_style argument which allows labelling of points and also highlights those points which are selected in the base layer. When we have multiple points selected, displaying many point on the reactive layer, it is not clear which ones they are to deselect them.
A declarative, efficient, and flexible JavaScript library for building user interfaces.
🖖 Vue.js is a progressive, incrementally-adoptable JavaScript framework for building UI on the web.
TypeScript is a superset of JavaScript that compiles to clean JavaScript output.
An Open Source Machine Learning Framework for Everyone
The Web framework for perfectionists with deadlines.
A PHP framework for web artisans
Bring data to life with SVG, Canvas and HTML. 📊📈🎉
JavaScript (JS) is a lightweight interpreted programming language with first-class functions.
Some thing interesting about web. New door for the world.
A server is a program made to process requests and deliver data to clients.
Machine learning is a way of modeling and interpreting data that allows a piece of software to respond intelligently.
Some thing interesting about visualization, use data art
Some thing interesting about game, make everyone happy.
We are working to build community through open source technology. NB: members must have two-factor auth.
Open source projects and samples from Microsoft.
Google ❤️ Open Source for everyone.
Alibaba Open Source for everyone
Data-Driven Documents codes.
China tencent open source team.


