Giter Site home page Giter Site logo

noncensus's Introduction

noncensus

The R package noncensus provides a collection of various regional information determined by the U.S. Census Bureau along with demographic data.

Installation

You can install the latest package version by typing the following at the R console:

library(devtools)
install_github('ramhiser/noncensus')

Usage

Once you have installed and loaded the noncensus package, you can load a data set with the data command. For instance, U.S. states in the region denoted West can be viewed as such:

data(states)
subset(states, region == "West")

   state       name region division        capital   area population
1     AK     Alaska   West  Pacific         Juneau 589757    4779736
4     AZ    Arizona   West Mountain        Phoenix 113909    2915918
5     CA California   West  Pacific     Sacramento 158693   37253956
6     CO   Colorado   West Mountain         Denver 104247    5029196
12    HI     Hawaii   West  Pacific       Honolulu   6450    1360301
14    ID      Idaho   West Mountain          Boise  83557   12830632
27    MT    Montana   West Mountain         Helena 147138     989415
33    NM New Mexico   West Mountain       Santa Fe 121666   19378102
34    NV     Nevada   West Mountain    Carson City 110540    9535483
38    OR     Oregon   West  Pacific          Salem  96981    3831074
45    UT       Utah   West Mountain Salt Lake City  84916    2763885
48    WA Washington   West  Pacific        Olympia  68192    6724540
51    WY    Wyoming   West Mountain       Cheyenne  97914     563626

We also provide data for all U.S. counties, which are uniquely identified by FIPS county codes. The counties data set contains all of the U.S. counties and county equivalents along with Combined Statistical Area (CSA) and Core-Based Statistical Area (CSBA).

data(counties)
head(counties)
     county_name state state_fips county_fips fips_class  CSA  CBSA population
1 Autauga County    AL         01         001         H1 <NA> 33860      54571
2 Baldwin County    AL         01         003         H1  380 19300     182265
3 Barbour County    AL         01         005         H1 <NA>  <NA>      27457
4    Bibb County    AL         01         007         H1  142 13820      22915
5  Blount County    AL         01         009         H1  142 13820      57322
6 Bullock County    AL         01         011         H1 <NA>  <NA>      10914

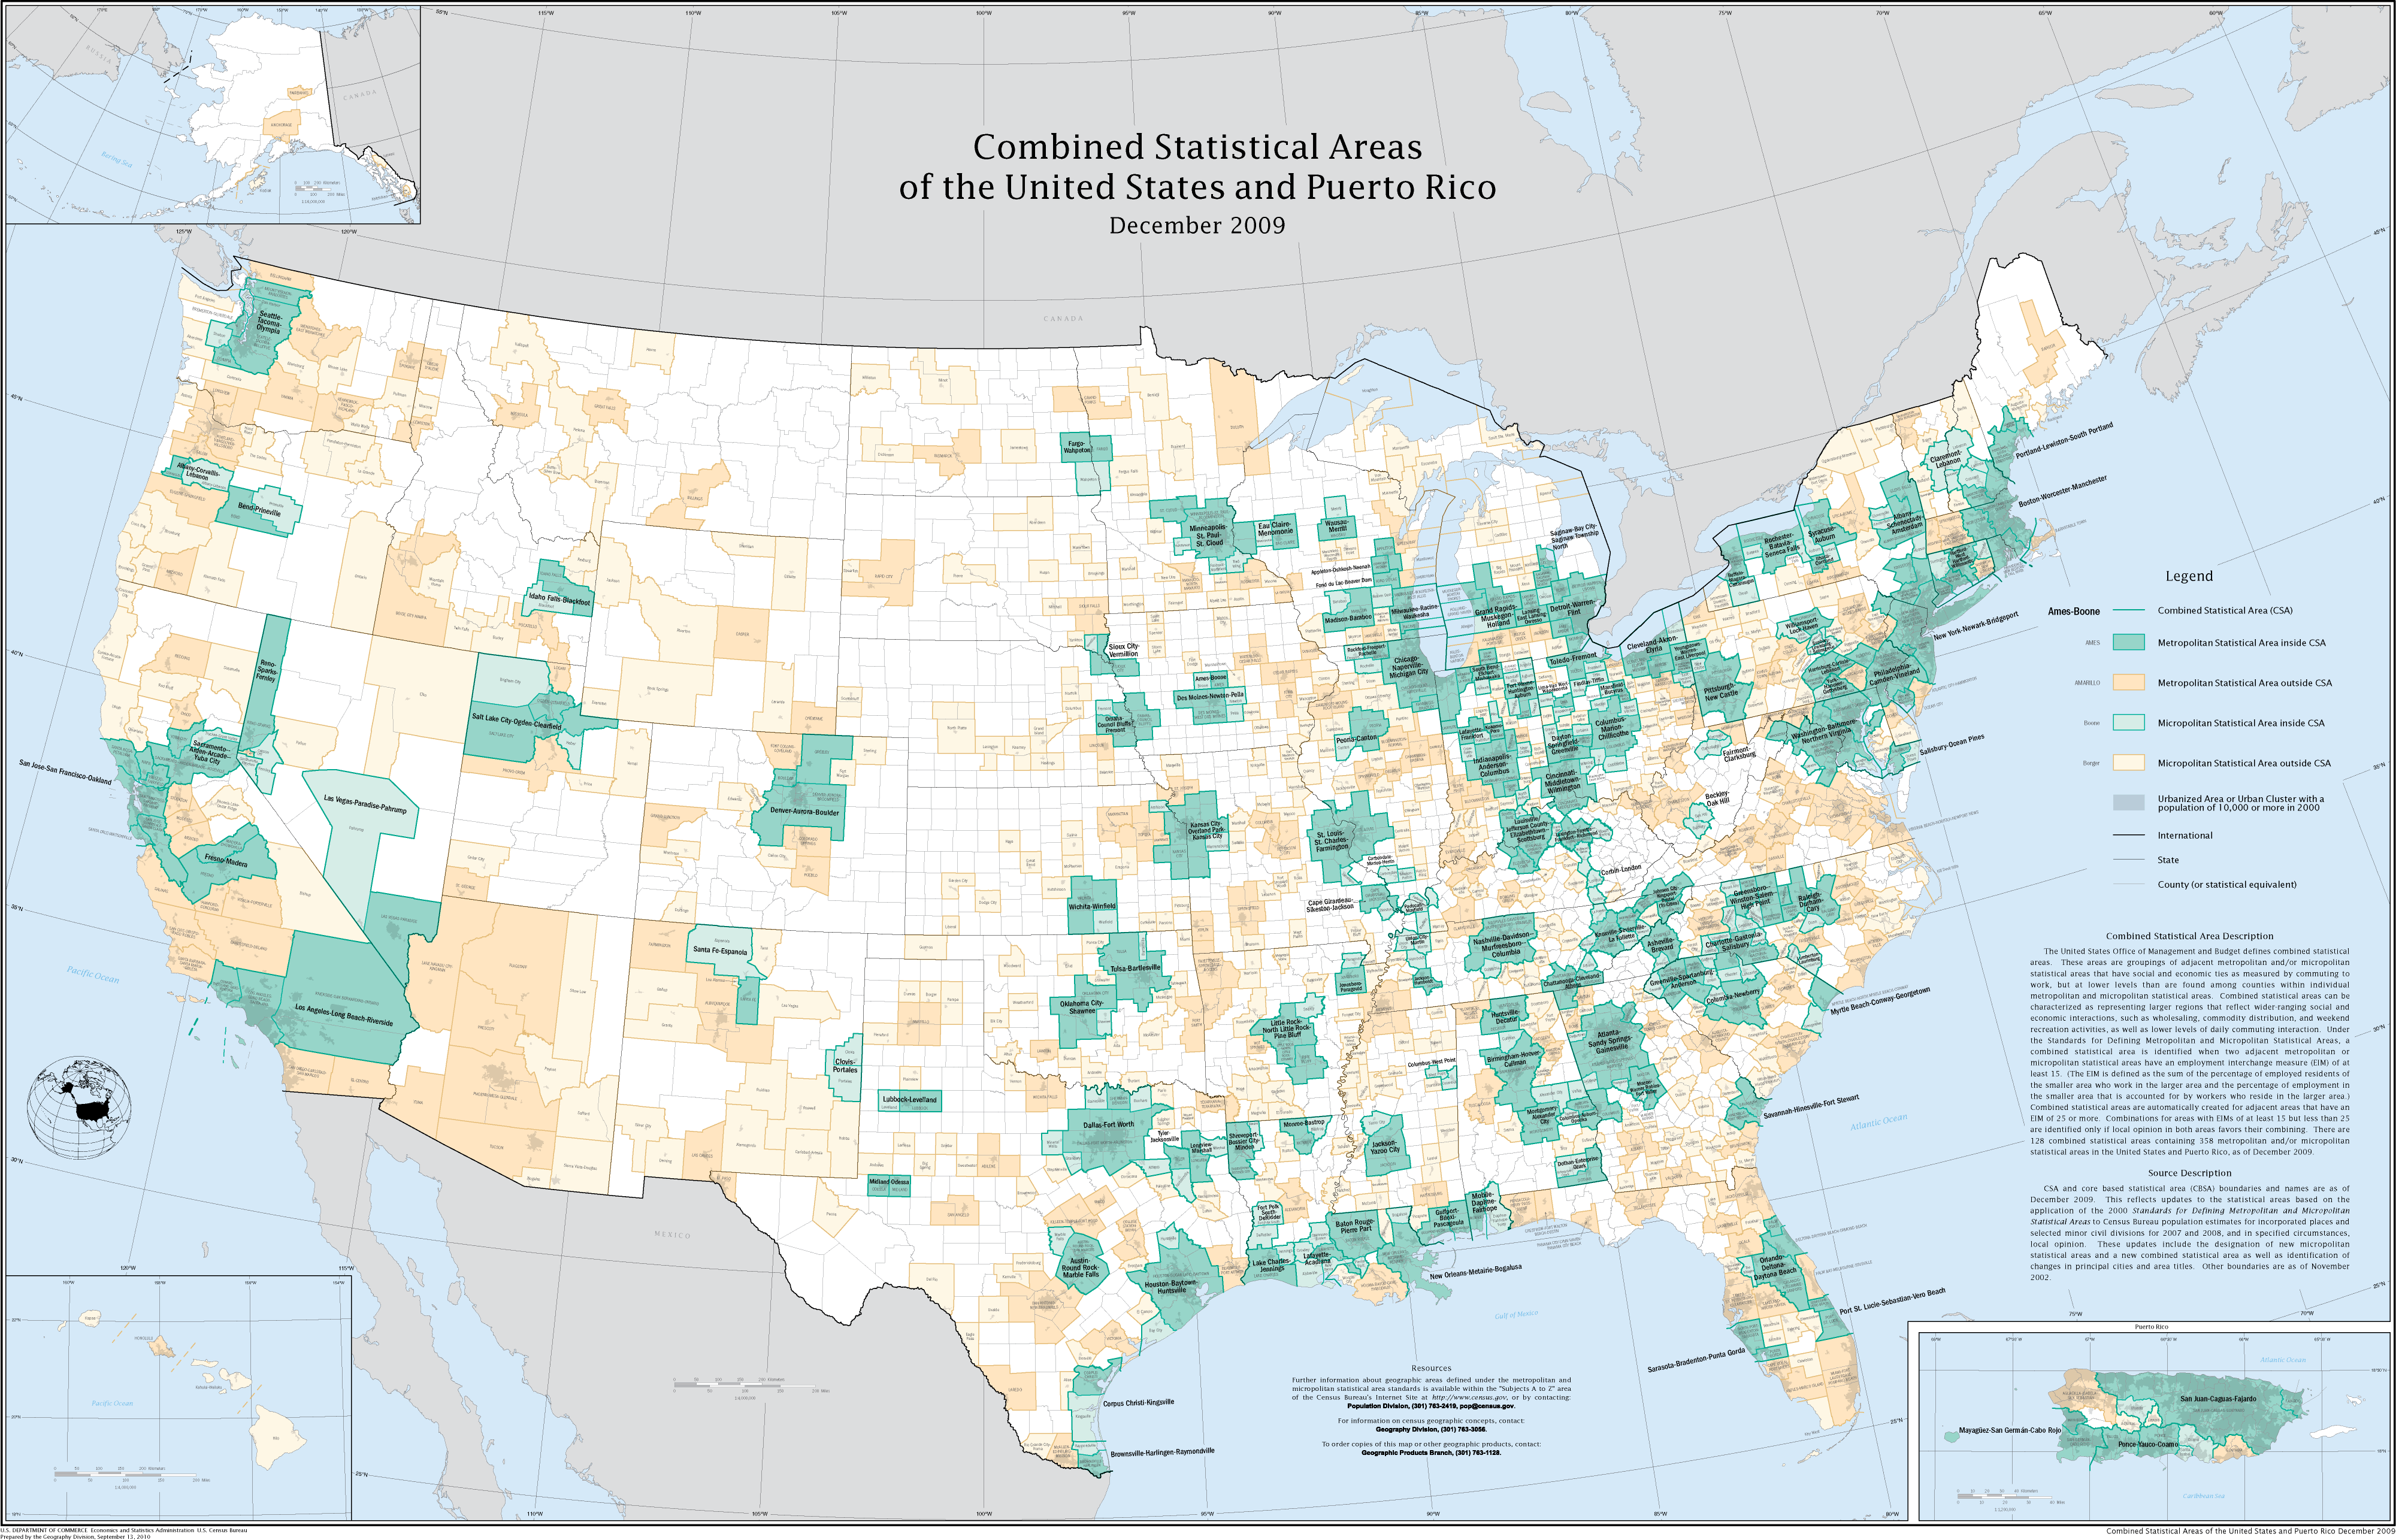
Details about the data stored in counties can be obtained via ?counties, including details regarding CSA and CBSA. The following image from Wikipedia summarizes the statistical areas well:

U.S. Statistical Areas

It is sometimes useful to map FIPS codes at the county level to the more granular zip codes. However, these data are seldom available and are tedious to come by. We provide such a mapping in zip_codes:

data(zip_codes)
head(zip_codes, 10)
     zip        city state latitude longitude  fips
1  00210  Portsmouth    NH  43.0059  -71.0132 33015
2  00211  Portsmouth    NH  43.0059  -71.0132 33015
3  00212  Portsmouth    NH  43.0059  -71.0132 33015
4  00213  Portsmouth    NH  43.0059  -71.0132 33015
5  00214  Portsmouth    NH  43.0059  -71.0132 33015
6  00215  Portsmouth    NH  43.0059  -71.0132 33015
7  03040 East Candia    NH  43.0059  -71.0132 33015
8  03041  East Derry    NH  43.0059  -71.0132 33015
9  03073 North Salem    NH  43.0059  -71.0132 33015
10 03802  Portsmouth    NH  43.0059  -71.0132 33015

noncensus's People

Contributors

kschaef avatar ramhiser avatar

Stargazers

 avatar  avatar  avatar  avatar  avatar  avatar  avatar  avatar  avatar  avatar  avatar  avatar  avatar  avatar  avatar  avatar  avatar  avatar  avatar  avatar  avatar  avatar  avatar  avatar  avatar  avatar

Watchers

 avatar  avatar  avatar  avatar  avatar

noncensus's Issues

Populations in states data are misaligned

Quote from an email from Dan Irons:

In the “states” dataset, state populations appear to have been misassigned. For example, the populations of Alaska and Alabama have been transposed, likewise the populations of Arkansas and Alabama, and so on with each pair of states on down the list (although I haven’t checked every row). I haven’t looked at the package source to determine where the errors are introduced, and of course it is entirely possible that the errors were inherited from the data sources that you took the data from.

shiny_choro throws non-numeric error

When running the example in shiny_choro, the following error is thrown:

Error in (1 - h) * qs[i] : non-numeric argument to binary operator

After a bit of debugging, I traced the problem to the line that reads:

cuts <- unique(quantile(df$fill, seq(0, 1, 1/5)))

Notice that df$fill is a character vector:

 Browse[2]> head(df$fill)
 [1] "0 - 4"   "10 - 14" "15 - 19" "20 - 24" "25 - 29" "30 - 34"

Add functions to query census.gov's API

Currently, noncensus munges much of the data provided in raw form from census.gov. The Census Bureau recently introduced a data API that requires an API key.

Functions should be written to query the API and download the data in the appropriate format. These data can then be transformed into a standard format (e.g., CSV, TopoJSON, GeoJSON) for consumption.

Latitude/Longitude Boundaries for Counties

Hadley Wickham provided a ggplot2 solution to Revolution's Choropleth Map R Challenge. An SO post also provides updated code. Hadley's solution determines the county boundaries in terms of latitude and longitude.

In general, having county boundaries would make plotting with ggplot2 easier. Boundaries are given in ggplot2::map_data("county"). However, map_data does not include a FIPS code, so the mapping is a bit challenging.

For instance, this almost works:

counties$county <- tolower(gsub(" County$", "", counties$county_name))
county_boundaries <- inner_join(counties, county_df, by="county")
head(county_boundaries)
     county_name state.x state_fips county_fips fips_class  CSA  CBSA population  county      lat group
1 Autauga County      AL         01         001         H1 <NA> 33860      54571 autauga 32.34920     1
2 Autauga County      AL         01         001         H1 <NA> 33860      54571 autauga 32.35493     1
3 Autauga County      AL         01         001         H1 <NA> 33860      54571 autauga 32.36639     1
4 Autauga County      AL         01         001         H1 <NA> 33860      54571 autauga 32.37785     1
5 Autauga County      AL         01         001         H1 <NA> 33860      54571 autauga 32.38357     1
6 Autauga County      AL         01         001         H1 <NA> 33860      54571 autauga 32.37785     1
  state.y      long order
1      AL -86.50517     1
2      AL -86.53382     2
3      AL -86.54527     3
4      AL -86.55673     4
5      AL -86.57966     5
6      AL -86.59111     6

However, not every county is mapped cleanly:

# Should be nrow(counties) - # of county equivalents
> nlevels(factor(county_boundaries$county))
[1] 1716
# Should be 50
> nlevels(factor(county_boundaries$state.x))
[1] 47

Error in shiny_choro example

Based on latest commit in shiny_map branch...

The population_age data frame is not visible within the example after it's loaded. Wrong environment?

 > library(noncensus)
 > example(shiny_choro)

 shny_c> data(population_age, package="noncensus")

 shny_c> shiny_choro(population_age, fill = "age_group", categories = "population",
 shny_c+             palette = "Purples", background = "Grey")
 Loading required package: shiny
 Loading required package: dplyr

 Attaching package:dplyrThe following objects are masked frompackage:stats:

     filter, lag

 The following objects are masked frompackage:base:

     intersect, setdiff, setequal, union

 Loading required package: leaflet
 Error in match(x, table, nomatch = 0L) (from Rex5c4a2853a311#8) :
   object 'population_age' not found
 >

Speed up loading of shiny_choro

Currently, the Shiny app launched by shiny_choro is too slow when Shiny is initialized. After the app is loaded, the speed of the app is reasonable. This suggests that the bottleneck is either in shiny_choro() or in the Shiny app's global.r file.

Example to replicate behavior:

library(noncensus)
example(shiny_choro)

County -> CSA/CBSA needs year, right?

The BLS moves counties between metro areas in some years, but it seems that the data set here is just a snapshot of the county assignments at some unspecified year. If that's correct, I think you should document which year it is or extend the data by adding a year column. In the latter case, I think the package would be very useful to a lot of folks working with Census data. Thanks!

Still maintained?

I see that much of this package hasn't been changed for several months and yet it is still ahead of CRAN. Is this development version still under development or is it intended to be updated on CRAN anytime soon?

Speed up filtering in Shiny app

After the Shiny app is launched via shiny_choro, the rendering after a dropdown has been selected needs to be sped up. Currently, this delay can take 2-3 seconds and should be closer to instantaneous. It's possible that the bottleneck is the leaflet package, but it's unclear at the moment.

Example to replicate behavior:

library(noncensus)
example(shiny_choro)

Write vignette demoing choropleth Shiny app

  • Provide an overview of how to use and the insight gained from the Shiny app generated by shiny_choro
  • Discuss both example(shiny_choro) and explore_counties()
  • Provide example applying shiny_choro to a standalone data set

Recommend Projects

  • React photo React

    A declarative, efficient, and flexible JavaScript library for building user interfaces.

  • Vue.js photo Vue.js

    🖖 Vue.js is a progressive, incrementally-adoptable JavaScript framework for building UI on the web.

  • Typescript photo Typescript

    TypeScript is a superset of JavaScript that compiles to clean JavaScript output.

  • TensorFlow photo TensorFlow

    An Open Source Machine Learning Framework for Everyone

  • Django photo Django

    The Web framework for perfectionists with deadlines.

  • D3 photo D3

    Bring data to life with SVG, Canvas and HTML. 📊📈🎉

Recommend Topics

  • javascript

    JavaScript (JS) is a lightweight interpreted programming language with first-class functions.

  • web

    Some thing interesting about web. New door for the world.

  • server

    A server is a program made to process requests and deliver data to clients.

  • Machine learning

    Machine learning is a way of modeling and interpreting data that allows a piece of software to respond intelligently.

  • Game

    Some thing interesting about game, make everyone happy.

Recommend Org

  • Facebook photo Facebook

    We are working to build community through open source technology. NB: members must have two-factor auth.

  • Microsoft photo Microsoft

    Open source projects and samples from Microsoft.

  • Google photo Google

    Google ❤️ Open Source for everyone.

  • D3 photo D3

    Data-Driven Documents codes.