Giter Site home page Giter Site logo

randyzwitch / echarts.jl Goto Github PK

View Code? Open in Web Editor NEW
82.0 6.0 9.0 6.63 MB

Julia package for the Apache ECharts v4 visualization library

Home Page: https://randyzwitch.com/ECharts.jl/

License: Other

Julia 100.00%
echarts julia-language visualization interactive-visualizations charting-library julialang

echarts.jl's Introduction

ECharts

Linux:
Windows 64bit:
Codecov: codecov

Documentation: http://randyzwitch.com/ECharts.jl/

2019-03-22: Currently, ECharts supports Julia 1.0+ through Jupyter Notebook and the REPL. Supporting Juno and VSCode are planned in the future as WebIO.jl allows

echarts.jl's People

Stargazers

 avatar  avatar  avatar  avatar  avatar  avatar  avatar  avatar  avatar  avatar  avatar  avatar  avatar  avatar  avatar  avatar  avatar  avatar  avatar  avatar  avatar  avatar  avatar  avatar  avatar  avatar  avatar  avatar  avatar  avatar  avatar  avatar  avatar  avatar  avatar  avatar  avatar  avatar  avatar  avatar  avatar  avatar  avatar  avatar  avatar  avatar  avatar  avatar  avatar  avatar  avatar  avatar  avatar  avatar  avatar  avatar  avatar  avatar  avatar  avatar  avatar  avatar  avatar  avatar  avatar  avatar  avatar  avatar  avatar  avatar  avatar  avatar  avatar  avatar  avatar  avatar  avatar  avatar  avatar  avatar  avatar  avatar

Watchers

 avatar  avatar  avatar  avatar  avatar  avatar

echarts.jl's Issues

Improve tooltip!

With #54 making tooltips default, make sure settings for tooltip actually work/make sense for each chart type

Update docs

  • make sure echarts4 references everywhere
  • document theme and its uses
  • update JSON/refactor into importing JSON files instead of literal specification in markdown

Improve theme support

  • clean up theme syntax for echarts4
  • new theme generating function using defaulttheme function
  • newtheme function to inherit from existing theme

Add docstrings

Add docstrings for inline documentation

  • plot methods
  • mutating plot methods

Add assertions/checks

Add assertions for arrays having same dimensions, other necessities not covered through method signatures

Add chart types

support DataFrames.jl 0.19+

I am getting errors running corplot example. Due to DataFrames.jl using df[!,:colname] syntax instead of df[:colname]

└ @ ECharts C:\Users\RTX2080\.julia\packages\ECharts\jt1U8\src\plots\corrplot.jl:57
┌ Warning: `getindex(df::DataFrame, col_ind::ColumnIndex)` is deprecated, use `df[!, col_ind]` instead.
│   caller = #corrplot#355(::Int64, ::String, ::Bool, ::Int64, ::Int64, ::Base.Iterators.Pairs{Union{},Union{},Tuple{},NamedTuple{(),Tuple{}}}, ::typeof(corrplot), ::Array{Float64,2}) at corrplot.jl:58
└ @ ECharts C:\Users\RTX2080\.julia\packages\ECharts\jt1U8\src\plots\corrplot.jl:58
┌ Warning: `setindex!(df::DataFrame, v::AbstractVector, col_ind::ColumnIndex)` is deprecated, use `begin
│     df[!, col_ind] = v
│     df
│ end` instead.
│   caller = #corrplot#355(::Int64, ::String, ::Bool, ::Int64, ::Int64, ::Base.Iterators.Pairs{Union{},Union{},Tuple{},NamedTuple{(),Tuple{}}}, ::typeof(corrplot), ::Array{Float64,2}) at corrplot.jl:58
└ @ ECharts C:\Users\RTX2080\.julia\packages\ECharts\jt1U8\src\plots\corrplot.jl:58
┌ Warning: `getindex(df::DataFrame, col_ind::ColumnIndex)` is deprecated, use `df[!, col_ind]` instead.
│   caller = #corrplot#355(::Int64, ::String, ::Bool, ::Int64, ::Int64, ::Base.Iterators.Pairs{Union{},Union{},Tuple{},NamedTuple{(),Tuple{}}}, ::typeof(corrplot), ::Array{Float64,2}) at corrplot.jl:67
└ @ ECharts C:\Users\RTX2080\.julia\packages\ECharts\jt1U8\src\plots\corrplot.jl:67

TagBot trigger issue

This issue is used to trigger TagBot; feel free to unsubscribe.

If you haven't already, you should update your TagBot.yml to include issue comment triggers.
Please see this post on Discourse for instructions and more details.

If you'd like for me to do this for you, comment TagBot fix on this issue.
I'll open a PR within a few hours, please be patient!

LoadError: ArgumentError: Package FixedPointNumbers Not Installed

While using ECharts throws Error as follows:

julia> using ECharts
[ Info: Precompiling ECharts [top-level]
ERROR: LoadError: ArgumentError: Package FixedPointNumbers [53c48c17-4a7d-5ca2-90c5-79b7896eea93] is required but does not seem to be installed:

  • Run Pkg.instantiate() to install all recorded dependencies.

Environment:
CentOS7.4 64bit

Julia Version:
julia-1.1.0

Dependend Packages Installed:
FixedPointNumbers
Colors
NoveltyColors
ColorBrewer
Parameters
OrderedCollections
JSON

Switch to new Dataset syntax

Instead of having all different data structures, move to common Dataset structure for simplicity. Reuse JSON.json(x::DataFrame) as much as possible to avoid writing custom parsers

Three known security vulnerabilities in JavaScript dependencies

There are three known security vulnerabilities in JavaScript dependencies specified in this repository:

  1. docs/Gemfile.lock specifies ffi version 1.9.21. There is a known vulnerability in this version: CVE-2018-1000201. The recommendation is to upgrade to ffi version 1.9.24.

  2. docs/Gemfile.lock specifies rubyzip version 1.2.1. There is a known vulnerability in this version: CVE-2018-1000544. The recommendation is to upgrade to rubyzip version 1.2.2.

  3. docs/Gemfile.lock specifies jekyll version 3.6.2. There is a known vulnerability in this version: CVE-2018-17567. The recommendation is to upgrade to jekyll version 3.6.3.

Can we update Gemfile.lock to specify appropriately recent versions of these dependencies?

cc: @randyzwitch

Add SVG or Canvas option

Add in to ECharts type (or global?), then pass value:

var chart = echarts.init(containerDom, null, {renderer: 'canvas'});

var chart = echarts.init(containerDom, null, {renderer: 'svg'});

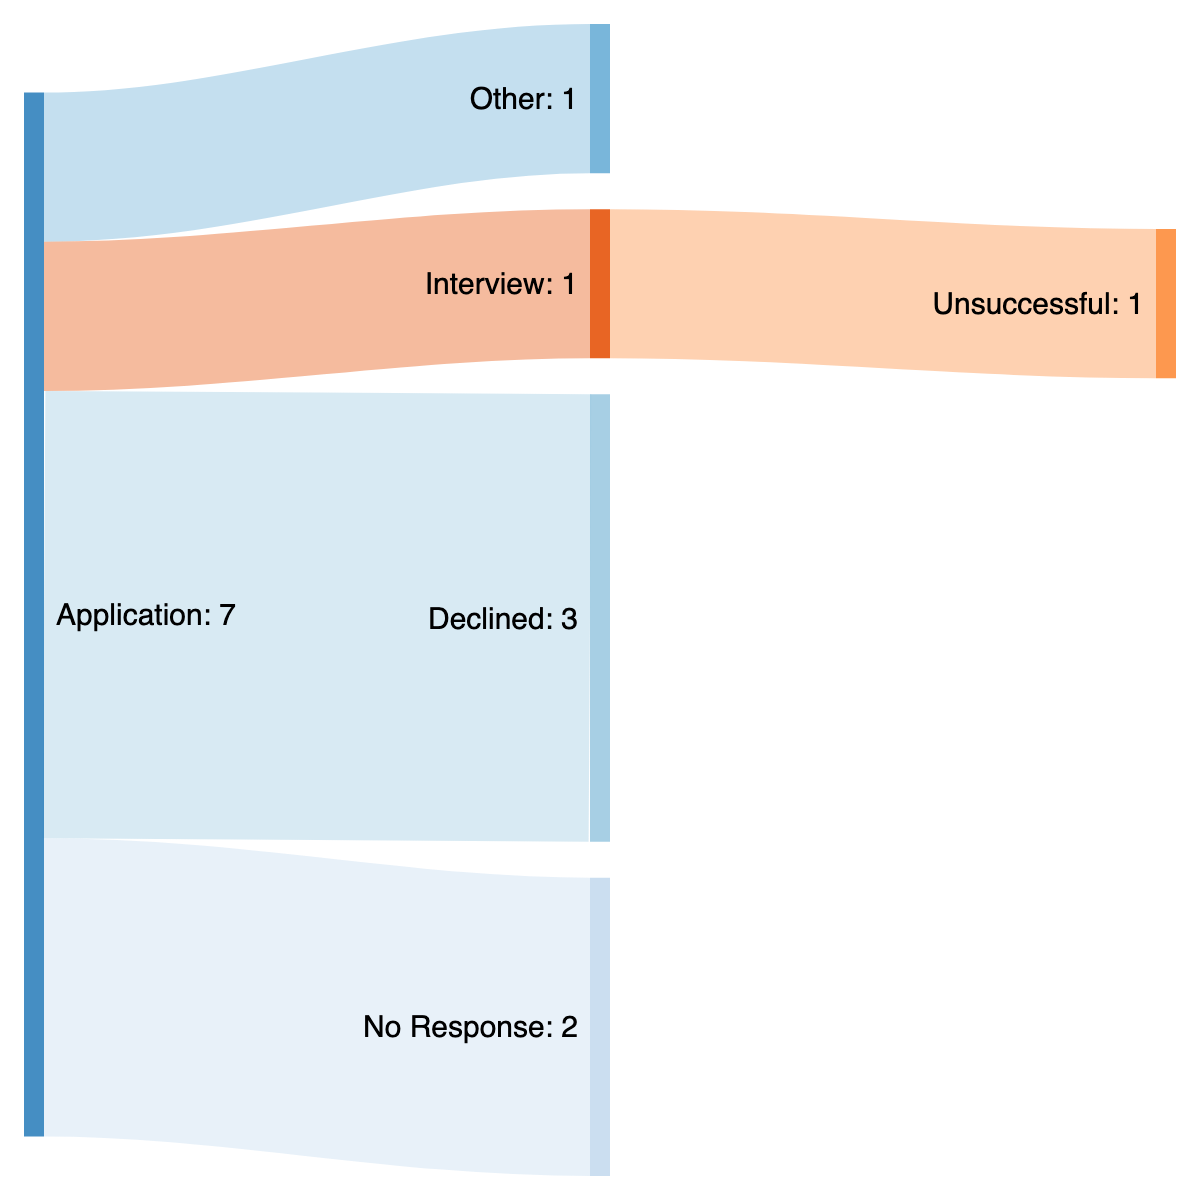
Trouble constructing Sankey diagram

I am having trouble following the documentation for the Sankey diagram. I have previously used an online tool to construct these diagrams, but I am unsure how to translate that to here.

For example, the following "code"

Application [1] Other
Application [3] Declined
Application [2] No Response
Application [1] Interview
Interview [1] Unsuccessful
Interview [0] Successful

Produces this outcome:
sankeymatic_1200x1200

Can you help me translate this into Julia? Sorry about the question, by the way. And thank you for making this package.

Won't download in Atom

I tried to add it to Julia in Atom, but get the following message:

Pkg.add("ECharts")
ERROR: resolve is unable to satisfy package requirements.
The problem was detected when trying to find a feasible version
for package Graphs.
However, this only means that package Graphs is involved in an
unsatisfiable or difficult dependency relation, and the root of
the problem may be elsewhere.

ECharts version

Hi! First of all, thanks for this package! I've just noticed that the last ECharts version is 5.2.0; maybe it could be great to update it on this package. Best regards!

Remove fit step from charts

Wrap StatsBase functions, to make calling histogram work without having to call fit()

  • histogram
  • heatmap
  • kernel density
  • 2D KDE to area

jupyter lab?

I am using jupyter lab now since it seems to be working very well and is the anticipated next gen jupyter as far as i can tell. However, I don't get the output using that. apparently One has do enable javascript somehow through extentions or I guess it can be built in the package? not sure.

Have you had a look at this? I know plotlyjs.jl has similar issues

Add sort keyword to funnel

The default is to sort, but some cool effects can happen if you don't. Add keyword to methods for funnel, with the default as sorted.

Support VSCode

  • Waiting on JuliaGizmos/Blink.jl#139 and associated fixes
  • Make sure rendering works in notebook
    - [ ] Make rendering work in Juno wontfix
  • Make rendering work in VSCode
  • Make rendering work in REPL

Add savefig methods

Add methods for writing JSON to file, writing whole HTML page, GIF/PNG, etc.

Remove dependency on RDatasets

RDatasets only used for testing, but is causing Travis to fail because of unrelated RDatasets issues. Remove dependency to avoid future issues, make package more lightweight

Improve Missings support

  • area: replace with zeros for group methods, document
  • box: doesn't support missing yet (fix input signatures), need to change boxplotstat calculation also
  • corrplot: evaluate, document (call completecases?)

ECharts not working in Pluto Notebooks

I followed the WebIO installation instructions and the following commands still do not work.

using ECharts
x = ["Monday","Tuesday","Wednesday","Thursday","Friday","Saturday","Sunday"]
y = [11, 11, 15, 13, 12, 13, 10]
b = bar(x, y)

Recommend Projects

  • React photo React

    A declarative, efficient, and flexible JavaScript library for building user interfaces.

  • Vue.js photo Vue.js

    🖖 Vue.js is a progressive, incrementally-adoptable JavaScript framework for building UI on the web.

  • Typescript photo Typescript

    TypeScript is a superset of JavaScript that compiles to clean JavaScript output.

  • TensorFlow photo TensorFlow

    An Open Source Machine Learning Framework for Everyone

  • Django photo Django

    The Web framework for perfectionists with deadlines.

  • D3 photo D3

    Bring data to life with SVG, Canvas and HTML. 📊📈🎉

Recommend Topics

  • javascript

    JavaScript (JS) is a lightweight interpreted programming language with first-class functions.

  • web

    Some thing interesting about web. New door for the world.

  • server

    A server is a program made to process requests and deliver data to clients.

  • Machine learning

    Machine learning is a way of modeling and interpreting data that allows a piece of software to respond intelligently.

  • Game

    Some thing interesting about game, make everyone happy.

Recommend Org

  • Facebook photo Facebook

    We are working to build community through open source technology. NB: members must have two-factor auth.

  • Microsoft photo Microsoft

    Open source projects and samples from Microsoft.

  • Google photo Google

    Google ❤️ Open Source for everyone.

  • D3 photo D3

    Data-Driven Documents codes.