PyPSATopo is a tool that allows generating the topographical representation of any arbitrary PyPSA-based network (thanks to the DOT language). Besides easing the understanding of a network by providing its graphical representation, the tool helps debug it given that broken links and missing buses are shown in (slightly) different shapes and colors. Technically speaking, PyPSATopo can be thought of as a reverse engineering tool for PyPSA-based networks.
To get a quick overview of the capabilities of PyPSATopo, simply launch it in a terminal as follows:
python pypsatopo.pyThis will create a PyPSA-based network made of the following components:
# create dummy (PyPSA-based) network
network = pypsa.Network(name = "My Dummy Network")

# add some dummy components to dummy network
network.add("Bus", "oil")
network.add("Bus", "electricity")
network.add("Bus", "transport")
network.add("Generator", "oil", bus = "oil")
network.add("Generator", "solar", bus = "electricity")
network.add("Load", "vehicle", bus = "transport")
network.add("Store", "battery", bus = "electricity")
network.add("Link", "ICEV", bus0 = "oil", bus1 = "transport")
network.add("Link", "BEV", bus0 = "electricity", bus1 = "transport")
... as well as generate the corresponding topographical representation of the network in the SVG format:

PyPSATopo can be installed in the machine using pip, a package management system for Python. To install the tool using pip, open a terminal and execute the following:
pip install pypsatopoPyPSATopo leverages from several components to accomplish its functionalities, namely: Python, PyPSA, Pandas and Dot (from Graphviz). Consequently, these should be installed before running PyPSATopo. While PyPSA and Pandas are automatically installed by PyPSATopo in case they are missing, Dot must be manually installed by the user (see download for additional details). Alternatively, in case of working with Conda (or Miniconda), Dot may be installed automatically by opening a terminal and executing the following:
conda install -c conda-forge python-graphvizAs a reference, PyPSATopo is known to work correctly with the following versions of the components:
-
Python 3.10.8
-
PyPSA 0.21.3
-
Pandas 1.5.3
-
Dot 2.40.1
In addition, PyPSATopo should work in any platform (i.e. operating system) as long as the components that this tool depends on are supported on the target platform. As a reference, the tool is known to work correctly in Windows, Linux and macOS.
PyPSATopo can be used in two different ways to generate the topographical representation of a PyPSA-based network, either through its application programming interface or a command-line interface.
To use PyPSATopo through its application programming interface, the following (generic) recipe should be followed:
# import PyPSATopo module
import pypsatopo

# create (PyPSA-based) network named 'my_network'
my_network = pypsa.Network()

# add components to network 'my_network'
# (...)

# generate topographical representation of network 'my_network' in the SVG format
pypsatopo.generate(my_network)
To use PyPSATopo through a command-line interface, execute the following in a terminal (where my_network.nc refers to the NetCDF file containing the PyPSA-based network):
python pypsatopo.py my_network.ncIn addition, to see all the valid parameters accepted by the tool, specify parameter --help when executing it in a terminal. In other words:
python pypsatopo.py --helpCurrently, PyPSATopo supports some of the most important PyPSA components, namely: Bus, Generator, Load, Store, Link and Line. These are graphically represented by PyPSATopo as follows:
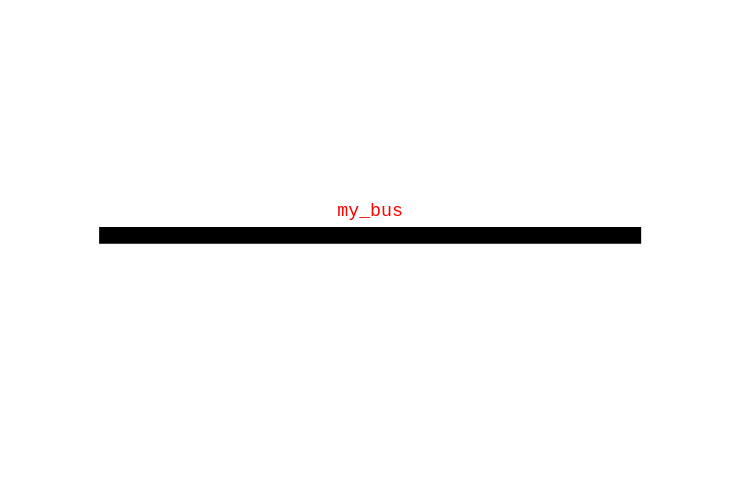
- Bus (fundamental component of the network, to which components like loads, generators and stores attach. It enforces energy conservation for all elements feeding in and out of it - i.e. like Kirchhoff’s Current Law).
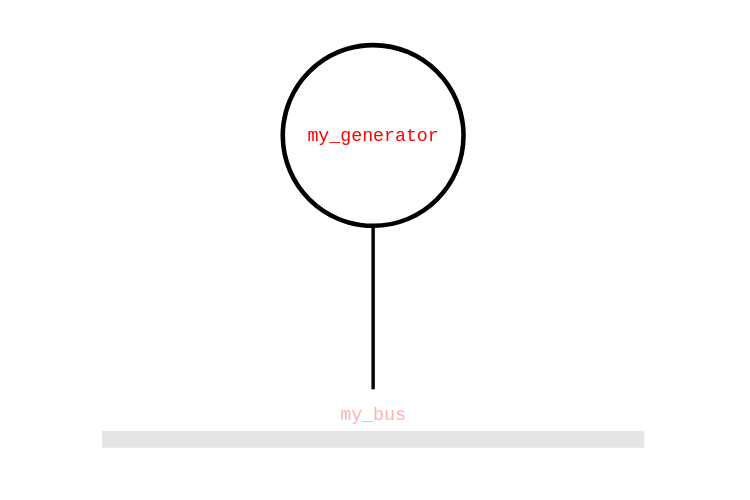
- Generator (attaches to a single bus and can feed in power. It converts energy from its carrier to the carrier-type of the bus to which it is attached).
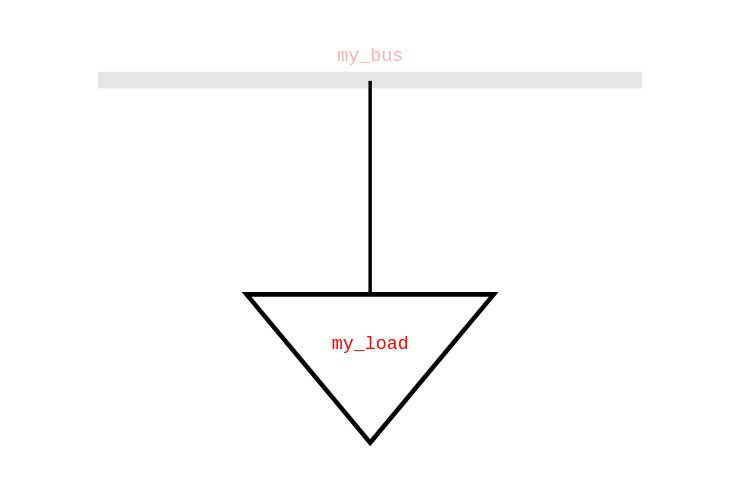
- Load (attaches to a single bus and consumes power as a PQ load).
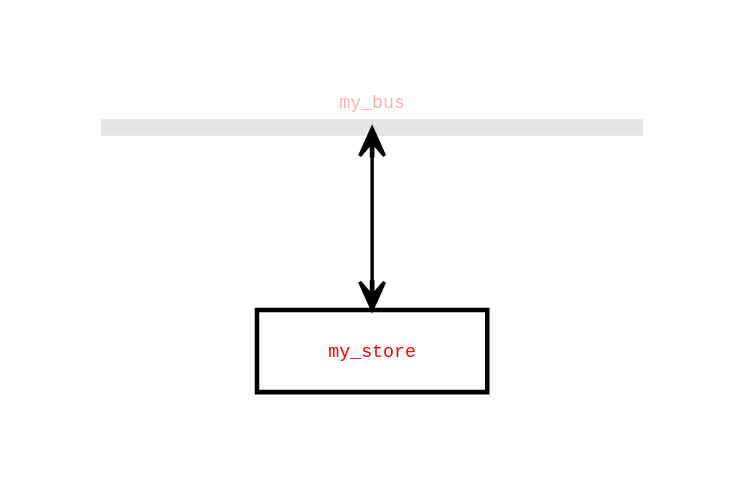
- Store (attaches to a single bus and stores energy only (it cannot convert between energy carriers). It inherits its energy carrier from the bus to which it is attached).
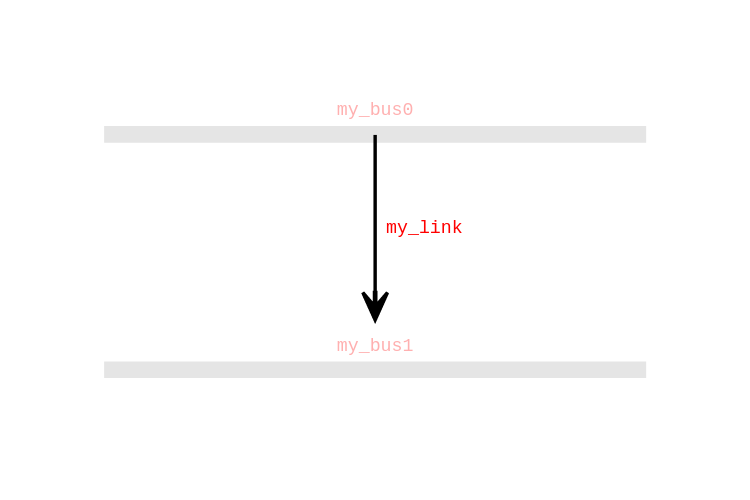
- Link (component for controllable directed flows between two buses with arbitrary energy carriers. It can have an efficiency loss and a marginal cost).

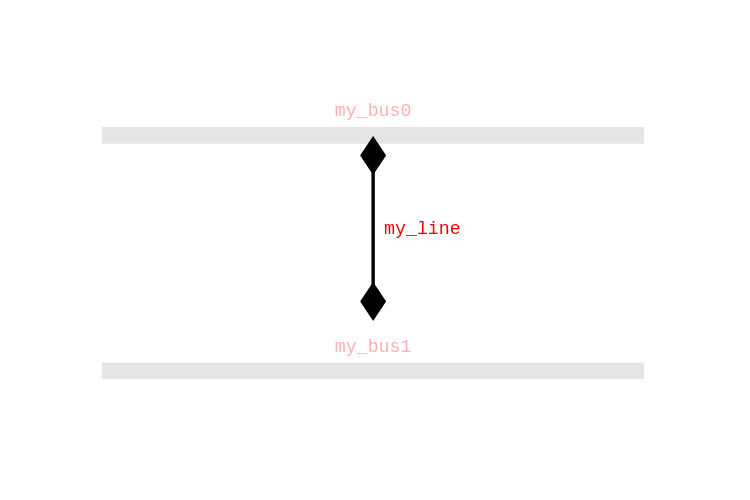
- Line (represents transmission and distribution lines. It can connect either AC buses or DC buses).
As stated previously, PyPSATopo is a tool that allows generating the topographical representation of any arbitrary PyPSA-based network. It basically allows to reverse engineer such type of network to ease its understanding. To that end, PyPSATopo provides several functionalities to cover as many use-cases as possible. These functionalities are described below and their usage exemplified using both the application programming interface and the command-line interface.
-
When generating the topographical representation of a network and in case parameter
file_outputis not specified, PyPSATopo saves the output either in (1) a file namedtopographywith an extension equal to the file format if the tool is used through its application programming interface or (2) a file named as the network file with an extension equal to the file format if the tool is used through a command-line interface. To specify the file name where to save the output, set parameterfile_outputwith the appropriate value. As an example, the following generates the topographical representation of a network and saves the output in a file namedmy_network.svg:pypsatopo.generate(my_network, file_output = "my_network.svg")
python pypsatopo.py my_network.nc --file-output my_network.svg
-
PyPSATopo is able to generate the topographical representation of a network in different formats, namely: SVG, PNG, JPG, GIF and PS. To specify the format, set parameter
file_formatwith the appropriate value. Otherwise, in case the parameter is not set, the default format is SVG. As an example, the following generates the topographical representation of a network in the GIF format:pypsatopo.generate(my_network, file_format = "gif")
python pypsatopo.py my_network.nc --file-format gif
-
By default, PyPSATopo generates the topographical representation of the entire network. This might be particularly overwhelming (visually speaking) depending on the complexity of the network - see PyPSA-Eur network topographical representation to get an idea. To mitigate this, parameters
focusandneighbourhoodmay be utilized (in combination) to focus on a particular aspect/segment of the network. The former tells PyPSATopo which bus to start visiting, while the latter tells how much neighbourhood (around the bus) should be visited (in other words, how much (indirect) components attached to the bus should be included in the representation). For instance, setting parametersfocus = "DK1 0 low voltage"andneighbourhood = 2(which focuses/starts on busDK1 0 low voltageand includes all the components attached to it up to a maximum neighbourhood degree of2) yields this result upon generating PyPSA-Eur network topographical representation. As an example, the following generates the topographical representation of a network focusing/starting on busco2 atmosphereand including all the components attached to it up to a maximum neighbourhood degree of3:pypsatopo.generate(my_network, focus = "co2 atmosphere", neighbourhood = 3)
python pypsatopo.py my_network.nc --focus "co2 atmosphere" --neighbourhood 3Alternatively, parameters
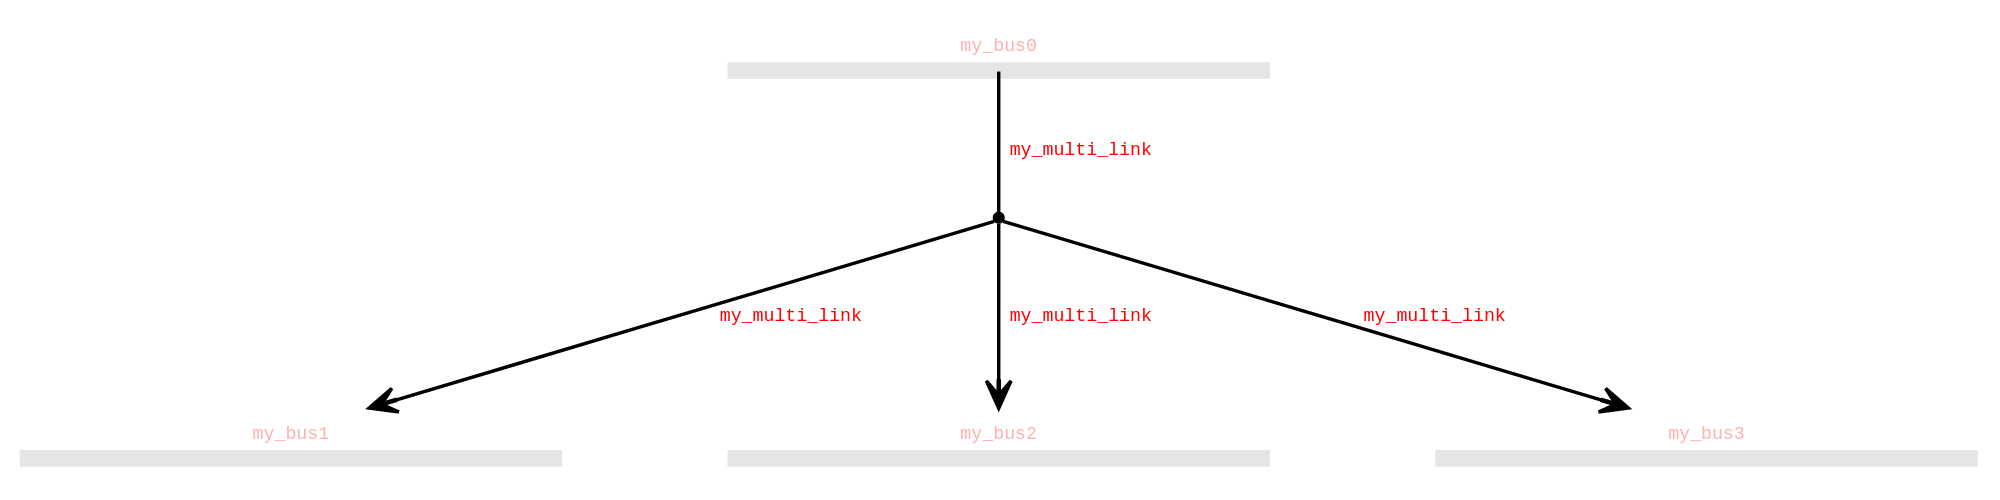
focusandneighbourhoodmay be set with a list of buses and respective neighbourhoods to enable focusing on several aspects/segments of the network at the same time (as opposed to just one bus and respective neighbourhood). Setting these parameters with a list of buses/neighbourhoods (instead of a scalar) enables PyPSATopo to visit and combine the output of each bus into one single topographical representation, potentially generating a disjoint union of graphs. As an example, the following generates the topographical representation of a network by focusing/starting on busesmy_bus0andmy_bus1, and including all the components attached to these buses up to a maximum neighbourhood degree of2and3, respectively:pypsatopo.generate(my_network, focus = ["my_bus0", "my_bus1"], neighbourhood = [2, 3])
python pypsatopo.py my_network.nc --focus my_bus0 my_bus1 --neighbourhood 2 3
-
Just like for links with positive efficiencies, PyPSATopo represents links with negative efficiencies with a line going from bus0 to, e.g., bus1 and an arrow at the end of the line pointing to the latter. In case of the need to invert the sense of the arrow (i.e. to point to bus0 instead) when dealing with negative efficiencies, set parameter
negative_efficiency = False. As an example, the following generates the topographical representation of a network with no negative efficiencies (i.e. all links with negative efficiencies will have their arrows inverted):pypsatopo.generate(my_network, negative_efficiency = False)
python pypsatopo.py my_network.nc --no-negative-efficiency
-
By default, all broken links and missing buses are excluded from the topographical representation of a network. To include and show these in (slightly) different shapes and colors in the representation, set parameter
broken_missing = True. As an example, the following generates the topographical representation of a network where all broken links and missing buses are included in it:pypsatopo.generate(my_network, broken_missing = True)
python pypsatopo.py my_network.nc --broken-missing
-
To color a certain component (namely: bus, generator, load, store or line) in function of its carrier, set parameter
carrier_colorwith a dictionary containing key-value pairs, where key is the name of a carrier and value is a color assigned to it. Acceptable colors are defined here. As an example, the following generates the topographical representation of a network with its components colored inred,greenorbluewhenever their carriers aremy_carrier0,my_carrier1ormy_carrier2, respectively:pypsatopo.generate(my_network, carrier_color = {"my_carrier0": "red", "my_carrier1": "green", "my_carrier2": "blue"})
python pypsatopo.py my_network.nc --carrier-color my_carrier0 red my_carrier1 green my_carrier2 blue
Alternatively, in case
carrier_coloris set toTrue(instead of a dictionary), PyPSATopo automatically assigns a new color to each distinct carrier found in the network and colors all the components associated to the carrier with this color. As an example, the following generates the topographical representation of a network with its components colored in function of their carriers:pypsatopo.generate(my_network, carrier_color = True)
python pypsatopo.py my_network.nc --carrier-color
-
In case fine-grained selection/visiting logic is needed, parameters
bus_filter,generator_filter,load_filter,store_filter,link_filter,line_filterandcarrier_filtermay be utilized in combination or separately. These parameters are expected to be set with (user-defined) regular expressions. While parametersbus_filter,generator_filter,load_filter,store_filter,link_filterandline_filtertell PyPSATopo which buses, generators, loads, stores, links and lines to include/exclude, respectively, the last two also specify which links or lines may be visited (or not) upon generating the topographical representation of a network. Moreover, parametercarrier_filtermay be utilized to include/exclude any component in function of its carrier. As an example, the following generates the topographical representation of a network where only the generators namedwind,solarorCHPare selected (and all other generators are excluded):pypsatopo.generate(my_network, generator_filter = "wind|solar|CHP")
python pypsatopo.py my_network.nc --generator-filter "wind|solar|CHP" -
By default, excluded components (due to, e.g., filtering) are not shown in the topographical representation of a network. In certain situations, however, it might be useful to understand where selected (included) components are located in the full representation (i.e. among excluded components). To show selected components in the topographical representation of a network among excluded components, set parameter
context = True. While selected components are shown with the appropriate colors, excluded components are shown with faded colors (to distinguish them from the formers, visually speaking). As an example, the following generates the topographical representation of a network where only the loads containing the wordagriculturein their names are selected (and all other loads are displayed with faded colors):pypsatopo.generate(my_network, load_filter = ".*agriculture.*", context = True)
python pypsatopo.py my_network.nc --load-filter .*agriculture.* --context
-
Given that it may take some time to process a complex network, PyPSATopo is capable of displaying log messages while processing such a network. Log messages not only facilitate understanding of the stage at which the tool is in the processing pipeline but also potential issues that the network may have. To enable PyPSATopo to display log messages, set parameter
log = True. Otherwise, in case the parameter is not set, the tool behaves quietly by default (i.e. no log messages are displayed). As an example, the following displays log messages while generating the topographical representation of a network:pypsatopo.generate(my_network, log = True)
python pypsatopo.py my_network.nc --log
While parameter
logtells PyPSATopo to display all log messages (independently of information or warning log messages), parameterslog_infoandlog_warningtell PyPSATopo to display only information or warning log messages, respectively. As an example, the following displays only information log messages (and all warning log messages will not be displayed) while generating the topographical representation of a network:pypsatopo.generate(my_network, log_info = True)
python pypsatopo.py my_network.nc --log-info
-
While PyPSATopo strives to generate the topographical representation of a network with the most common/expected graphical features, the tool is flexible enough to let each user adjust/personalize the representation by setting PyPSATopo global variables with appropriate values. As an example, the following generates the topographical representation of a network with a background in blue (instead of transparent):
pypsatopo.BACKGROUND_COLOR = "blue"
pypsatopo.generate(my_network)
PyPSATopo is actively developed and maintained by the Energy Systems Group at Aarhus University (Denmark). Please open a ticket here in case a bug is found or a feature is missing in this tool.


