ricsanfre / pi-cluster Goto Github PK
View Code? Open in Web Editor NEWPi Kubernetes Cluster. Homelab kubernetes cluster automated with Ansible and ArgoCD
Home Page: https://picluster.ricsanfre.com
License: MIT License
Pi Kubernetes Cluster. Homelab kubernetes cluster automated with Ansible and ArgoCD
Home Page: https://picluster.ricsanfre.com
License: MIT License


![renovate[bot] avatar](https://avatars.githubusercontent.com/in/2740?v=4 "renovate[bot]")


Kuberentes Documentation - System Metrics details which Kubernetes components expose metrics in Prometheus format:
These components are:
/metrics endpoint at TCP 10257)/metrics endpoint at TCP 10249)/metrics at Kubernetes API port)/metrics endpoint at TCP 10259)/metrics, /metrics/cadvisor, /metrics/resource and /metrics/probes endpoints at TCP 10250)K3S distribution has a special behavior since in each node only one process is deployed ( k3s-server running on master nodes or k3s-agent running on worker nodes) with all k8s components sharing the same memory.
K3s is emitting the same metrics, from all k8s components deployed in the node, at all '/metrics' endpoints available (api-server, kubelet (TCP 10250), kube-proxy (TCP 10249), kube-scheduler (TCP 10251), kube-controller-manager (TCP 10257). Thus, collecting from all port produces metrics duplicates.
kubelet additional metrics (endpoints /metrics/cadvisor, /metrics/resource and /metrics/probes) are only available at TCP 10250.
Enabling the scraping of all different metrics TCP ports (kubernetes components) causes the ingestion of duplicated metrics. Duplicated metrics in Prometheus need to be removed in order to reduce memory and CPU consumption.
As stated in issue #22, there was a known issue in K3S: k3s-io/k3s#2262, where duplicated metrics are emitted by the three components (kube-proxy, kube-scheduler and kube-controller-manager).
The proposed solution by Rancher Monitoring(k3s-io/k3s#2262), was to avoid the scrape of duplicated metrics and activate only the service monitoring of one of the components. (i.e. kube-proxy).
That solution was implemented (see #22 (comment)) and it solved the main issue (out-of-memory).
Endpoints currently being scrapped by Prometheus are
After deeper analysis on the metrics scrapped by Prometheus, it is clear that K3S is emitting duplicated metrics in all endpoints.
Example 1: API-server metrics emitted by kube-proxy, kubelet and api-server endpoints running on master server

Example 2: kubelet metrics emitted by kube-proxy, kubelet and api-server

Example3: kubepoxy metrics: kubeproxy_sync_proxy_rules_duration_seconds_bucket{le="0.001"}

Ansible templates for creating kubernetes manifest files have .yml extension which makes impossible the validation using yamllint when jinja code is inserted within the template. Those templates should have .j2 extension to skip yamllint validation.
Adding Prometheus monitoring of Velero
.
Velero helm chart has already Prometheus metrics active and it can be configured for creating Prometheus ServiceMonitor resource
From values.yml file:
# Settings for Velero's prometheus metrics. Enabled by default.
metrics:
  enabled: true
  scrapeInterval: 30s
  scrapeTimeout: 10s

  # service metdata if metrics are enabled
  service:
    annotations: {}
    labels: {}

  # Pod annotations for Prometheus
  podAnnotations:
    prometheus.io/scrape: "true"
    prometheus.io/port: "8085"
    prometheus.io/path: "/metrics"

  serviceMonitor:
    enabled: false
    additionalLabels: {}
    # ServiceMonitor namespace. Default to Velero namespace.
    # namespace:
Change ansible code to use the latest version of ansible backup role (ricsanfre.backup) used to perform filesystem level backup of the nodes.
New version, v1.1.1, includes several enhancements as the capability to use different backends (not limited only to Minio S3)
Activate Traefik access logs and forward them to EFK
.
Traefik access logs are not activated by default.
See how-to activate and capture access logs instructions here.
Enabling within K3S cluster the new Kubernetes CSI feature: Volume Snapshots to be able to programmatically create backups and so orchestrate consistent backups:
   kubectl exec pod -- app_feeze_command
   kubectl apply -f volume_snapshot.yml
   # wait till snapshot finish
   kubectl exec pod -- app_unfreeze_command
CSI Snapshot feature is supported by Longhorn. See Longhorn documentation: CSI Snapshot Support. K3S currently does not come with a preintegrated Snapshot Controller, but external controller could be used (https://github.com/kubernetes-csi/external-snapshotter).
Trying to deploy helm kube-prometheus-stack providing values.yml where volume claim templates are configured to use longhorn, prometheus pod did not start.
Logs show the following error:
Helm values overriden
values.yml:
alertmanager:
        alertmanagerSpec:
          storage:
            volumeClaimTemplate:
              spec:
                storageClassName: longhorn
                accessModes: ["ReadWriteOnce"]
                resources:
                  requests:
                    storage: 5Gi
      prometheus:
        prometheusSpec:
          storageSpec:
            volumeClaimTemplate:
              spec:
                storageClassName: longhorn
                accessModes: ["ReadWriteOnce"]
                resources:
                  requests:
                    storage: 5Gi
Pod logs:
kubectl logs prometheus-kube-prometheus-stack-prometheus-0 -n k3s-monitoring
level=info ts=2021-11-02T16:20:48.163Z caller=main.go:443 msg="Starting Prometheus" version="(version=2.28.1, branch=HEAD, revision=b0944590a1c9a6b35dc5a696869f75f422b107a1)"
level=info ts=2021-11-02T16:20:48.163Z caller=main.go:448 build_context="(go=go1.16.5, user=root@fa052cd511a1, date=20210701-15:08:46)"
level=info ts=2021-11-02T16:20:48.163Z caller=main.go:449 host_details="(Linux 5.4.0-1045-raspi #49-Ubuntu SMP PREEMPT Wed Sep 29 17:49:16 UTC 2021 aarch64 prometheus-kube-prometheus-stack-prometheus-0 (none))"
level=info ts=2021-11-02T16:20:48.163Z caller=main.go:450 fd_limits="(soft=1048576, hard=1048576)"
level=info ts=2021-11-02T16:20:48.163Z caller=main.go:451 vm_limits="(soft=unlimited, hard=unlimited)"
level=error ts=2021-11-02T16:20:48.164Z caller=query_logger.go:87 component=activeQueryTracker msg="Error opening query log file" file=/prometheus/queries.active err="open /prometheus/queries.active: permission denied"
panic: Unable to create mmap-ed active query log

goroutine 1 [running]:
github.com/prometheus/prometheus/promql.NewActiveQueryTracker(0xfffff37ab1ba, 0xb, 0x14, 0x2ee5e18, 0x40001feff0, 0x2ee5e18)
        /app/promql/query_logger.go:117 +0x3a4
main.main()
        /app/cmd/prometheus/main.go:479 +0x4de4
NFTables configuration details is not included in the documentation
gateway.md file just contain "TBD: CONTENT nftables.conf"
Activating Merge_Log capability in fluentd makes some logs to be rejected by elasticsearch. In my case elasticsearch log entries are rejected.
Fluent-bit kubernetes filter configuration:
  [FILTER]
      Name kubernetes
      Match kube.*
      Kube_Tag_Prefix kube.var.log.containers.
      Merge_Log On
      Merge_Log_Trim Off
      Merge_Log_Key log_processed
      Keep_Log Off
      K8S-Logging.Parser On
      K8S-Logging.Exclude On
      Annotations Off
      Labels Off
Errors printed by fluentd aggregator (NOTE: fluentd is configured to trace received errors from Elastic search API (log_es_400_reason configuration parameter)
fluentd aggregator is printing the following log error: 400 - Rejected by Elasticsearch [error type]: mapper_parsing_exception [reason]: 'failed to parse field [log_processed.event] of type [text] in document with..
2022-07-28 10:06:38 +0000 [warn]: #0 dump an error event: error_class=Fluent::Plugin::ElasticsearchErrorHandler::ElasticsearchError error="400 - Rejected by Elasticsearch [error type]: mapper_parsing_exception [reason]: 'failed to parse field [log_processed.event] of type [text] in document with id 'FlZFRIIBx-uCpR9Dw1hC'. Preview of field's value: '{dataset=elasticsearch.server}''" location=nil tag="kube.var.log.containers.efk-es-default-0_k3s-logging_elasticsearch-4718c3ca3bf9f531d5b6768c86ccb0ac8be225a10d808efcbf639271be548daf.log" time=2022-07-28 10:06:33.636543380 +0000 record={"time"=>"2022-07-28T12:06:33.63654338+02:00", "log_processed"=>{"@timestamp"=>"2022-07-28T10:06:33.635Z", "log.level"=>"INFO", "message"=>"[.kibana_8.1.2_001/TWOgIY07SMG_rsrY2lsnoQ] update_mapping [_doc]", "ecs.version"=>"1.2.0", "service.name"=>"ES_ECS", "event.dataset"=>"elasticsearch.server", "process.thread.name"=>"elasticsearch[efk-es-default-0][masterService#updateTask][T#1]", "log.logger"=>"org.elasticsearch.cluster.metadata.MetadataMappingService", "trace.id"=>"3160dd83044e7c2a51943a5081e29a15", "elasticsearch.cluster.uuid"=>"TWqBjJ-MRXetwJjQ2liV7Q", "elasticsearch.node.id"=>"qIMyAjJRQxKQM-kUEBmQtQ", "elasticsearch.node.name"=>"efk-es-default-0", "elasticsearch.cluster.name"=>"efk"}, "k8s.cluster.name"=>"picluster", "@timestamp"=>"2022-07-28T10:06:33.636543380+00:00", "tag"=>"kube.var.log.containers.efk-es-default-0_k3s-logging_elasticsearch-4718c3ca3bf9f531d5b6768c86ccb0ac8be225a10d808efcbf639271be548daf.log"}
Elasticsearch original log is
{"@timestamp": "2022-07-28T10:06:33.635Z",
 "log.level": "INFO",
"message":"[.kibana_8.1.2_001/TWOgIY07SMG_rsrY2lsnoQ] update_mapping [_doc]"
 "ecs.version": "1.2.0",
"service.name":"ES_ECS",
"event.dataset":"elasticsearch.server"}
In this case event field is JSON mapping instead of a text field, which is expected by ES because the mapping rule for this field has been created when loaded another log coming from MetalLB, where event field is also present.
Metal LB log:
{"caller":"service_controller.go:95",
 "controller":"ServiceReconciler",
 "event":"force service reload",
 "level":"info",
 "ts":"2022-07-28T09:45:27Z"
}Adding Minio metrics to Prometheus
.
See Minio documentation: https://docs.min.io/docs/how-to-monitor-minio-using-prometheus.html
Flannel section in networking documentation is missing ("TBD")
When automatically importing a grafana dashboard coming from grafana.com or previously exported through the UI, using Grafana sidecar provisioning container, the following error appears: "Datasource named ${DS_PROMETHEUS} was not found"
Provisioning through sidecar does not automatically change the DataSource input variables defined within json template.
This a known grafana issue: grafana/grafana#10786
Taken from here: grafana/grafana#10786 (comment)
Fix issue with dashboard provisioning
This fixes the error "Datasource named ${DS_PROMETHEUS} was not found" and makes it possible to provision the dashboard via grafana dashboards sidecar.
When installing Longhorn in a namespace annotated to inject automatically linkerd-proxy (implicit annotation), Longhorn installation hangs do not deploying CSI plugin components. longhorn-driver-deployer pod keep son restarting and crashing every time with the same error "Got an error when checking MountProgapgation with node status, Node XX is not support mount propagation" and "Error deploying driver: CSI cannot be deployed because MountPropagation is not set: Node XX is not support mount propagation"
oss@node1:~$ kubectl get pods -n longhorn-system
NAME                                        READY   STATUS             RESTARTS        AGE
longhorn-ui-84f97cf569-c6fcq                2/2     Running            0               15m
longhorn-manager-cc7tt                      2/2     Running            0               15m
longhorn-manager-khrx6                      2/2     Running            0               15m
longhorn-manager-84zwx                      2/2     Running            0               15m
instance-manager-e-86ec5db9                 2/2     Running            0               14m
instance-manager-r-cdcb538b                 2/2     Running            0               14m
engine-image-ei-4dbdb778-bc9q2              2/2     Running            0               14m
instance-manager-r-0d602480                 2/2     Running            0               14m
instance-manager-e-429cc6bf                 2/2     Running            0               14m
instance-manager-e-af266d5e                 2/2     Running            0               14m
instance-manager-r-02fad614                 2/2     Running            0               14m
engine-image-ei-4dbdb778-2785c              2/2     Running            0               14m
engine-image-ei-4dbdb778-xrj4k              2/2     Running            0               14m
longhorn-driver-deployer-6bc898bc7b-nmzkc   1/2     CrashLoopBackOff   6 (2m46s ago)   15m
longhorn-dirver-deployer logs:
oss@node1:~$ kubectl logs longhorn-driver-deployer-6bc898bc7b-nmzkc longhorn-driver-deployer -n longhorn-system
2022/03/20 12:42:58 proto: duplicate proto type registered: VersionResponse
W0320 12:42:58.148324       1 client_config.go:552] Neither --kubeconfig nor --master was specified.  Using the inClusterConfig.  This might not work.
time="2022-03-20T12:43:48Z" level=warning msg="Got an error when checking MountPropagation with node status, Node node2 is not support mount propagation"
time="2022-03-20T12:43:48Z" level=fatal msg="Error deploying driver: CSI cannot be deployed because MountPropagation is not set: Node node2 is not support mount propagation"
longhorn-manager logs does not show any informative log
10.42.3.6 - - [24/Mar/2022:11:16:42 +0000] "GET /v1 HTTP/1.1" 200 3871 "" "Go-http-client/1.1"
10.42.3.6 - - [24/Mar/2022:11:16:52 +0000] "GET /v1/nodes/node2 HTTP/1.1" 200 1393 "" "Go-http-client/1.1"
10.42.3.6 - - [24/Mar/2022:11:17:02 +0000] "GET /v1/nodes/node2 HTTP/1.1" 200 1393 "" "Go-http-client/1.1"
10.42.3.6 - - [24/Mar/2022:11:17:12 +0000] "GET /v1/nodes/node2 HTTP/1.1" 200 1393 "" "Go-http-client/1.1"
10.42.3.6 - - [24/Mar/2022:11:17:22 +0000] "GET /v1/nodes/node2 HTTP/1.1" 200 1393 "" "Go-http-client/1.1"
10.42.3.6 - - [24/Mar/2022:11:17:32 +0000] "GET /v1/nodes/node2 HTTP/1.1" 200 1393 "" "Go-http-client/1.1"
time="2022-03-24T11:21:41Z" level=debug msg="Trigger sync backup target" component=backup-store-timer controller=longhorn-setting interval=5m0s node=node2
10.42.3.6 - - [24/Mar/2022:11:22:36 +0000] "GET /v1 HTTP/1.1" 200 3871 "" "Go-http-client/1.1"
10.42.3.6 - - [24/Mar/2022:11:22:46 +0000] "GET /v1/nodes/node2 HTTP/1.1" 200 1393 "" "Go-http-client/1.1"
10.42.3.6 - - [24/Mar/2022:11:22:51 +0000] "GET /v1/nodes/node2 HTTP/1.1" 200 1393 "" "Go-http-client/1.1"
10.42.3.6 - - [24/Mar/2022:11:23:01 +0000] "GET /v1/nodes/node2 HTTP/1.1" 200 1393 "" "Go-http-client/1.1"
10.42.3.6 - - [24/Mar/2022:11:23:11 +0000] "GET /v1/nodes/node2 HTTP/1.1" 200 1393 "" "Go-http-client/1.1"
10.42.3.6 - - [24/Mar/2022:11:23:16 +0000] "GET /v1/nodes/node2 HTTP/1.1" 200 1393 "" "Go-http-client/1.1"gateway), will be secured by Traefik acting as reverse proxy of Elasticsearch HTTP service, forcing TLS to the incoming communications (redirecting all HTTP traffic to HTTPS) and obtaining the corresponding TLS certificate from Cert-manager.In current implementation application stack traces (java, go, python), multi-line logs, are split into different log entries.
Activate fluentbit new built-in mutiline parsers/filters (availible since v1.8.2) to concatenate Multiline or Stack trace log messages. In my current implementation, multiline parser is configured for Tail input (using cri parsers) to parse possible multiline containerd logs.
It is needed to apply mutiline filter to the log field, discovered while parsing containerd log (cri parse). to process this stack traces generated by different languages (go, python, java).
See furthter details multiline filter doc.
Filter like the following should be added
    [FILTER]
        name                  multiline
        match                 *
        multiline.key_content log
        multiline.parser      java,python,go
Restic, used jointly with Velero to perform pod's volumes backups is unable to connect through HTTPS to S3 backend using self-signed certificates
Velero backup shows the error: x509: certificate signed by unknown authority
time="2021-12-17T15:21:19Z" level=error msg="Error backing up item" backup=velero-system/nginx-backup error="restic repository is not ready: error running command=restic init --repo=s3:https://s3.picluster.ricsanfre.com:9091/k3s-velero/restic/nginx-example --password-file=/tmp/credentials/velero-system/velero-restic-credentials-repository-password --cache-dir=/scratch/.cache/restic, stdout=, stderr=Fatal: create repository at s3:https://s3.picluster.ricsanfre.com:9091/k3s-velero/restic/nginx-example failed: client.BucketExists: Get \"https://s3.picluster.ricsanfre.com:9091/k3s-velero/?location=\": x509: certificate signed by unknown authority\n\n: exit status 1" error.file="/go/src/github.com/vmware-tanzu/velero/pkg/restic/repository_ensurer.go:186" error.function="github.com/vmware-tanzu/velero/pkg/restic.(*repositoryEnsurer).EnsureRepo" logSource="pkg/backup/backup.go:435" name=nginx-deployment-7f69d8b6fb-dtt26
Configure Prometheus to monitor Traefik
.
See instructions details here and how to customized k3s packaged Traefik within K3S in the official doc (https://rancher.com/docs/k3s/latest/en/networking/#traefik-ingress-controller) and (https://rancher.com/docs/k3s/latest/en/helm/#customizing-packaged-components-with-helmchartconfig)
Orphaned pod volumes cleaning errors flooding the worker logs after shutting down the cluster with k3s-killall.sh script
Messages of type: "Orphaned pod found, but error not a directory occurred when trying to remove the volumes dir"
Kubernetes version
ubuntu@node1:~$ kubectl version
Client Version: version.Info{Major:"1", Minor:"21", GitVersion:"v1.21.4+k3s1", GitCommit:"3e250fdbab72d88f7e6aae57446023a0567ffc97", GitTreeState:"clean", BuildDate:"2021-08-19T19:10:03Z", GoVersion:"go1.16.6", Compiler:"gc", Platform:"linux/arm64"}
Server Version: version.Info{Major:"1", Minor:"21", GitVersion:"v1.21.4+k3s1", GitCommit:"3e250fdbab72d88f7e6aae57446023a0567ffc97", GitTreeState:"clean", BuildDate:"2021-08-19T19:10:03Z", GoVersion:"go1.16.6", Compiler:"gc", Platform:"linux/arm64"}K3S cluster running with pods making use of Longhorn´s PV. After shutting down the cluster using k3s-killall.sh, some orphaned pods cannot be removed from the disk.
Kubelet is showing continuously message errors of type:
Sep 28 18:36:57 node2 k3s[1695]: E0928 18:36:57.504953    1695 kubelet_volumes.go:225] "There were many similar errors. Turn up verbosity to see them." err="orphaned pod \"add7d502-4f1e-4719-b9d1-7923735c303e\" found, but error not a directory occurred when trying to remove the volumes dir" numErrs=1
Sep 28 18:36:59 node2 k3s[1695]: E0928 18:36:59.508241    1695 kubelet_volumes.go:225] "There were many similar errors. Turn up verbosity to see them." err="orphaned pod \"add7d502-4f1e-4719-b9d1-7923735c303e\" found, but error not a directory occurred when trying to remove the volumes dir" numErrs=1
Orphaned pod add7d502-4f1e-4719-b9d1-7923735c303e was making use of the pvc pvc-78512e96-ce2a-44a8-b721-404f610beace and the corresponding kubelet volumes directory is not empty. There is a file vol_data.json and thus the kubelet is not able to remove the volumes dirs. (Volumes dir must be empty)
root@node2:/var/lib/kubelet/pods/add7d502-4f1e-4719-b9d1-7923735c303e# find .
.
./volumes
./volumes/kubernetes.io~csi
./volumes/kubernetes.io~csi/pvc-78512e96-ce2a-44a8-b721-404f610beace
./volumes/kubernetes.io~csi/pvc-78512e96-ce2a-44a8-b721-404f610beace/vol_data.json
./plugins
./plugins/kubernetes.io~empty-dir
./containers
./containers/elastic-internal-init-filesystem
./containers/elastic-internal-init-filesystem/792fd29b
./containers/elasticsearch
./containers/elasticsearch/35b55481
./containers/elasticsearch/f5322c86
./containers/elasticsearch/8beebd0a
./containers/elasticsearch/a72bb0c3
./containers/elasticsearch/782a83e7
./containers/elasticsearch/40468467
./containers/elasticsearch/3ce70425
./containers/elasticsearch/9adeeee0
./containers/elasticsearch/8a08a007
./containers/elasticsearch/281db259
./containers/elasticsearch/b8500f5b
./containers/elasticsearch/ecbf5b08
./etc-hosts
Deleting manually vol_data.json files, kubelet process is able to clean the orphaned pod.
Upgrade Elastic Search to use 8.x
Add a Event Streaming Platform, Kafka, to the cluster
Use Strimzi kafka operator to streamline the deployment and configuration
Deploy Kafdrop as Kafka web UI
Integrate Confluent Schema Registry
Deploy Prometheus as monitoring solution of the k3s cluster
Whenever trying to redeploy/upgrade a helm char using ansible kubernetes.core.helm module the following warning appears
[WARNING]: The default idempotency check can fail to report changes in certain cases. Install helm diff for
better results.
helm diff should be installed to do a better indempotency check and avoid this warning.
The only supported way to backup Elasticsearch is via the snapshot and restore APIs. File system level backups, which are the one provided by Velero and Longhorn, does not guarantee a application-consistent backup
S3 object storage, i.e Minio, can be used as repository for Elasticsearch snapshots feature. Elasticsearch's S3 repository plugin need to be installed and configured.
Documentation about how to configure snapshot capability using ECK operator can be found here
.
kube-prometheus-stack helm default installation unable to discover targets of some of the kubernetes components:

The solution implies:
See how to solve this issue here:
k3s-io/k3s#3619
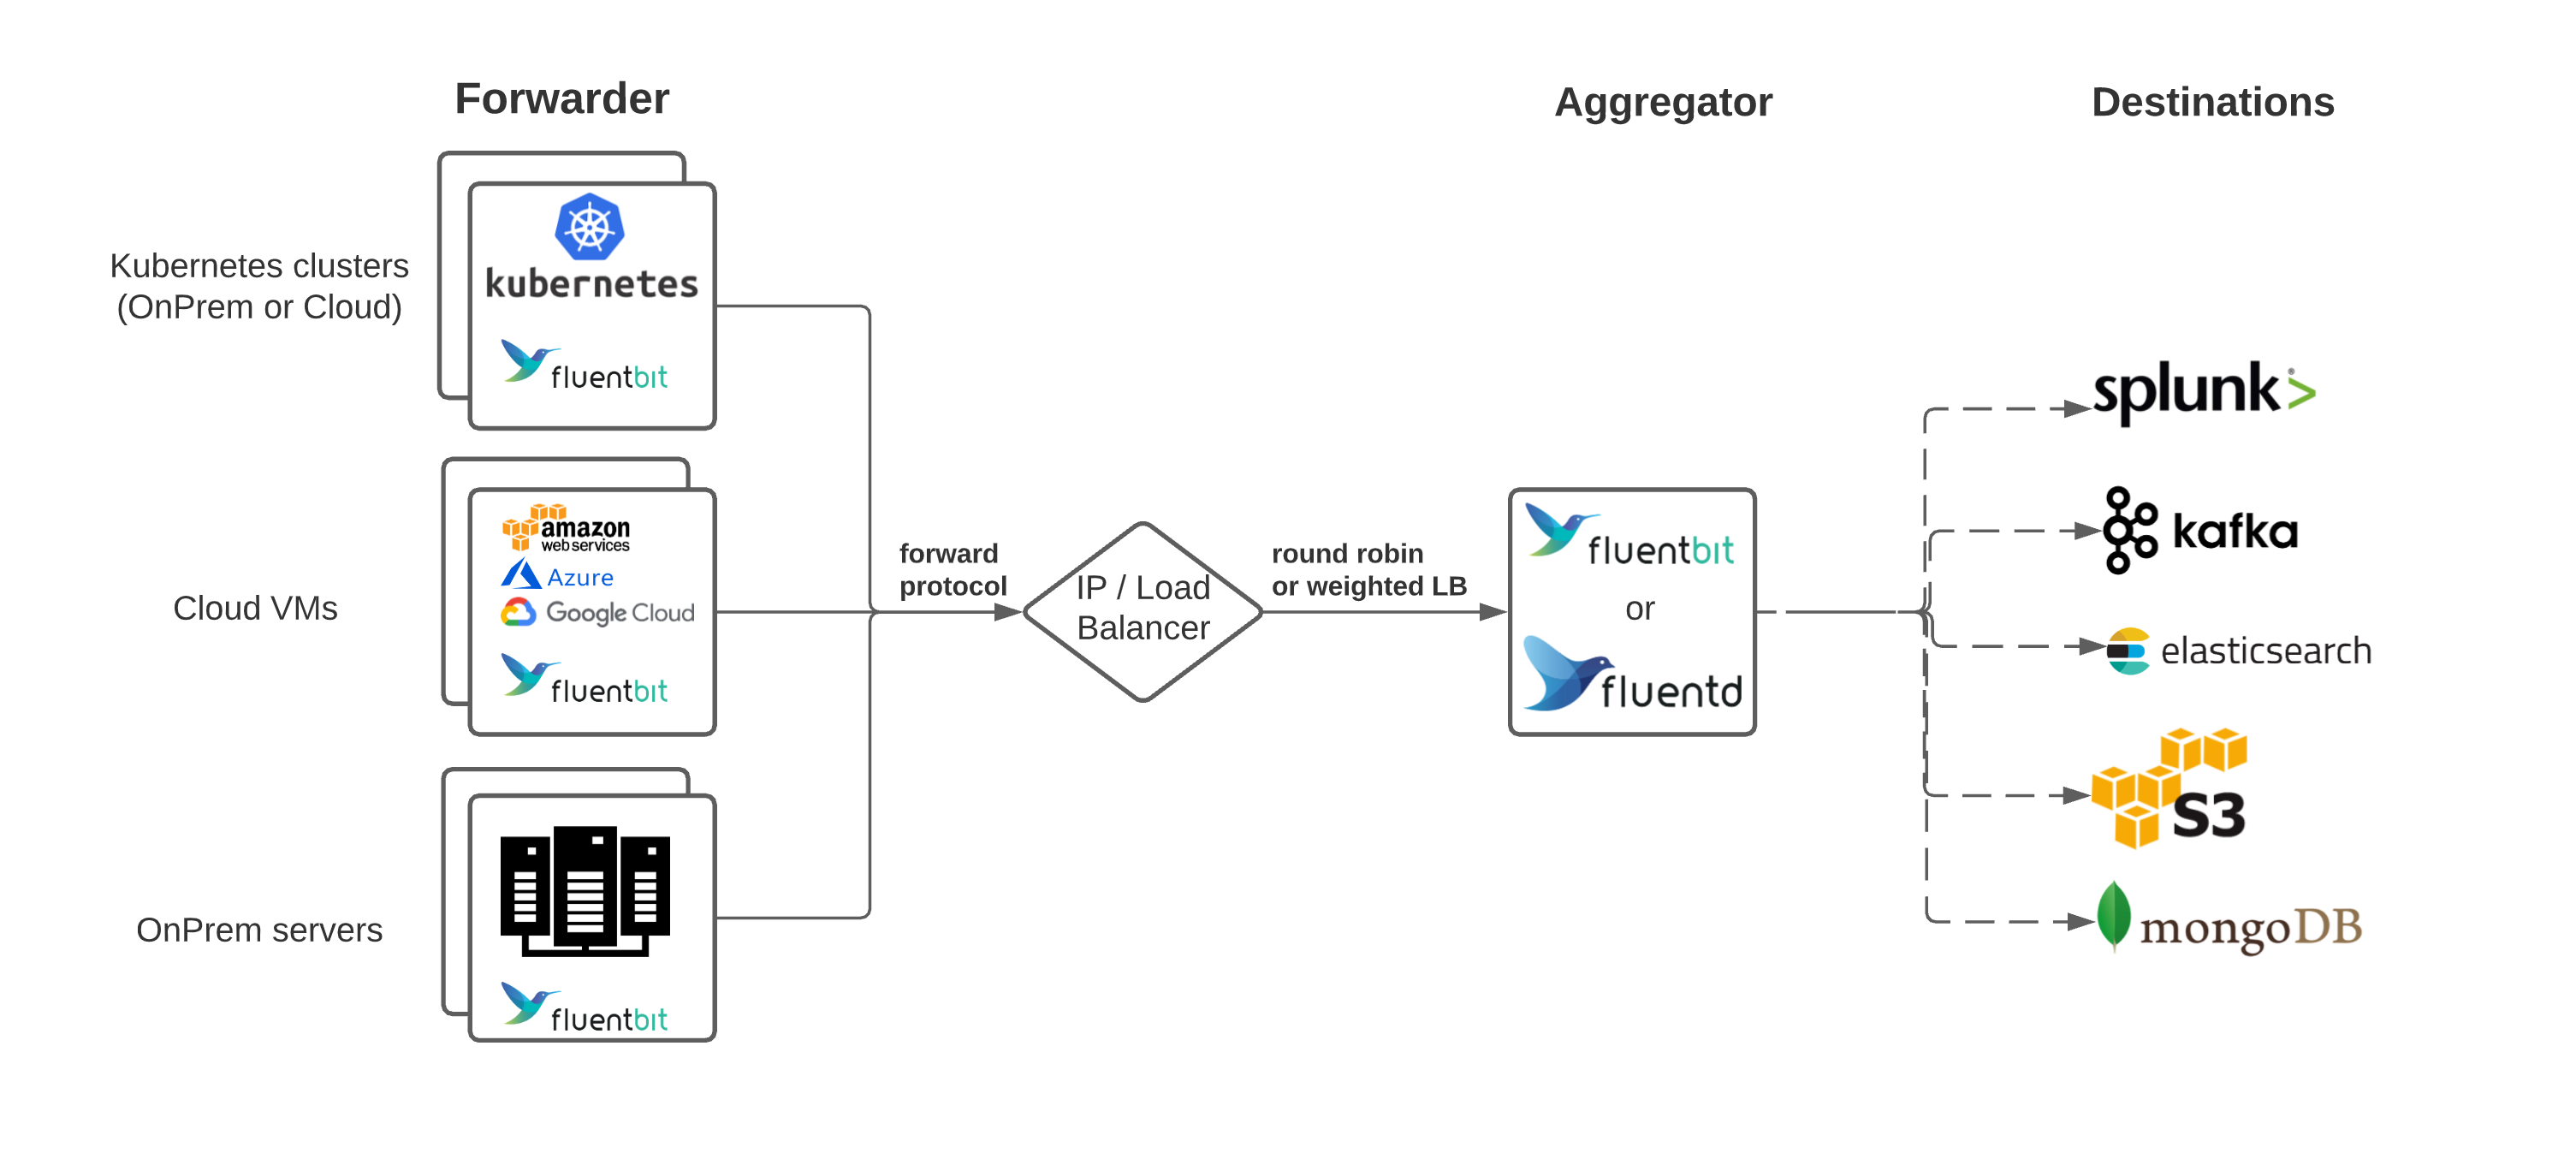
Add logs aggregation layer to logging architecture. From this layer logs can be aggregated, filtered and routed to different destinations to further processing (elasticsearch, kafka, s3, etc.)
source: Common architecture patterns with fluentd and fluentbit
Log aggregation layer can be based on fluentd or fluentbit. Both of them can be used as Log forwarders and Log aggregators fluentbit documentation. The difference is only in the number of plugins (input, output, etc) available.
Fluentbit does not support kafka input plugin (only output). Fluentd supports kafka integration as input and output. Fluentd should be the right choice for log aggregation layer, in case the logging architecture evolve in future to have a Kafka cluster as buffer mechanism between log forwarders and log aggregators.
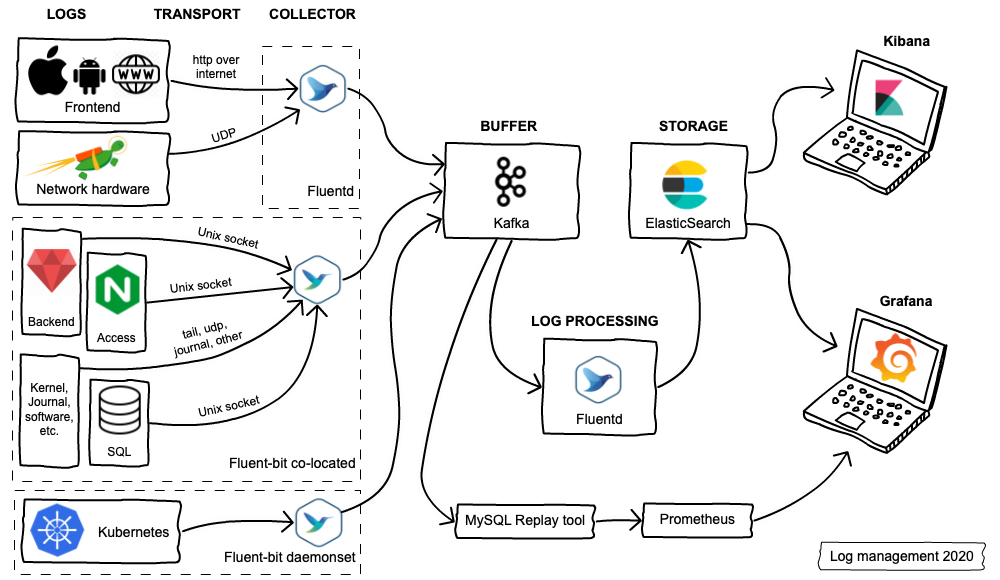
source: One Year of Log Management at Vinted
Changes to the current logging architecture:
Configure fluentbit's node-exporter-metric and prometheus-exporter plugins to expose gateway metrics that can be collected by Prometheus.
Integrate those metrics into Grafana Dashboards
K3s server process exits with failure:
Jul 23 12:08:46 node1 k3s[5237]:       --version version[=true]           Print version information and quit
Jul 23 12:08:46 node1 k3s[5237]: time="2022-07-23T12:08:46+02:00" level=fatal msg="controller-manager exited: unknown flag: --address"
Jul 23 12:08:47 node1 systemd[1]: k3s.service: Main process exited, code=exited, status=1/FAILURE
Jul 23 12:08:47 node1 systemd[1]: k3s.service: Failed with result 'exit-code'.
This is due to the address deprecated argument I am passing to controller-manager and scheduler through installation
k3s_install.sh server
   --write-kubeconfig-mode '0644'
  --disable 'servicelb'
  --node-taint 'node-role.kubernetes.io/master=true:NoSchedule'
  --kube-controller-manager-arg 'bind-address=0.0.0.0'
  --kube-controller-manager-arg 'address=0.0.0.0'
  --kube-proxy-arg 'metrics-bind-address=0.0.0.0'
  --kube-scheduler-arg 'bind-address=0.0.0.0'
  --kube-scheduler-arg 'address=0.0.0.0'
--kube-controller-manager-arg 'address=0.0.0.0' and --kube-scheduler-arg 'address=0.0.0.0' must be removed.
Fluentbit configuration in external nodes (gateway and pimaster) is not including the proper configuration files. In configuration file sections INPUT and OUTPUT are missing
It seems that commit 5755ca7 broke the configuration.
Since Kubernetes 1.21 there is Graceful node shutdown This feature, still in beta status is documented here. and it ensures that pods follow the normal pod termination process during the node shutdown.
Since I always shutdown my cluster when I finish my testing/learning, pods not always shutdown gracefully and the cluster sometimes remain in a inconsistent status forcing me to reset the whole installation.
To activate this feature in K3S cluster the instruction in this k3s discussion can be followed.
Configure Prometheus to monitor Longhorn
.
See official longhorn documentation
Feature Description: Design and implement the backup infrastructure architecture and backup/restore procedures
Scope: At least backup procedures for K3S cluster database (etcd) and Longhorn Persistent Volumes.
Official documentation can be found here
Official documentation can be found here. For implementing the backup is needed to define a backup target, external storage system where longhorn volumes are backed to and restore from. Longhorn support NFS and S3 based backup targets.
For S3, open-source Minio could be used.
Move cluster pi documentation to a website based on github pages and create a dedicated site picluster.ricsanfre.com
Move documentation to a docs directory and activate Github Pages.
Feature Description: Configure Traefik Ingress Controller to use SSL certificates and HTTPS with any web service exposed by the K3S cluster.
Scope: Integrate cert-manager to automatically generate and maintain the SSL certificates used by Traefik.
Introduce ServiceMesh architecture to add observability, traffic management, and security capabilities to internal communications within the cluster.
Most known Service Mesh implementation, Istio, is not currently supporting ARM64 architecture.
Linkerd, which is a CNCF graduated project, does support ARM64 architectures since release 2.9 (https://linkerd.io/2020/11/09/announcing-linkerd-2.9/)
Currently Kuberenetes Loadbalancer service are not specifying any static IP address (Ingress Controller or Elasticsearch which need to be accessible.
Since DNS is used for accessing cluster services, a static IP address need to be assigned to each of them, instead of using any IP from the Metal LB pool (current behaviour).
Metal LB supports the specification of a static IP address when specifying the Kubernets Service resource of type LoadBalancer. See documentation: https://metallb.universe.tf/usage/#requesting-specific-ips
Add to cert-manager configuration Let's Encrypt as SSL certificate provider
Lets Encrypt provide publicly validated TLS certificates for free. Not need to generate auto-signed SSL Certificates for the websites that are not automatic validated by HTTP browsers.
Let's Encrypt uses two mechanisms before issuing the certificate to validate that we own the DNS domain: DNS validation or HTTP validation mechanism. HTTP validation implies opening to Internet my home cluster services, which it is not a valid option for my home lab. DNS validation should be used instead.
Cert-manager by default support several DNS providers to automatically configure the requested DNS record challenge. For supporting additional DNS providers webhooks can be developed. See supported list and further documentation here.
IONOS, my DNS server provider, is not in the list of supported ones.
Since Dec 2020, IONOS launched an API for remotely configure DNS, and so the integration could be possible as it is detailed in this post. This new API can be used as well for developing a Certbot plugin (Cerbot is an opensource software to automate the interaction with Let's Encrypt). See git repository (https://github.com/helgeerbe/certbot-dns-ionos)
Unfortunately IONOS API is part of a beta program that it is not available yet in my location (Spain).
Right now the PODs consuming the most resources are ES, Kibana and Prometheus:
Top PODs by memory
kubectl top pods -A --sort-by='memory'
NAMESPACE            NAME                                                        CPU(cores)   MEMORY(bytes)
k3s-logging          efk-es-default-0                                            165m         1432Mi
k3s-monitoring       prometheus-kube-prometheus-stack-prometheus-0               335m         1168Mi
k3s-logging          efk-kb-66f7cdc8bd-hc4mb                                     222m         544Mi
k3s-monitoring       kube-prometheus-stack-grafana-645d765844-m4q5r              55m          207Mi
k3s-logging          fluentd-69bff468c6-f9dgc                                    37m          133Mi
linkerd              linkerd-destination-787d745598-jh6pj                        9m           69Mi
longhorn-system      longhorn-manager-wmpx4                                      32m          64Mi
longhorn-system      longhorn-manager-wmpj8                                      20m          62Mi
longhorn-system      longhorn-manager-r22m9                                      27m          57Mi
velero-system        velero-574c749cb6-tlwwl                                     4m           52Mi
certmanager-system   certmanager-cert-manager-cainjector-78cd7b475-qc7vm         3m           50Mi
longhorn-system      instance-manager-r-5be28d03                                 34m          50Mi
longhorn-system      instance-manager-r-d15d9bab                                 33m          49Mi
Top PODs by cpu
kubectl top pods -A --sort-by='cpu'
NAMESPACE            NAME                                                        CPU(cores)   MEMORY(bytes)
k3s-monitoring       prometheus-kube-prometheus-stack-prometheus-0               236m         1199Mi
k3s-logging          efk-kb-66f7cdc8bd-hc4mb                                     226m         544Mi
k3s-logging          efk-es-default-0                                            144m         1434Mi
longhorn-system      instance-manager-e-6cc59123                                 81m          30Mi
longhorn-system      instance-manager-e-aa8e1208                                 67m          28Mi
longhorn-system      instance-manager-r-04a02b6c                                 36m          38Mi
longhorn-system      instance-manager-r-d15d9bab                                 34m          48Mi
longhorn-system      instance-manager-r-5be28d03                                 33m          50Mi
longhorn-system      longhorn-manager-wmpx4                                      29m          65Mi
k3s-logging          fluentd-69bff468c6-f9dgc                                    28m          133Mi
kube-system          metrics-server-668d979685-rdgcn                             25m          23Mi
k3s-monitoring       kube-prometheus-stack-grafana-645d765844-m4q5r              24m          203Mi
longhorn-system      longhorn-manager-wmpj8                                      24m          64Mi
Some changes to try
Adding Elasticsearch and Fluentbit metrics
.
Fluentbit exports prometheus metrics when enabling its built-in HTTP server. Metrics are available at /api/v1/metrics/prometheus endpoint. See fluentbit documentation
For exporting elasticsearch metrics, a Exporter (elasticsearch-exporter) maintained by Prometheus' community can be used. (https://github.com/prometheus-community/elasticsearch_exporter)
After configuring a backup target (Minio S3 server), Longhorn UI options for taking volumes backup/snapshots appear as disabled.
Document tracking the design and decision taking and final implementation within the repo (https://github.com/ricsanfre/pi-cluster/blob/master/documentation/logging.md)
Kibana ingress rule is not configured properly. Only HTTP protocol is enabled and no TLS connection is used.
All my homelab RaspberryPI nodes are configured in Europe/Madrid Timezone: gateway and k3s nodes
For k3s cluster nodes I am using Fluentd deployed as daemonset for parsing node logs (/var/log/syslog and /var/log/auth.log) without issues of generating logs in the future. Fluentd parsing configuration enables the definition of Local Time Zone
But for gateway node I am using fluentbit as lightweight version of fluentd. Fluentbit when parsing local syslog and auth.log files is parsing the events extracting properly the timestamp but they are stored in elasticsearch in the future (with timestamps that are 2 hours ahead of the actual timestmap).
There is an issue with Fluetbit which is assuming UTC timezone for all logs. There is parser configuration option Time_Offset available to resolve this, but it allows only to configure fixed UTC offsets not taking into account variable offsets. In my local time zone because of the summer daylight saving, there is UTC+1 offset in Winter and UTC+2 offset in Summer.
See open issue in fluentbit git repo fluent/fluent-bit#593
Improve current Monitoring platform, based on Prometheus (metrics) and EFK (logs) to a Observability Platform adding traces monitoring and a single plane of glass.
Explore solution based on Loki (logs), Tempo (traces), Prometheus (metrics) and Grafana as single plane of glass for monitoring.
Main requirements
Loki as complement of the current EFK platform, not a replacement. ES is used mainly for Log Analytics (log content is completely indexed) while Loki can be used for Observability (only log labels are indexed) having together logs, metrics and traces in the same Grafana Dashboards.
Current logs collection/distrution layer based on fluentbit/fluentd should be used to feed logs to ES and to Loki, instead of deploying a separate collector (Loki promtail)
Fluentbit/Fluentd Loki plugins are available, so current forwarder/aggregator architecture could be maintained just adding Loki as backend for logs.
Linkerd distributed tracing mechanism should be enabled. See this Grafana's blog entry where the process is explained.
Traefik basic authentication user/password is hardcoded. This basic authentication mechanism is used for those HTTP services lacking of its own authentication process (longhorn, traefik, prometheus, etc.).
Traefik ansible role should be modified to make user/password configurable.
htpasswd tool for generating automatically the user/password taking as inputs role variablesUse fluentbit instead of fluentd for colecting k3s logs. Memory footprint is reduced with fluentbit (650 KB vs 40MB)
See official documentation comparing both solutions: fluentbit vs fluentd.
Fluentbit can be deployed using helm chart maintained by fluent in this repo.
Elasticsearch and Kibana version deployed by ECK operator are not configurable. Version is hardcoded in ECK manifests files.
Redesign the architecture of the cluster to improve performance with new Hardware (SSD disks).
Add dedicated SSD disk to each node of the cluster node to improve performance:
Deployment of Metal LB helm chart failed with message:
"Starting from v0.13.0 configInline is no longer supported. Please see https://metallb.universe.tf/#backward-compatibility".
The values.yml just configured MetalLB in L2 mode and assign a specific address pool:
  configInline:
    address-pools:
      - name: default
          protocol: layer2
          addresses:
            - 10.0.0.100-10.0.0.200
According to metallb documentation some Kuberentes resources must be created to achieve the same effect.
Create a pool:
apiVersion: metallb.io/v1beta1
kind: IPAddressPool
metadata:
  name: first-pool
  namespace: metallb-system
spec:
  addresses:
  - 192.168.1.240-192.168.1.250
Announce the IP pool using L2 protocol
apiVersion: metallb.io/v1beta1
kind: L2Advertisement
metadata:
  name: example
  namespace: metallb-system
spec:
  ipAddressPools:
- first-poolCurrent documentation does not explain anything about what is deployed with kube-prometheus-stack and how it is automatically configured Prometheus, Grafana and cluster is started to be monitored (node-exporter deployment and serviceMonitors)
A declarative, efficient, and flexible JavaScript library for building user interfaces.
🖖 Vue.js is a progressive, incrementally-adoptable JavaScript framework for building UI on the web.
TypeScript is a superset of JavaScript that compiles to clean JavaScript output.
An Open Source Machine Learning Framework for Everyone
The Web framework for perfectionists with deadlines.
A PHP framework for web artisans
Bring data to life with SVG, Canvas and HTML. 📊📈🎉
JavaScript (JS) is a lightweight interpreted programming language with first-class functions.
Some thing interesting about web. New door for the world.
A server is a program made to process requests and deliver data to clients.
Machine learning is a way of modeling and interpreting data that allows a piece of software to respond intelligently.
Some thing interesting about visualization, use data art
Some thing interesting about game, make everyone happy.
We are working to build community through open source technology. NB: members must have two-factor auth.
Open source projects and samples from Microsoft.
Google ❤️ Open Source for everyone.
Alibaba Open Source for everyone
Data-Driven Documents codes.
China tencent open source team.